| Issue |
A&A
Volume 627, July 2019
|
|
|---|---|---|
| Article Number | A13 | |
| Number of page(s) | 36 | |
| Section | Catalogs and data | |
| DOI | https://doi.org/10.1051/0004-6361/201834143 | |
| Published online | 25 June 2019 | |
Second AGILE catalogue of gamma-ray sources⋆
1
INAF-OAS Bologna, Via Gobetti 93/3, 40129 Bologna, Italy
e-mail: This email address is being protected from spambots. You need JavaScript enabled to view it.
2
ASI Space Science Data Center (SSDC), Via del Politecnico snc, 00133 Roma, Italy
3
INAF-Osservatorio Astronomico di Roma, Via di Frascati 33, 00078 Monte Porzio Catone, Italy
4
INAF-IAPS Roma, Via del Fosso del Cavaliere 100, 00133 Roma, Italy
5
Dipartimento di Fisica, Università Tor Vergata, Via della Ricerca Scientifica 1, 00133 Roma, Italy
6
INFN Roma Tor Vergata, Via della Ricerca Scientifica 1, 00133 Roma, Italy
7
Consorzio Interuniversitario Fisica Spaziale (CIFS), Villa Gualino - v.le Settimio Severo 63, 10133 Torino, Italy
8
INAF–IASF Milano, Via E. Bassini 15, 20133 Milano, Italy
9
INFN Pavia, Via Bassi 6, 27100 Pavia, Italy
10
INAF–Osservatorio Astronomico di Cagliari, Via della Scienza 5, 09047 Selargius, CA, Italy
11
INAF–Osservatorio Astronomico di Brera, Via E. Bianchi 46, 23807 Merate, LC, Italy
12
CISAS, University of Padova, Padova, Italy
13
Dipartimento di Fisica, University of Trieste, Via Valerio 2, 34127 Trieste, Italy
14
INFN, sezione di Trieste, Via Valerio 2, 34127 Trieste, Italy
15
School of Physics, University of the Witwatersrand, 1 Jan Smuts Avenue, Braamfontein stateJohannesburg 2050, South Africa
16
ASI, Via del Politecnico snc, 00133 Roma, Italy
Received:
27
August
2018
Accepted:
12
March
2019
Abstract
Aims. We present the second AGILE–GRID catalogue (2AGL) of γ-ray sources in the energy range 100 MeV–10 GeV.
Methods. With respect to previous AGILE–GRID catalogues, the current 2AGL catalogue is based on the first 2.3 years of science data from the AGILE mission (the so-called pointing mode) and incorporates more data and several analysis improvements, including better calibrations at the event reconstruction level, an updated model for the Galactic diffuse γ-ray emission, a refined procedure for point-like source detection, and the inclusion of a search for extended γ-ray sources.
Results. The 2AGL catalogue includes 175 high-confidence sources (above 4σ significance) with their location regions and spectral properties and a variability analysis with four-day light curves for the most significant. Relying on the error region of each source position, including systematic uncertainties, 122 sources are considered as positionally associated with known counterparts at different wavelengths or detected by other γ-ray instruments. Among the identified or associated sources, 62 are active galactic nuclei (AGNs) of the blazar class. Pulsars represent the largest Galactic source class, with 41 associated pulsars, 7 of which have detected pulsation; 8 supernova remnants and 4 high-mass X-ray binaries have also been identified. A substantial number of 2AGL sources are unidentified: for 53 sources no known counterpart is found at different wavelengths. Among these sources, we discuss a subclass of 29 AGILE–GRID–only γ-ray sources that are not present in 1FGL, 2FGL, or 3FGL catalogues; the remaining sources are unidentified in both 2AGL and 3FGL catalogues. We also present an extension of the analysis of 2AGL sources detected in the energy range 50–100 MeV.
Key words: gamma rays: general / catalogs / surveys
Full Tables 10 and 11 (the catalog) are only available at the CDS via anonymous ftp to cdsarc.u-strasbg.fr (130.79.128.5) or via http://cdsarc.u-strasbg.fr/viz-bin/qcat?J/A+A/627/A13.
© ESO 2019
1. Introduction
This paper presents the 2AGL catalogue of high-energy γ-ray sources detected by the AGILE Gamma-Ray Imager Detector (GRID) in the energy range 100 MeV–10 GeV during the first 2.3 years of operations (2007–2009) in the so-called pointing mode. This paper follows three previously published papers: the first AGILE–GRID catalogue of γ-ray sources (1AGL; Pittori et al. 2009), the catalogue of variable γ-ray sources during the first 2.3 years of observations (1AGLR; Verrecchia et al. 2013), and a paper dedicated to the search of AGILE–GRID TeV source counterparts (Rappoldi et al. 2016). Compared to previous investigations, we have implemented several refinements in the analysis of γ-ray sources as follows:
1. A new background event filter, called FM3.119, and new instrument response functions (IRFs), called H0025, were used. The main differences relative to the previous F4 event filter used for the 1AGL catalogue are an improved effective area (Aeff) above 100 MeV and a better characterisation of the point spread function (PSF; Chen et al. 2013; Sabatini et al. 2015). In addition, systematic errors of the IRFs were estimated with greater accuracy.
2. We analyse a larger data set than in the 1AGL, which was based on the first 12 months of observations from July 13, 2007 to June 30, 2008. The 2AGL catalogue is, indeed, based on the entire pointing mode period corresponding to 2.3 years from July 13, 2007 to October 15, 2009.
3. This catalogue employs a new diffuse Galactic emission model, in particular for the Galactic central region.
4. We developed new methods for characterising and localising source candidate seeds, then evaluated for inclusion in the catalogue, using both wavelet techniques and an iterative approach.
5. In the search for associations of AGILE–GRID sources with counterparts at different wavelengths, we used new association procedures.
6. A new version of the AGILE–GRID Science Tools was used (BUILD25), which is publicly available from the AGILE website at SSDC1.
7. Energy dispersion (Chen et al. 2013) has been taken into account in the analysis with the new science tools.
The outline of the paper is as follows. In Sect. 2 we describe the instrument, data reduction, and pointing strategy. In Sect. 3 we describe the AGILE–GRID γ-ray background models used in the data analysis. We then present in Sect. 4 the analysis methods used to build the second AGILE–GRID catalogue of γ-ray sources; 2AGL. Limitations and systematic uncertainties are described in Sect. 5. Our results and the list of the 2AGL γ-ray sources are shown in Sect. 6, where potential counterparts at other wavelengths and correspondences with Fermi-LAT catalogue sources are also discussed. In Sect. 7 we comment on some specific 2AGL sources, divided by classes or sky regions. In Sect. 8 we report on an extension of the 2AGL catalogue where the sources detected in the energy range 50–100 MeV are listed. Finally, in Sect. 9, we discuss our results and make some concluding remarks.
2. AGILE–GRID instrument, data, and observations
2.1. AGILE–GRID instrument
AGILE (Astrorivelatore Gamma ad Immagini LEggero) Tavani et al. (2008, 2009a) is a mission of the Italian Space Agency (ASI) devoted to γ-ray and X-ray astrophysics in the energy ranges 30 MeV–50 GeV, and 18–60 keV, respectively. AGILE was successfully launched on 23 April 2007 in a ∼550 km equatorial orbit with low inclination angle, ∼2.5°.
AGILE was the only mission entirely dedicated to high-energy astrophysics above 30 MeV during the April 2007–June 2008 period. Later it has operated together with the Fermi Large Area Telescope (LAT), launched on June 11, 2008 (Michelson 2008; Atwood et al. 2009). The highly innovative AGILE–GRID instrument is the first of the current generation of high-energy space missions based on solid-state silicon technology.
The AGILE payload detector consists of the silicon tracker (ST; Barbiellini et al. 2001; Prest et al. 2003; Bulgarelli et al. 2010; Cattaneo et al. 2011) the Super-AGILE X-ray detector (Feroci et al. 2007), the CsI(Tl) Mini-Calorimeter (MCAL; Labanti et al. 2009), and an anticoincidence (AC) system (Perotti et al. 2006). The combination of ST, MCAL, and AC forms the Gamma-Ray Imaging Detector (GRID). Accurate timing, positional, and attitude information is provided by the precise positioning System and the two star sensor units. The ST is the core of the AGILE–GRID and plays two roles at the same time: it converts the γ-rays in heavy-Z material layers (245 mm of Tungsten, 0.07 radiation length), where the photon interacts producing an e+e− pair in the detector, and records the electron/positron tracks by a sophisticated combination of silicon microstrip detectors and associated readout, providing 3D hits. The ST consists of a total of 12 trays, the first 10 with the Tungsten converter foil followed by two layers of 16 single-sided, 410 μm thick, 9.5 × 9.5 cm2 silicon detectors with strips orthogonal to each other, the last two trays consisting only of the silicon detectors. The MCAL instrument is composed of 30 CsI(Tl) scintillator bars each one 15 × 23 × 375 mm3 in size, arranged in two orthogonal layers, for a total thickness of 1.5 radiation lengths. In each bar the readout of the scintillation light is accomplished by two custom PIN photodiodes (PD) coupled one at each small side of the bar. The AC system is aimed at a very efficient charged particle background rejection. It completely surrounds all AGILE detectors (Super-AGILE, ST, and MCAL). Each lateral face is segmented in three plastic scintillator layers (0.6 cm thick) connected to photomultipliers placed at the bottom of the panels. A single plastic scintillator layer (0.5 cm thick) constitutes the top-AC whose signal is read by four light photomultipliers placed at the four corners of the structure frame. The AGILE–GRID event processing is operated by on-board trigger logic algorithms (Argan et al. 2004) and by on-ground event filtering (see Sect. 2.2).
2.2. AGILE–GRID response characteristics
Energy estimation and direction reconstruction. The track reconstruction for energy estimation and event direction reconstruction is carried out by an AGILE–GRID specific implementation of the Kalman Filter technique (Giuliani et al. 2006) and provides the incident direction and the energy of the events in the AGILE–GRID reference system.
On-ground background event filter. The FM3.119 is the currently used on-ground background event filter for the scientific analysis of the AGILE–GRID data. The filter assigns a classification flag to each event depending on whether it is recognised as a γ-ray event, a charged particle, a “single-track” event, or an event of uncertain classification (limbo). The filter is based on a boosted decision tree (BDT) technique; this technique is used with success in high-energy physics (HEP) experiments (Yang 2005) in order to select events of interest, the so-called signal events, out of numerous background events. The BDT technique maximises the signal-to-background ratio, efficiently suppressing the background events and, in the meanwhile, keeping a high signal detection efficiency. The selection is done on a majority vote on the result of several decision trees, which are all derived from the same training sample by supplying different event weights during the training. For the development of the FM3.119 filter these techniques have been tuned with one sample of Monte Carlo events, the training sample, and then tested with an independent Monte Carlo sample, i.e. the testing sample. From these simulations 182 descriptor parameters of the interacting event inside the AGILE–GRID are extracted and used for training, with the aim of selecting a subset of these descriptor parameters as discriminant input variables for optimising the event separation. A final set of 57 discriminant variables has been selected; an additional post-fitting set of cuts further improves the signal-to-noise ratio, also comprising the previously developed more stringent F4 on-ground background event filter, optimised for a good pattern recognition of a subclass of γ-ray events.
Instrument response functions. The effective area (Aeff), the PSF, and the energy dispersion probability (EDP), collectively referred to as the IRFs, depend on the direction of the incoming γ-ray in instrument coordinates. New efforts in the development of the background rejection filter FM3.119 led to reprocessing all AGILE–GRID data with the new IRFs H0025. The Aeff above 100 MeV is improved with a precise characterisation of the PSF with flight data (Chen et al. 2013; Sabatini et al. 2015). The IRFs I0023 analysed in Chen et al. (2013) are the same as H0025, except for a different boundary of two energy channels: we have 100–400 MeV, 400–1000 MeV in I0023, and 100–300 MeV, 300–1000 MeV in H0025. Both AGILE–GRID PSF and Aeff are characterised by a very good off-axis performance and are well calibrated up to almost 60°, showing a very smooth variations with the angle relative to the instrument axis (Chen et al. 2013). On-ground calibrations were also used to characterise the performances of the FM3.119 filter and to validate the new IRFs (Cattaneo et al. 2018). In addition, systematic errors of the IRFs are better characterised (see Sect. 5.1). The scientific performances of the AGILE–GRID can be summarised as follows: Aeff ∼ 400 cm2 at 100 MeV, field of view (FoV) ∼ 2.5 sr, energy range 30 MeV–50 GeV, and a PSF at 30° off-axis for E > 100 MeV of 2.1°, for E > 400 MeV of 1.1°, and for E > 1 GeV of 0.8°.
2.3. Data reduction
All AGILE–GRID data are routinely processed using the scientific data reduction software tasks developed by the AGILE team and integrated into an automatic pipeline system developed at the ASI Space Science Data Center (ASI/SSDC). The first step of the data reduction pipeline converts on a contact-by-contact basis the satellite data time into Terrestrial Time (TT), and performs some preliminary calculations and unit conversions. A second step consists in the γ-ray event reconstruction with the AGILE–GRID implementation of the Kalman filter technique. The background event filter FM3.119 is then applied and a classification flag is assigned to each event. An AGILE auxiliary file (LOG) is then created, containing all the spacecraft information relevant to the computation of the effective exposure and GTI (good time interval). Finally, the event direction in sky coordinates is reconstructed and reported in the AGILE event files (EVT), excluding events flagged as charged background particles. This step produces the Level-2 (LV2) archive of LOG and EVT files, that have been used for the construction of this catalogue. The AGILE–GRID data obtained both in pointing and in spinning mode are publicly available from the ASI/SSDC2.
2.4. Observations
The 2AGL catalogue sensitivity is not uniform, reflecting the inhomogeneous AGILE–GRID sky coverage during the “pointing period”, with a mean exposure focussed mainly towards the Galactic plane: this means that the catalogue covers the entire sky with this observational bias. In addition, the sensitivity is not intrinsically uniform over the sky owing to the large range of brightness of the foreground diffuse Galactic γ-ray emission. The total γ-ray exposure and intensity maps obtained over the selected period with the FM3.119 filter, in Hammer–Aitoff projection and Galactic coordinates, are shown in Figs. 1 and 2, respectively. Exposure values span from 1 to 20 235 cm2 s sr; 10% of the pixels have a value of less than 1200 cm2 s sr, which corresponds to about 16 days of effective exposure. This is the minimum exposure value corresponding to a 2AGL source detection.
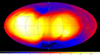 |
Fig. 1. Squared root scaled exposure sky map in the energy range 100 MeV–10 GeV in Galactic coordinates and Hammer–Aitoff projection for the 2.3 year period analysed for the 2AGL catalogue (expressed in units of cm2 s sr). Bin size = 0.1°. |
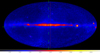 |
Fig. 2. Intensity map in the 100 MeV–10 GeV energy band in Galactic coordinates and Hammer–Aitoff projection for the 2.3 year period analysed for the 2AGL catalogue (expressed in units of ph cm−2 s−1 sr−1). Bin size = 0.1°. |
The AGILE Commissioning ended on July 9, 2007, and the following science verification phase lasted about four months, up to November 30, 2007. On December 1, 2007 the baseline nominal observations and pointing plan of AO Cycle-1 (AO-1) started with the Guest Observer programme, in which the AGILE spacecraft operated in pointing mode until October 15, 2009, and completing 101 pointings called observation blocks (OBs); see Table 1.
AGILE observation OBs in pointing mode.
The AGILE pointings are subject to illumination constraints requiring that the fixed solar panels always be orientated within 3° from the Sun direction. The OBs usually consisted of predefined long exposures, drifting about 1° per day with respect to the initial boresight direction to obey solar panels constraints. The strategy that drove the pointing history during the first two years of observations (Cycle-1 and Cycle-2) reflected the need to achieve a good balance between Galactic and extragalactic targets as well as optimal observability from both space- and ground-based facilities.
The AGILE Pointing Plan has been prepared, taking several scientific and operational requirements into account, such as
– maximisation of the overall sky exposure factor by limiting the observation of the sky regions more affected by Earth occultation;
– substantial exposure of the Galactic plane and in particular of the Galactic center and of the Cygnus regions during Cycle-1 to achieve long timescale monitoring of Galactic γ-ray and hard X-ray sources;
– maximisation of the scientific output of the mission during Cycle-2 in co-presence with the Fermi satellite, looking for confirmation of transient activity from several candidates detected during Cycle-1.
The AGILE Pointing Plan was aimed in particular at reaching specific scientific goals, including
– large photon counting statistic for γ-ray pulsar candidates;
– improved positioning of the majority of unidentified γ-ray sources concentrated in the galactic plane;
– micro-quasar studies with simultaneous hard X-ray and γ-ray data;
– determination of the origin of γ-ray emission associated with a selected list of supernova remnants (SNR);
– an improvement of the γ-ray Galactic diffuse emission model and of the Galactic cosmic-ray (CR) propagation and interaction in specific regions.
Because of the transient nature of the majority of extragalactic γ-ray sources and of many new γ-ray candidates in our Galaxy, and taking into account the large FoV of the AGILE–GRID, the general strategy to reconcile extragalactic and Galactic investigations within a single observing plan, was to carry out 4–6 Target of Opportunity (ToO) repointings per year due to source flaring activity. Nine repointings were actually carried out resulting from Galactic or extragalactic flaring activity, for a total of 12 ToO OBs out of 101 (3 of which have been extension of previous ones.) These 9 ToO repointings had a minimal impact (about 9%) on the long-duration baseline coverage of the Galactic plane. There is however an observational bias regarding a few well-known high-latitude blazars such as 3C279 and PKS 0537−441, which in the 2AGL have an high average flux value because they have been mainly observed in ToO pointings during flares.
A γ-ray flare monitoring programme has been active on a daily basis since the beginning of the mission, and has a dedicated alert system that is implemented within the AGILE Ground Segment and a Flare Advocate working group. Details are reported in Bulgarelli et al. (2014), Pittori (2013).
Since November 2009, because of a failure of the spacecraft reaction wheel, the attitude control system was reconfigured and the scientific mode of operation was changed. Currently the instrument operates in spinning mode, i.e. the instrument scans the sky with an angular velocity of about 0.8° s−1, resulting in an exposure of about 7 × 106 cm2 s for about 70% of the sky in one day.
3. Background modelling
3.1. Galactic diffuse γ-ray background
The diffuse γ-ray background is the primary component of the background. It is assumed to be produced by the interaction of CRs with the Galactic interstellar medium, the cosmic microwave background (CMB), and the interstellar radiation field (ISRF) through three physical processes: hadron-hadron collision, Bremsstrahlung, and inverse Compton emission. The model for the diffuse γ-ray background has been updated for the 2AGL catalogue, with an update of the Galactic centre region diffuse γ-ray emission and convolved with the new IRFs H0025.
The AGILE diffuse emission model Giuliani et al. (2004) substantially improves the previous EGRET model by using neutral hydrogen (HI) and CO updated maps to model the matter distribution in the Galaxy. It is based on a 3D grid with 0.1° ×0.1° binning in Galactic longitude and latitude, and a 0.2 kpc step in distance along the line of sight. Concerning the distribution of neutral hydrogen, we use the Leiden-Argentine-Bonn (LAB) survey of Galactic HI Kalberla et al. (2005). The LAB survey improves the previous results especially in terms of sensitivity (by an order of magnitude), velocity range, and resolution. In order to properly project the velocity-resolved radio data, we use the Galactic rotation curves parameterised by Clemens (1985). The detailed and relatively high-resolution distribution of molecular hydrogen is obtained from the CO observations described in Dame et al. (2001). The CO is assumed to be a tracer of molecular hydrogen, through a known ratio of hydrogen density to CO radio emissivity.
Cosmic rays can emit γ-rays through the inverse Compton mechanism due to their interaction with photons of the CMB and the ISRF. We use the analytical model proposed by Chi & Wolfendale (1991) to account for the latter component. It describes the ISRF as the result of three main contributions: far infrared (due to dust emission), near infrared, and optical/UV (from stellar emission). The CR distribution (both protons and electrons) in the Galaxy is obtained using the GALPROP CR model (Strong et al. 2000). As an example, Fig. 3 reports the AGILE diffuse γ-ray background emission model convolved with PSF and energy dispersion in the energy range 300 MeV–1 GeV.
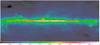 |
Fig. 3. AGILE diffuse γ-ray background emission model Giuliani et al. (2004) in the energy range 300 MeV–1 GeV, in ph cm−2 s−1 sr−1, in plate carree projection with a bin size of 0.1°. |
3.2. Isotropic background
The (quasi) isotropic background includes both a contribution from the cosmic extragalactic diffuse emission and a component of noise due to residual CR induced backgrounds at the detector level. This residual particle background is dominant in the AGILE data used for this analysis (based on the standard filter FM3.119)3. We evaluate the isotropic background with the maximum likelihood estimator (MLE) method in each region within the radius of analysis of each gamma-ray candidate source (see Sect. 4.1). This background is represented by a parameter for each energy bin in the MLE, which could be left free or fixed after its evaluation, taking typical values between 4−8 × 10⁻⁵ cts cm−2 s−1 sr−1 in the energy range 100 MeV–10 GeV.
3.3. Residual Earth limb
At the ∼550 km altitude of the (equatorial nearly-circular) orbit of AGILE, the limb of the Earth is an intense source of γ-rays from CR collisions with the upper atmosphere, and during the observations the AGILE–GRID FoV generally subtended part of the Earth limb. Even if an effective on-board background rejection filtering (Argan et al. 2004) is present, a residual component of limb emission remains in the data; to further reduce γ-ray Earth-albedo contamination we limit the data selection and exposure calculations excluding photons coming within 80° from the reconstructed satellite-Earth vector (albrad = 80), as in the 1AGL and 1AGLR catalogues. The AGILE TeVCat (Rappoldi et al. 2016) uses a more conservative angle cut with a value of albrad = 85°.
4. Construction of the catalogue
The 2AGL is a catalogue of point-like and extended sources. In this section we report the procedure to construct the 2AGL catalogue, emphasising the differences with respect to the 1AGL catalogue. Most of the procedure reported in this paper is relevant for point-like sources. The analysis of extended sources is described in Sect. 4.9.
The basic analysis steps are source detection and localisation, significance estimation, and spectral shape determination. Each step has been performed with the AGILE–GRID Science Tools (version BUILD25).
4.1. General analysis method
All analyses were performed using a binned MLE method. The analysis depends on the isotropic and Galactic diffuse emission, γ-ray photon statistics, IRFs as functions of energy and off-axis angle, and on the background filtering.
We used a likelihood ratio test to compare two ensembles of models. Each model is a linear combination of parameters for point-like and extended sources, isotropic, and Galactic diffuse γ-ray background components of the γ-ray emission, and in addition to point-like sources with fixed γ-ray emission; the two ensembles of models are a parameter subset of the other. For each ensemble of models the set of free parameters is estimated by fitting the model with the data and computing the maximum likelihoods, where L0 is the likelihood for the null hypothesis and L1 is the likelihood for the alternative hypothesis. The likelihood ratio test is L0/L1, and the test statistics TS is defined as TS = −2 ln(L0/L1) (Mattox et al. 1996; Bulgarelli et al. 2012a). The test statistics TS is used for quantifying how significantly a source emerges from the background (Wilks 1938).
To describe a single point-like source, between four and six parameters are used: two for the position, one for the predicted counts and the remaining for the shape parameters of the spectral model (see Sect. 4.1.2). The results are the predicted source counts, the values of the spectral shape parameters, and the position of the source in Galactic coordinates. The parameters reported in this paper are estimated by a likelihood analysis of the 10° field surrounding the sources and considering nearby sources.
Among the parameters evaluated by MLE, the background is described by the coefficients of the Galactic diffuse (see Sect. 3.1) and isotropic (see Sect. 3.2) background. We have two parameters for each energy bin to describe the Galactic (diffuse) and isotropic γ-ray emission: ggal, the coefficient of the Galactic diffuse emission model, and giso × 10−5 cts cm−2 s−1 sr−1, the isotropic diffuse intensity. A value of ggal < 1 is expected if the Galactic diffuse emission model is correct. An average value of ḡgal = (0.46 ± 0.09) is obtained in this analysis.
The parameters kept free are estimated by the MLE. It is possible to keep each parameter either free or fixed; a free parameter is allowed to vary to find the maximum likelihood. We varied the point-like source parameters with the following possible combinations: (1) variation of only the flux, (2) variation of position and flux, (3) variation of spectral shape and flux, or (4) variation of all parameters. For the 2AGL catalogue the position, flux, and spectral model parameters were estimated in the same procedure with a global fitting that takes care at the same time, for instance that a shifted position would affect the spectral models or the positions of nearby sources. For some cases described hereafter the number of free parameters is reduced (see Sects. 4.1.1 and 4.1.2).
To describe an extended source we produced a template of the shape of the extended emission at the expected position and we fit this shape with data with a fixed spectral index α (we use α = 2.1) of a power law (PL; the only available spectral shape for extended source provided by the AGILE Science Tools), allowing the predicted counts to vary.
The photons were binned into FITS count maps. The γ-ray exposure maps and Galactic diffuse emission maps were then used to calculate the parameters of the models. Particular care is required to carry out the analysis in regions of the Galactic plane that are characterised by a relatively high and structured flux of the diffuse Galactic emission, as well as in regions near bright γ-ray sources leading to possible source confusion.
4.1.1. Localisation
The position of each source was determined by maximising the likelihood with respect to its position, keeping the other parameters of the point-like source free. For each source we evaluated the 95% elliptical and circular confidence regions.
The AGILE Science Tools perform the positional and spectral shape optimisation at the same time, but sometimes the contour is not evaluated during the spectral shape evaluation owing to the high number of free parameters; as consequence, it is not possible to obtain confidence regions optimised with the spectral shape, even if the best position of the source is correctly evaluated by MLE. To overcome this problem we evaluated the best position and elliptical confidence region reducing the number of free parameters: all these sources are denoted with flag 5 (see Table 2).
Definitions of the analysis flags
4.1.2. Spectral models
We performed a full energy band spectral fit of the data to incorporate the constraint that the spectral shape should smoothly vary with energy. The 1AGL and 1AGLR catalogues considered only PL spectra; this was a simpler approach but not a good spectral representation for bright sources. With the exposure increasing, the discrepancies between PL and curved spectra could affect the global fit of the source, altering the spectra of nearby sources. Increasing the number of free parameters means that finding the true best fit is more difficult and, therefore, only spectra with one or two additional parameters were considered. The spectral representations used in the 2AGL catalogue are PL, exponential cut-off PL, super-exponential cut-off PL, and log parabola (LP).
The PL spectral model is used for all sources that are not significantly curved and have low exposure, i.e.
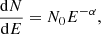 (1)
(1)
where N0 is the prefactor and α is the index explicitly evaluated by the MLE method. Our MLE spectral fitting does not explicitly output the prefactor value, which is internally calculated by the numerical procedure.
The majority of the 2AGL sources are described by a PL. With the exception of the brightest sources, the AGILE–GRID analysis may not be spectrally resolved because of low statistics. In this case the PL spectral model is assumed and in general, a fixed spectral index α = 2.1 is adopted for the initial step of the MLE analysis. The exponential cut-off PL spectral model (PC) is
 (2)
(2)
where N0 is the prefactor, α is the index, and Ec is the cut-off energy. The values Ec and α are explicitly provided by the MLE method. The super exponential cut-off PL spectral model (PS) is
 (3)
(3)
where N0 is the prefactor, α is the first index, β the second index, and Ec is the cut-off energy. The parameters α, Ec, and β are explicitly provided by the MLE method.
The LP spectral model is
 (4)
(4)
where N0 is the prefactor, Ec is the pivot energy, α is the first index, β the curvature. The parameters α, Ec, and β are explicitly provided by the MLE method.
In order to select the best spectral shape for every source, we performed a full spectral fit of the data with the spectral representations listed in this section. The MLE estimator does not converge with all spectral shapes: this can be due to poor statistics or to the presence of too many parameters in the spectral model. Another common problem is that, even if there is a fit convergence, the estimated parameters are too close to their limits or their errors are greater than the values of the parameters themselves: in these cases the fit is discarded. Our selection of curved spectra followed the acceptance criteria described in Nolan et al. (2012). Briefly, a source is considered significantly curved if TScurved > 16, where TScurved = 2 × (log L(curved spectrum) − log L(power law), where L is the likelihood function obtained changing only the spectral representation of that source and refitting all free parameters.
4.1.3. Upper limit calculation
Upper limits were calculated using the same technique used for the asymmetrical errors for detected sources. We find the point-like source flux which maximises the likelihood.
The calculated upper limit is a conservative value guaranteed to be at or above the upper limit of the confidence interval. We calculated this upper limit using the following simple formula: UL = ΔF+ + |F|, where ΔF+ is the positive error in the flux and |F| is the absolute value of the flux. In the 2AGL catalogue we report the 2σ upper limits.
For very faint sources (in a single energy band or for the full energy band during the variability analysis) when TS < 1 we used a Bayesian method (Helene 1983). The upper limit is found by integrating the likelihood from 0 up to the flux that encompasses 95% of the posterior probability: in this way the upper limits calculated with both methods are similar for sources with TS = 1.
4.2. Binned sky maps preparation
In order to merge the data from different observing periods over the whole sky, we produced sets of sky maps in the ARC projection (Calabretta & Greisen 2002) in Galactic coordinates. Catalogued sources are detected by merging all the available data over the entire time period.
Different sets of counts and exposure maps were produced with the AGILE–GRID standard software package. We report a choice of parameters for maps generation of all sets, reporting in parenthesis the parameters values to be used in the software package distributed to AGILE guest observers.
To reduce the particle background contamination, only events tagged as confirmed γ-ray events were selected (filtercode = 5). The South Atlantic Anomaly data were excluded (phasecode = 6) and all γ-ray events whose reconstructed directions with respect to the satellite-Earth vector is smaller than 80° (albrad = 80) were also rejected to eliminate the Earth albedo contamination.
The considered energy range for the 2AGL source analysis is 100 MeV–10 GeV. To reduce the uncertainty in the reconstruction of events, we selected only photons with a reconstructed direction within 50° from the boresight (fovradmax = 50).
4.3. Determination of seeds
The detection and localisation procedure is basically iterative, starting from a list of seeds. The seeds are the initial sky positions of the candidate point-like sources. The process starts without any set of input sources to avoid any kind of biases from different data sets.
We created a tiling of the sky called pixelisation. For each region of the sky, the initial set of candidate sources was determined using blind search techniques as a wavelet-based method (“wavelet algorithm”) and generating significance maps (TS maps) iteratively. Each region was optimised independently. At the end of this step we obtained an independent list of seeds for each region of the sky.
Pixelisation. To create a tile of the sky with a sufficient resolution, we used 3072 circular regions (hereafter called rings) centred on points defined by HEALPix (Hierarchical Equal Area isoLatitude Pixelisation) (Górski et al. 2005) tessellation with Nside = 16. We produced binned maps of 0.5° (used only for test) and 0.1° bin size with a side of 30° for each tile in Galactic coordinates, whose centres lay at constant latitude, with a unique energy bin of 100 MeV–10 GeV. The tiles are discrete, overlapping, and not independent. The HEALPix algorithm produces a subdivision of a spherical surface in which each pixel covers the same surface area as every other pixel. We note, however, that we did not use the HEALPix projection but only a property of its grid; the pixel centres occur on a discrete number of rings of constant latitude to represent all-sky binned γ-ray data.
Wavelet algorithm. A continuous wavelet transform (CWT) was used to determine the first list of seeds. The CWT analyses a signal at different scales and is computed convolving the signal under investigation with the dilated and translated version of a wavelet function. When the support of the wavelet is small the CWT reacts mainly to high frequencies while, as the dilation increases, the wavelet support increases and the CWT is able to detect the lower frequency components of the signal (Louis et al. 1997). In this work we used the negative of the Laplacian of the Gaussian, called Marr or Mexican Hat wavelet, i.e.
 (5)
(5)
This wavelet has a positive kernel surrounded by a negative annulus. Its positive kernel has a Gaussian-like shape very similar to the AGILE–GRID PSF, hence it is effective in detecting point-like sources. It has a limited extent both in spatial and Fourier domains, which guarantees good localisation performance and limited aliasing effects (Freeman et al. 2002).
We used binned maps of 0.1° ×0.1°. The CWT of these maps consists of a 3D grid of pixels with the third dimension corresponding to the scales at which the transform is computed. We used a dyadic scale starting from one pixel up to the map size. The CWT at scales between 1 to 5 pixels provides evidence of point-like sources, some extended sources or clusters of sources are evident at scales between 5 and 10 pixels, while at higher scales the background is clearly identified.
The detection of sources is related to the probability of correctly classifying each pixel of the CWT as belonging to a source or to the cosmic background. The source detection threshold of each pixel is derived simulating several background sky maps and computing the CWT. In general, if a group of pixel is selected at any given scale then a similar group exists both at a finer and at a coarser scale. Each connected region of CWT pixels in a given range of scales can be considered as a putative source characterised by its centroid (spatial position) and scale extension. An example of 4 scales applied to the Cygnus region is shown in Fig. 4.
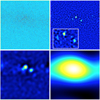 |
Fig. 4. Scales 10, 20, 25, and 35 of the wavelet algorithm applied on the Cygnus region from top to bottom and left to right. The maps of scale 20 (top, right) contains a zoom of the Cygnus region. |
Iterative procedure on significance TS maps. The second list of seeds was determined to compute the significance TS map for each ring with an iterative procedure.
The first step starts without sources and, for each bin of the map, we performed a MLE, adding a point-like source in the ensemble of models at the centre of the bin under evaluation; the flux parameter was kept free, assuming a PL spectral index α = 2.1. We used binned maps of 0.1° ×0.1° and a radius of search of 5°. For each iteraction we may obtain a set of neighbouring bins with high significance. We selected a new candidate seed selecting the bin with the maximum TS value and only if TS > 9: the position of the seed is in the centre of the bin. This seed is added to the ensemble of models for the next iteration with the list of seeds identified in the previous steps. The seeds are kept with flux and position parameters fixed. The iterative procedure stops if no detection is found with TS > 9 or if the maximum allowed number of iterations is reached. At the end all seeds are merged, combining in one single seed the overlapping ones. Seeds close to the boundary of the circle of search in are removed, but the seeds can still survive because they are found in the neighbouring and overlapping rings with a position closest to the centre of the ring. An example of this iterative procedure on Cygnus region is shown in Fig. 5.
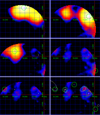 |
Fig. 5. First six steps of the iterative procedure on the significance TS maps described in Sect. 4.3 applied to the Cygnus region (panels from top to bottom and left to right). Green circles are centred on the pixels with the maximum TS found in each step. The last map (bottom right) contains all the green circles of the first six steps and the final 95% confidence region of the 2AGL sources. Even if border seeds are removed (see seeds found in panels 4 and 5), they are still present in the final version of the catalogue because they may be located in the overlapping nearby rings with a position closer to the centre, and sometimes the final position couldslightly change (see seed found in panel 4). |
Final list of seeds. We added the list of seeds obtained from the iterative procedure on the significance TS to the list of seeds obtained with the wavelet technique. We checked the detections present only in the wavelet list with a manual analysis and added these to the final list if the detection has  . The final list of seeds results in 912 candidate point-like sources.
4.4. Iterative analysis of seeds
The main purpose of this step is to reduce the number of seeds obtaining, at the end, a list of candidate sources for a refined analysis.
Pixelisation. We created a tiling of the sky for this step of analysis using 192 rings centred on points defined by HEALPix tessellation with Nside = 4. We produced binned maps of 0.1° bin size with a side of 50° for each tile orientated with the north Galactic pole facing upward, whose centres are at a constant latitude with a single energy bin 100 MeV–10 GeV. We used a lower number of rings for this step to reduce the border effects of the rings.
Iterative automated analysis of seeds. This stage starts from the list of seeds, ordered according to the estimated flux. For each iteration, an automated procedure selects one seed and the best ring for analysis, adding to the ensemble of models the seeds obtained with the previous iterations of this procedure and within 25° from the centre of the selected ring. The seeds within 5° from the selected seed under analysis are kept with flux free, and the seed under analysis is kept with position and flux free. The MLE method interactively optimises the position and flux of all the seeds of the region at the same time, with a radius of analysis of 10°. The localisation procedure of point-like sources provides the position, the 95% elliptical confidence region, and the best evaluation of the significance, using for all sources a PL spectral shape with α = 2.1.
At the end of each iteration the flux and position of a single seed were optimised and the list of seeds was updated with the new flux and position if the detection has TS > 9, otherwise the seed was removed from the list. Since neighbouring regions are coupled, sharing data and sources, we repeated this step until the likelihoods were jointly optimised. With this procedure detections above TS > 9 significance are considered during the analysis.
4.5. Manual analysis
For the most complex and crowded regions of the sky, we performed additional manual analysis to add new candidate sources or to verify the results obtained with the previous step. We then updated the list of candidate 2AGL sources with new 16 candidate point-like sources obtained with this step. The final list of candidate 2AGL sources results in 318 candidate point-like sources with TS > 9.
4.6. Refined analysis
The main purpose of this step is to confirm candidate sources identified in the last step, obtaining the final list of 2AGL sources. The 2AGL catalogue includes sources above TS > 16 significance (corresponding to 4σ with one free parameter).
Pixelisation. We tiled the sky using a refined HEALPix tessellation used for the seeds with Nside = 16, corresponding to 3072 pixel with a mean spacing of 3.6645°. We produced binned maps of 0.1° ×0.1° bin size with a radius of 15° and with the following energy bins: 100–300, 300–1000, 1000–3000, 3000–10 000 MeV. Additional bins of 30–50 and 50–100 MeV were produced by the same procedure.
Best position, spectral determination, and significance thresholding. We analysed the list of candidate sources obtained with the previous steps as follows:
1. This stage starts from the list of candidate sources, ordered according to the estimated flux.
2. Extraction of the first candidate source, keeping free all its parameters (flux, position, spectral shape parameters), keeping free the flux and fixed the position of the sources that are within 3° from the source under analysis, and fixing flux and position of the remaining sources within the sky map. The spectral shape is evaluated trying all available spectral models and selecting the best fit based on the TScurved. In some cases the PL index could result close to the boundaries: in this case, we fixed the index α = 2.1. An analysis flag (see Sect. 5.4) is specified for this problem.
3. Update of the list of candidate sources with new position, flux, and spectral model. A final run with all parameters fixed except the flux was performed and a significance threshold TS ≥ 16 was then applied for the final selection of candidate sources. We then restarted these steps with the next source on the list.
The source photon fluxes are reported in four energy bands: 100–300 MeV, 300–1000 MeV, 1–3 GeV, and 3–10 GeV. We performed a global fit over the full range, as described in Sect. 4.1.2. The fluxes in each band were obtained by freezing the spectral shape parameters to those obtained in the fit over the full range and adjusting the normalisation in each spectral band. If in any band  , the upper limit was selected. Figure 6 reports a comparison between the energy flux estimated in the energy range 100 MeV–10 GeV from the sum of bands and that estimated from the fit to the full range for all 2AGL sources. No obvious bias can be observed.
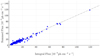 |
Fig. 6. Comparison of the energy flux in the energy range 100 MeV–10 GeV estimated from the sum of bands (ordinate) and the fit to the full band (abscissa) for all 2AGL sources, in 10−8 ph cm−2 s−1. No obvious bias can be observed. |
4.7. Residual TS significance maps
The TS significance maps are used to compute the residual significance maps at the end of the analysis procedure to search for missing point-like sources. Each residual TS found in this way was evaluated with an additional step of the refined analysis. Five new sources were found and added, and neighbouring sources within a radius of 5° re-evaluated.
4.8. Variability
We performed a temporal variability analysis on the 2AGL catalogue sources. Temporal variability is common to different classes of γ-ray sources and it is important to determine a variability index. For each source we split the AGILE–GRID data in four-day time intervals: this is a compromise between the duration of an observation (see Table 1) and a useful exposure time. For each time interval we produced sky maps of 0.5° bin size and of 50° diameter, centred in the position of the source under analysis.
We produced a light curve for each source in the catalogue. Because of the already mentioned observation constraints of the pointing mode, the number of bins for each light curve could be different. To define a variability index, first we analysed each time bin keeping free only the flux of the source under analysis, adding the neighbouring 2AGL sources within the sky map. To avoid large error bars, the position and spectral parameters of the source were frozen, assuming spectral variability to be negligible; in addition we evaluated the diffuse γ-ray background emission and the isotropic background over the entire OB.
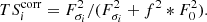
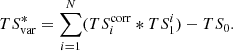
Let  be the value of the TS obtained optimising the flux in each period of time i and TS0 the value of TS estimated evaluating all the time bins at the same time but considering a constant flux, TSvar is described by the following relation:
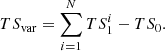 (6)
(6)
If the null hypothesis is correct (the source has a constant flux) TSvar is distributed as χ2 with N − 1 degrees of freedom, and a value of TSvar > h(N − 1) is used to identify variable sources at 99% confidence level, where h(N) gives the threshold corresponding to a 99% confidence level in a χ2 distribution with N degrees of freedom.
It is possible to introduce a corrective factor (similar to Nolan et al. 2012) to take into account the systematic error,
 (7)
(7)
The value Fσi is the error on the flux in each period of time i and F0 is the flux estimated evaluating all the time bins at the same time but considering a constant flux. We consider f = 0.02 in our analysis (2% of systematic error). This value was found sufficient such that no AGILE–GRID pulsars are above threshold excluding the Crab, which has a highly variable nebular component at AGILE–GRID energies (Tavani et al. 2011; Abdo et al. 2011). The corrected TSvar is
 (8)
(8)
The variability index VI assumes the value 1 if 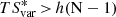 . Upper limits calculated through the MLE method are handled by the procedure described above. In this procedure, all the upper limits are those obtained with the MLE method; no Bayesian procedure was used.
To be conservative, we evaluated the VI if N > 12. Some variable light curves (based on VI) are reported in Figs. 11–13.
4.9. Extended sources
The procedure described in the previous sections is related to point-like sources. We modelled a list of sources as spatially extended sources, using a 2D Gaussian model. Nearby point-like sources were fixed in position and spectral shape, keeping only the flux free for sources within 3° from the extended source under analysis and removing only sources inside the extended template that have no association with known point-like sources.
The list of analysed sources is reported in Table 3. The first column reports the region name, the second and third report the Galactic coordinates of the centre of the region, le and be, the fourth and the fifth report the two radii, r1 and r2, used for the analysis, which indicate the dispersion for 2D Gaussian sources. The value r1 is chosen considering the observed extension at GeV and TeV energies (or considering a mean value if the shape of the extended region is not circular), r2 is usually the double of r1 with some exceptions (i.e. difference in radius between GeV and TeV energies or very eccentric shape). In particular, 3FGL (Acero et al. 2015) and TeVCat catalogues have been used for the selection of the two values. The online TeVCat catalog4 is continuously updated with new sources detected by TeV experiments. At the time of writing (January 2019), the TeVCat catalogue contains a total of 219 TeV sources.
Extended sources analysed for 2AGL catalogue.
4.10. Exposure uniformity within the region of the MLE analysis
Owing to the non-homogeneous sky coverage of the AGILE observations during the first 2.3 years, it is possible that some candidate sources lie near the borders of certain pointings. In order to have an unbiased estimate of the coefficients of the Galactic diffuse emission and isotropic background that could lead to to an incorrect evaluation of the flux and position of the source, exposure uniformity within the region of the analysis is required.
We applied a specific check to verify the uniformity of the exposure within the 10° radius of the AGILE MLE analysis centred at each source candidate position, over the considered timescale. The fraction of pixels of the exposure map within the region of analysis having a value below a pre-defined threshold was calculated, and if it was more than 10% the region was considered unreliable and the candidate was discarded. The exposure threshold value is evaluated by calculating the mean exposure of the observation over the full FoV area and comparing this exposure with the values of some reference good exposures.
5. Limitations and systematic uncertainties
5.1. Instrument response functions systematic uncertainties
5.1.1. Systematic uncertainties on flux
In order to estimate systematic effects due to changes in instrument characteristics, inaccuracies in the IRFs, and uncertainties in the galactic diffuse model, we compared the behaviour of the residual for 100 MeV–10 GeV near the peak of the Vela pulsar as a function of OBs (see Table 1). For each OB we constructed a model consisting of three components: the PSF at the position of Vela with the flux and super exponential cut-off PL spectral model listed in the 2AGL catalogue, an isotropic component of 5.9 × 10⁻⁵ ph cm−2 s−1, and a galactic diffuse component with coefficient 0.5, evaluated during the 2AGL catalogue analysis. We then calculated the residual = (model − counts)/exposure and the residual error  . We then binned the residual in annuli of 0.5° and observed the behaviour of the residual in the innermost ring as a function of OB. For most of the OBs the residual is consistent with a value slightly less than 1 × 10⁻⁸ ph cm−2 s−1 but there is one OB, the OB 4100, where the residual is in the opposite direction and slightly higher. In any case the errors are very small compared to the statistical errors in the flux even for Vela, the brightest point source in the catalogue.
5.1.2. Systematic uncertainties on spectral index
In addition to the effect on the source flux the systematic uncertainties on the IRFs affect also the source spectral index. There are two relevant sources of systematic uncertainties: the shape of Aeff(Eγ) and the EDP. The former is shown in Fig. 1 of Chen et al. (2013) and is obtained by simulation. Estimating the systematic errors from the simulation alone is unreliable, while in Cattaneo et al. (2018) the unreliability of the experimental estimation by the calibration under beam is discussed. An alternative approach is generating Monte Carlo spectra with a given shape of Aeff(Eγ) and index equal to −2.10, and fit the spectra with another shape. The most conservative choice is to use the Aeff(Eγ) from Chen et al. (2013) and fit assuming a flat Aeff(Eγ) and vice versa; that is much larger than any possible error and we can estimate covering a variation of the index of no less than  . Out of 100 Monte Carlo experiments, the average index from the fit is −2.01 in the first case and −2.25 in the second. Therefore the systematic error can be estimated as
 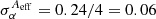 .
.
The latter systematic uncertainty from EDP can be estimated analogously generating Monte Carlo spectra with EDP and fitting the index without and vice versa. That is a very conservative estimation because the calibration under beam Cattaneo et al. (2018) provides a measure of the EDP consistent with expectations and therefore any possible systematic error can be only a fraction of the EDP itself. Following the previous approach the systematic error due to EDP can be estimated as  .
.
Finally, the Monte Carlo spectra can be generated with Aeff(Eγ) and EDP and fitted without either and vice versa. The overall systematic errors is σα = 0.10 consistent with the quadratic sum of the separate contributions.
5.2. Limitations on extended source analysis
There are some limitations in the analysis of extended regions that reduce the number of extended sources of the 2AGL catalogue. (i) Only a 2D Gaussian model is used as spatially extended sources model: this is not true for all extended shapes. (ii) Owing to limitations of the analysis tools, the analysis is performed with only a unique sky map integrated in the energy range 100 MeV–10 GeV: this strongly limits the identification of extended sources for which the emission peaks at higher energies. (iii) Only the PL spectral model with a fixed spectral index α = 2.1 is used.
5.3. Limitations of the variability index
The variability index VI is described in Sect. 4.8. The main limitation of this index is in the reduced number of temporal bins for each light curve, with a number of upper limits that is not negligible in many cases (even if the procedure handles this). The last limitation is that the variability index is not provided for light curves with less than 12 temporal bins. For these reasons, this index is not included in the identification criteria of counterparts.
5.4. Analysis flags
Some peculiar conditions that require caution to assess the confidence of a source are described in Table 2. Flag=1 indicates when, keeping the spectral index of the PL free, the value moves close to the boundaries of the search space of the spectral parameters. In this case a PL with fixed α = 2.1 is assumed. This happens during step 2 of the refined analysis (Sect. 4.6). Only 4 sources have this flag.
Flags from 2 to 4 indicate that there are 2, 3, or 4 upper limits over four energy bins (100–300, 300–1000, 1000–3000, 3000–10 000 MeV). The upper limits are usually in the highest energy bands. Sixty-one sources have flag=2, 51 sources have flag=3, and only 5 sources have flag=4.
Flag=5 indicates that AGILE Science Tools are not able to optimise the position and spectral shape parameters of the source at the same time during step 2 of the refined analysis; 33 sources have this flag.
6. Second AGILE–GRID γ-ray sources list
The second AGILE catalogue of γ-ray sources (2AGL) includes 175 high-confidence sources detected using the AGILE–GRID data during the pointing mode period; the methods and criteria are described in Sect. 4. An interactive web page of the 2AGL catalogue and its FITS file version are publicly available at SSDC5.
In this section we present a description of the 2AGL catalogue, the criteria used for association and identification of sources with known counterparts, the content of the main tables, and a comparison with previous AGILE catalgues. Section 7 reports notes on individual 2AGL sources, where details used for associations and identifications are also described.
6.1. Catalogue description
The validated sources in the catalogue are listed in Table 10, including both confirmed and possible associations, and plotted in Fig. 7 in Galactic sky coordinates. Table 4 reports the description of the columns of Table 10.
 |
Fig. 7. Sky map of 4σ sensitivity in the energy range 100 MeV–10 GeV in Galactic coordinates and Hammer–Aitoff projection; the hypothesis of a PL spectral model with α = 2.1, in ph cm−2 s−1. The 95% elliptical confidence regions of the 2AGL sources are superimposed in black. |
The source designation is 2AGL JHHMM+DDMM[c/e] where the 2 indicates that this is the second AGILE–GRID catalogue, AGL represents the AGILE–GRID. The name of the sources potentially confused with the Galactic diffuse emission or with a large uncertainty on its location is appended with c, and caution should be used in interpreting these sources; an appended e indicates sources associated with a spatially extended emission.
It is important to note that each source is observed for a different number of days, much smaller than the 2.3 years of the pointing mode. The column “Exp” of Table 10 reports a rough estimate of days of observations, obtained dividing exposure by a mean Aeff = 300 cm2 and 86 400 s. Association and identification of 2AGL sources are described in Sect. 6.2.
Figure 8 reports some distributions of 2AGL source parameters (spectral indexes, fluxes, 95% elliptical confidence regions, parameters distributions, and distances from known counterparts). The most important classes of the 2AGL catalogue are AGNs and pulsars. The median value of the spectral index for AGN classes is α = 2.10 ± 0.30, and for pulsar class is α = 1.98 ± 0.30; the two distributions are compatible. The distributions of distances of 2AGL from 3FGL counterparts for the two different classes are shown in the bottom figures together with fits to the Rayleigh function. This fit assumes implicitly that the errors on the source positions are constant. In reality we expect that the position error on each source depends on the statistical and systematic errors of AGILE–GRID and Fermi-LAT, which vary from source to source, and therefore that a single Rayleigh function is not fully adequate. Nevertheless the values of χ2/ndf close to one demonstrate that, under the simplified assumption of constant errors, the two distributions are consistent.
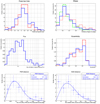 |
Fig. 8. Some distributions of 2AGL source parameters. Top left figure: spectral index distributions for sources with PL spectral model, all sources (blue), and only for sources with high latitude (|b| > 10) (red). Top right figure: 95% confidence region error radius (blue), the semi-major axes of 95% elliptical confidence region (red), and the semi-minor axes (green). Middle left figure: integral flux in the energy range 100 MeV–10 GeV, for sources with PL spectral model. Middle right figure: eccentricity of the 95% elliptical confidence region for all sources (blue) and for high latitude sources (|b|> 10) (red). Bottom left figure: distance between the 2AGL sources classified as pulsars and their 3FGL counterparts for sources with |


6.2. Source association and identification
In the 2AGL catalogue we define three different classes of identified, associated, and unidentified sources. Table 5 reports a summary of the 2AGL classes. Designations shown in capital letters are firm identifications; lower case letters indicate associations. Figure 9 reports a full sky map showing sources labelled by source class. A blow-up of the inner Galactic region is reported in the bottom of Fig. 9.
2AGL source classes.
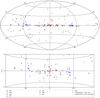 |
Fig. 9. Positions, in Galactic coordinates, of the 2AGL sources labelled by different symbols according to their class for the full sky (top) and a blow-up of the inner Galactic region (bottom). All AGN classes are plotted with the same symbol. |
Associations are defined using a spatial cross-correlations procedure based on spatial coincidence of the 95% confidence region with various updated public catalogues of specific mission or of specific source classes known to be potential γ-ray emitters. The list of catalogues used for association is reported in Table 6. Two sources are considered associated if there is a partial or total overlapping between the 95% elliptical confidence regions, taking into account the statistical error plus a systematic error of 0.1° (Chen et al. 2013).
Association with γ-ray catalogues.
We used different criteria to establish a firm identification of a 2AGL source with a known counterpart.
AGN of the blazar type dominate the extragalactic γ-ray sky and are known to be highly variable in γ-rays, not always showing simultaneous correlated variability at other wavelengths. So positional consistency plus γ-ray variability were used for the identification of 2AGL sources with AGN counterparts. Identification with AGNs is established if at least one flaring episode with a significance >4σ and with a peak flux at least three times the average flux is found on a four-day timescale in the energy range 100 MeV–10 GeV, or at OB level (the full list of OBs is reported in Table 1). Target of opportunity observations on the source could strongly influence the average flux; in that case, only detections with a significance >4σ are considered. The light curves are determined with the flux and position parameters allowed to vary, where the position of the 2AGL source is used as the starting position. Section 7.1 reports a discussion about the association or identification of some AGNs.
We introduce the special subclass of “AGILE–only” sources, i.e. unidentified source that are only present in this γ-ray catalogue but not positionally consistent with sources in 1FGL, 2FGL, or 3FGL catalogsue; details are reported in Sect. 7.2.
The “γ-ray unidentified” sources are a subclass of sources detected in γ-ray by the AGILE–GRID and the Fermi-LAT but that are unidentified in other wavelengths; details are reported in Sect. 7.3.
Regarding candidate AGN sources, “AGILE–only” sources, and “γ-ray unidentified” sources, are also identified with the VOU-BLAZAR tool (hereafter VOUblaz) specifically designed to identify blazar sources based on a multi-frequency study in large error regions, and through time resolved spectral energy distribution (SED) creation and analysis. This tool is developed within the Italian Space Agency (ASI) web portal for the “Open Universe” initiative6 (Giommi et al. 2018; Padovani et al. 2018), an initiative under the auspices of the United Nations Committee On the Peaceful Uses of Outer Space (COPUOS). The multiwavelength information used by the VOUblaz tool, both in the phase of the identification of blazar candidates and for the construction of the SED of a given candidate, is generally non-simultaneous as it is obtained through VO queries to a large number (>50) of catalogues and archival spectral data. A blazar found within the error region is considered as a viable counterpart of an AGILE source when the ratio of the low- to high-energy humps (Compton dominance) is well within the range observed in previous γ-ray catalogues. Details of the analysis with this tool are reported in the discussion of each source.
Pulsars are firmly identified if pulsation is found in the AGILE–GRID data; details are reported in Sect. 7.4.
As a general rule for all classes, for “firmly identified" counterparts we have included γ-ray sources for which there are peer reviewed publications demonstrating high-confidence associations with refined analysis methods. In the SNR class we have IC 443, W28, W44, and Gamma Cygni (Sect. 7.8 for more details), Crab nebula as pulsars wind nebula (PWN; Sect. 7.7 for more details), and Cygnus X-3 as an HMXB (Sect. 7.9 for more details). Also some AGNs have been identified in this way.
6.3. Extended sources
We report in Table 7 some details for 2AGL sources that are also classified as extended γ-ray emission; they are denoted with an “e” appended to the 2AGL name. We note that there could be a difference in positioning of the same source if evaluated as extended (as reported in Table 7) or point-like (as reported in Table 10).
Extended sources
6.4. Spectral models
Each source is analysed fitting the data with the four spectral models described in Sect. 4.1.2. The final selection is based on the TScurved criteria described in the same section. The 2AGL sources with curved spectra are listed in Table 8. Table 9 reports a description of the columns of Table 11, which presents the fluxes in individual bands as defined in Sect. 4.6.
2AGL sources with curved spectra.
2AGL catalogue sources.
Spectral information of 2AGL catalogue sources.
6.5. Comparison with the AGILE Astronomer’s Telegrams
The list of Astronomer’s Telegrams in pointing mode, obtained during the γ-ray flare monitoring programme (see Sect. 2.4) and associated with 2AGL source are reported in Table 12.
AGILE astronomer’s telegrams (ATEL) in pointing mode and associated 2AGL catalogue sources.
6.6. Comparison with 1AGL and 1AGLR catalogues
Three of the 47 1AGL catalogue sources are not present in the 2AGL catalogue: 1AGL J1222+2851, 1AGL J1238+0406, and 1AGL J1815-1732. We note that 1AGL J1222+2851 is associated with WComae (ON+231) (with an associated Astronomer’s Telegram; see Table 12) but due to the longer integration time of the 2AGL catalogue this source goes below the significance threshold.
Four of the 54 1AGLR catalogue sources are not present in the 2AGL catalogue: 1AGL J1238+0406, 1AGLR J1807−2103, 1AGLR J2016+3644, and 1AGLR J2030−0617. These differences are mainly due to a different integration time or to splitting a 1AGL/1AGLR sources in different 2AGL sources.
6.7. Comparison with AGILE TeVCat
Thirteen of the 52 sources of the AGILE TeVCat (Rappoldi et al. 2016) are not present in the 2AGL catalogue. These sources are not confirmed due to a different analysis procedure, different Science Tools, different background cuts (albrad = 85, fovradmax = 60) and improved IRFs, or to splitting the source in different 2AGL sources. The AGILE TeVCat sources not present in the 2AGL catalogue are: (1) TeVJ0232+202, associated with 1ES 0229+200, below the 2AGL catalogue threshold, (2) TeVJ0521+211 (VER J0521+211), (3) TeVJ0835−455 (Vela X), (4) TeVJ0852−463 (RX J0852.0−4622), (5) TeVJ1729−345 (HESS J1729−345), (6) TeVJ1732−347 (HESS J1731−347), (7) TeVJ1745−303 (HESS J1745−303), (8) TeVJ1813−178 (HESS J1813−178), (9) TeVJ1825−137 (HESS J1825−137), (10) TeVJ1841−055 (HESS J1841−055), (11) TeVJ1912+101 (HESS J1912+101), (12) TeVJ2323+588 (Cassiopeia A), (13) TeVJ2359−306 (HESS J2359−306).
7. Notes on individual sources
In this section we comment on some specific 2AGL sources, divided by classes or sky regions, including AGILE–GRID identifications or associations for individual sources based on criteria described in Sect. 6.2.
Section 7.1 reports a description of associated or identified AGNs, Sect. 7.2 on AGILE–only sources, Sect. 7.3 on γ-ray only sources, Sect. 7.4 on pulsars, Sect. 7.5 reports a discussion on the Cygnus region, Sect. 7.6 on the Carina region, Sect. 7.7 on PWNs, Sect. 7.8 on SNRs, Sect. 7.9 on binaries, and Sect. 7.10 on confused sources.
7.1. Notes on AGN sources
In the following we report identifications or associations for AGNs. In particular, we report the flaring episodes detected with our variability analysis used to establish an identification between the 2AGL source and a known counterpart, and/or the reference to multiwavelength (MW) information obtained by the use of the VOUblaz tool demonstrating high-confidence identifications.
2AGL J0135+4754. Integrating in the time interval MJD 55037.5−55041.5, a MLE analysis yields a detection of 4.6σ and a flux F = (55 ± 17) × 10−8 ph cm−2 s−1, establishing a firm identification of 2AGL J0135+4754 source with OC 457.
2AGL J0252+5038. Integrating in the time interval MJD 54813.5−54817.5 a MLE analysis yields a detection of 4.0σ and a flux F = (70 ± 21) × 10−8 ph cm−2 s−1, positionally consistent with the flat spectrum radio quasar (FSRQ) NVSS J025357+510256, establishing a firm identification with 2AGL J0252+5038.
2AGL J0221+4250. The 95% elliptical confidence region contains two sources, i.e. 3C 66A and PSR J0218+4232, but the variability analysis excludes the PSR. Integrating in the OB 5820 (MJD 54632.5−54647.5), a MLE analysis yields a detection of 4.3σ and a flux F = (32 ± 8) × 10−8 ph cm−2 s−1. The best detection in the OB 5820 is in the time interval MJD 54641.5−54645.5, with a detection of 4.0σ and a flux F(E > 100 MeV)=(50 ± 15) × 10−8 ph cm−2 s−1, with a statistical 95% c.l. elliptical confidence region that includes only 3C 66A, establishing a firm identification of 2AGL J0221+4250 source with this BLL.
2AGL J0429−3755. Integrating in the time interval MJD 54497.5−54501.5 MJD, a MLE analysis yields a detection of 4.9σ and a flux F = (50 ± 15) × 10−8 ph cm−2 s−1, positionally consistent with the BLL PKS 0426-380, establishing a firm identification with 2AGL J0429-3755 source.
2AGL J0531+1334. A low level significance 2AGL source with a positional association with the FSRQ PKS 0528+134, which could be promoted to firm identification via the VOUblaz tool thanks to MW information.
2AGL J0538−4401. Integrating in the OB 6210 (MJD 54749.5−54756.5), a MLE analysis yields a detection of 5.4σ and a mean flux F = (35 ± 9) × 10−8 ph cm−2 s−1, positionally consistent with PKS 0537−441, establishing a firm identification of this AGN with 2AGL J0538−4401 source. The source PKS 0537−441 has an high average flux value in the 2AGL catalogue because it has mainly been observed in a ToO pointing during a flaring state.
2AGL J0723+7122. The 2AGL J0723+7122 source is firmly identified with BLL S5 0716+714. The highest detection of 2AGL J0723+7122 with a time resolution of four days is during the time interval MJD 54349.5−54353.5: an MLE analysis yields a detection of 6σ and a flux F(E > 100 MeV) = (70 ± 17) × 10−8 ph cm−2 s−1. Additional observations are reported in Giommi et al. (2008), Chen et al. (2008), Vittorini et al. (2009). In particular Chen et al. (2008) report a peak level of F(E > 100 MeV) = (193 ± 42) × 10−8 ph cm−2 s−1 in MJD 54353.5−54354.5 (one-day timescale), and show an increase in flux by a factor of four in three days. An astronomer’s telegrams (ATEL) is reported for this source (see Table 12) during the pointing mode.
2AGL J1052−6234. We detect a flare during the time interval MJD 54649.5−54653.5: a MLE analysis yields a detection of 4σ and a flux F = (40 ± 12) × 10−8 ph cm−2 s−1, identifying the PMN J1047−6217 (that is inside the 95% c.l. elliptical confidence region) with the 2AGL J1052−6234 source.
2AGL J1228+4910. The 2AGL J1228+4910 is identified with FSRQ TXS 1226+492 (also known as BZQ J1228+4858) because it shows a γ-ray flare during the period 54461.5−54465.5: an MLE analysis yields a detection of 4.0σ and a flux F = (103 ± 37) × 10−8 ph cm−2 s−1. In addition, during the OB 6710 (MJD 54850.75−54890.5) an MLE analysis yields a detection of 4.6σ and a mean flux F = (89 ± 23) × 10−8 ph cm−2 s−1.
2AGL J1228+0154. The 2AGL J1228+0154 source is identified with FSRQ 3C 273; γ-ray activity is reported in Pacciani et al. (2009).
2AGL J1255−0543. The 2AGL J1255−0543 source is identified with FSRQ 3C 279 (Giuliani 2009; Pittori et al. 2018). In the automated analysis we detect 2AGL J1255−0543 during the time interval OB 5010 (MJD 54450.5−54473.5): an MLE analysis yields a detection of 4.9σ and a flux F = (26 ± 6) × 10−8 ph cm−2 s−1. The γ-ray emission exhibited the largest amplitude variability on both long (months) and short (days) timescales. The source 3C 279 has a high average flux value in the 2AGL catalogue because it has been mainly observed in ToO pointings during flaring states.
2AGL J1507+1019. This source is identified with PKS 1502+106. We detect 2AGL J1507+1019 during the OB 6800 (MJD 54890.5−54921.5): an MLE analysis yields a detection of 6.1σ and a flux F = (60 ± 12) × 10−8 ph cm−2 s−1.
2AGL J1513−0905. The 2AGL J1513−0905 is identified with PKS 1510−089. This FSRQ shows a strong variability during the AGILE pointing mode (Pucella et al. 2008; D’Ammando et al. 2009; D’Ammando et al. 2011a; D’Ammando et al. 2011b). The 2AGL catalogue light curve is reported in Fig. 11. Many ATELs are reported for this source (see Table 12).
2AGL J1626−2943. The 2AGL J1626−2943 source is identified with PKS 1622−29. We detect the 2AGL J1626−2943 during the time interval MJD 54329.5−54333.5: an MLE analysis yields a detection of 5σ and a flux F = (95 ± 26) × 10−8 ph cm−2 s−1. Another detection of 3.8σ with a flux of F = (117 ± 35) × 10−8 ph cm−2 s−1 is detected in MJD 54517.5−54521.5.
2AGL J1741+5126. The 95% c.l. elliptical confidence region is marginally compatible with FSRQ 4C +51.37. The association can be promoted to identification via the VOUblaz tool thanks to MW information.
2AGL J1803−3935. The 2AGL J1803−3935 source is identified with FSRQ PMN J1802−3940. We detect 2AGL J1803−3935 during the time interval MJD 55077.5−55081.5; a MLE analysis yields a detection of 4.5σ and a flux F = (46 ± 14) × 10−8 ph cm−2 s−1.
2AGL J1833−2104. The 2AGL J1833−2104 source is identified with FSRQ PKS 1830−211 (Donnarumma et al. 2011). We detect 2AGL J1833−2104 during many time intervals in the four-day timescale light curve. The two main flares are; MJD 54529.5−54533.5, where a MLE analysis yields a detection of 4.0σ and a flux F = (48 ± 15) × 10−8 ph cm−2 s−1; and MJD 55113.5−55117.5, where a MLE analysis yields a detection of 5.5σ and a flux F = (50 ± 12) × 10−8 ph cm−2 s−1. An ATEL is reported for this source (see Table 12) during the pointing mode.
2AGL J1849+6706. The 2AGL J1849+6706 source is identified with FSRQ S4 1849+67. We detect 2AGL J1849+6706 during many time intervals in the four-day timescale light curve. The two main flares are: MJD 54637.5−54641.5, where a MLE analysis yields a detection of 4.2σ and a flux F = (42 ± 14) × 10−8 ph cm−2 s−1; and MJD 54853.5−54857.5, where a MLE analysis yields a detection of 4.5σ and a flux F = (44 ± 14) × 10−8 ph cm−2 s−1.
2AGL J1913−1928. We found two interesting sources within the 2AGL J1913−1928 95% c.l. elliptical confidence region: PMN J1911−1908 (an already known γ-ray emitter present in the 3FGL catalogue – 3FGL J1911.4−1908) and PKS B1908−201 (3FGL J1911.2−2006). We detect 2AGL J1913−1928 during the OB 4800 (MJD 54406.5−54435.5); a MLE analysis yields a detection of 5.7σ and a flux F = (80 ± 16) × 10−8 ph cm−2 s−1, but this detection still excludes the two sources. Another detection is reported during the time interval MJD 54725.5−54729.5; a MLE analysis yields a detection of 4.0σ and a flux F = (40 ± 12) × 10−8 ph cm−2 s−1 that is associable only with the PMN J1911−1908. Using the VOUblaz tool, thanks to spectral MW information, the most probable association would be with the PKS B1908−201. In any case, owing to the uncertainties this source is classified as unidentified.
2AGL J2025+3352. The 2AGLJ2025+3352 source is identified with BCU B2 2023+33. We detect 2AGL J2025+3352 during the time interval MJD 54425.5−54429.5; a MLE analysis yields a detection of 5.6σ and a flux F = (109 ± 25) × 10−8 ph cm−2 s−1.
2AGL J2027−0740. The 2AGL J2027−0740 source is identified with PKS 2023−07. We detect 2AGL J2027−0740 during many time intervals (see Fig. 12): (i) MJD 54389.5−54393.5 with a detection of 6σ and a flux F = (60 ± 13) × 10−8 ph cm−2 s−1; (ii) MJD 54417.5−54421.5 with a detection of 7.6σ and a flux F = (113 ± 21) × 10−8 ph cm−2 s−1; and (iii) MJD 54425.5−54429.5 with a detection of 5.4σ and a flux F = (80 ± 19) × 10−8 ph cm−2 s−1.
2AGL J2202+4214. This source is firmly identified with BL Lacertae. Firm identification of this source has been established via the VOUblaz tool thanks to MW information.
2AGL J2254+1609. This source is firmly identified with 3C454.3. Figure 13 reports the light curve in the pointing period. Firm identification of this source has been established thanks to different MW campaigns (Vercellone et al. 2008a,b, 2010, 2011; Donnarumma et al. 2009; Pacciani et al. 2010; Striani et al. 2010). Many ATELs are reported for this source (see Table 12).
7.2. AGILE–only sources
In Table 13 we report the full list of AGILE–only sources, i.e. 2AGL sources that do not have any counterpart on 1FGL, 2FGL, or 3FGL catalogues. For AGILE–only sources, the light curves over one-, four-, and seven-day timescales were calculated, in addition to the light curves estimated over OB timescales. All the γ-ray fluxes reported below for each source are estimated through the AGILE–GRID MLE analysis in the energy range 100 MeV–10 GeV. Some detections with a significance of less than 4σ are also reported for a possible identification.
AGILE only sources.
2AGL J0714+3318. This source is already part of 1AGL and 1AGLR catalogues (based on single OB data analysis); we have a detection in the OB 4200 (MJD 54377.5−54385.5), as in 1AGLR: a MLE analysis over this period yields a detection of 4.0σ and a flux F = (30 ± 9) × 10−8 ph cm−2 s−1. Just outside the 95% c.l. elliptical confidence region we note the 5BZQ J0719+3307/B2 0716+33 classified as a FSRQ and associated with the Fermi-LAT source 3FGL J0719.3+3307. Using the VOUblaz tool, we investigated some candidate associations in other wavelengths: just outside the 95% error ellipse, there is the 3HSP J071223.5+331333 that has a SED compatible with the AGILE–GRID sensitivity.
2AGL J1120−6222. The 2AGL J1120−6222 shows a high-confidence detection over the period MJD 55055.5−55062.5 (seven days); a MLE analysis yields a detection of 4.6σ and a flux F = (67 ± 18) × 10−8 ph cm−2 s−1. Interestingly, we note that just inside the 95% c.l. elliptical confidence region it is located the HMXB 1A 1118−615 (WRAY 15−793), a Be X-ray binary system included in the INTEGRAL General Reference Catalog (INTREFCAT; version 41 of the 22 June 2018; Ebisawa et al. 2003).
2AGL J1138−1724. The 2AGL J1138−1724 source is identified with the BL Lac 5BZB J1137−1710, also associated with 2FHL J1137.9−1710. We detect a γ-ray flare during the time interval MJD 54968.5−54969.5 (one-day timescale): an MLE analysis yields a detection of 4σ and a flux F = (130 ± 50) × 10−8 ph cm−2 s−1.
2AGL J1203−2701c. This source is denoted with “c” because the position could be influenced by another γ-ray excess just outside the 95% c.l. elliptical confidence region. No candidate source within the ellipse is present from flat spectrum radio source of other catalogs of interest. The VOUblaz tool allows us to find some candidate sources to be associated with this 2AGL, of which 5BZQ J1205−2634, a low-energy cutoff BL Lacs (LBL, defined by Padovani & Giommi 1995) just outside the 95% error ellipse, is the most probable counterpart.
2AGL J1312−3403. We note that outside the AGILE 95% error ellipse of this AGILE–only source at about 0.46° is 3FGL J1311.8−3430, which is a LAT PSR J1311−3430 (associated with 0FGL J1311.9−3419 and 3EG J1314−3431). In MJD 54699.5−54701.5 time interval (two-day timescale) we detect a spatially coincident event at 4.0σ with a flux of F = (97 ± 38) × 10−8 ph cm−2 s−1. The VOUblaz tool also shows an intermediate synchrotron peaked BL Lacs (IBL) candidate just outside the 95% error ellipse that has a single radio point in the SED, weak XMM X-ray data, and no γ-rays; extrapolation from X-ray to γ-ray in the AGILE–GRID range is difficult.
2AGL J1402−8142. This source has no known candidate counterparts within the 95% elliptical confidence region: either radio or from specific source classes. In MJD 54751.5−54753.5 time interval (two-day timescale) we detect an event at 3.9σ with a flux of F = (56 ± 20) × 10−8 ph cm−2 s−1. Just outside the ellipse at ∼1°, there is the 4U 1450−80 X-ray source of the INTREFCAT.
2AGL J1628−4448. Low latitude source without any known γ-ray source within its elliptical confidence region. A detection appears in the OB 6200 (MJD 54719.5−54749.5) at 3.6σ and a flux F = (121 ± 35) × 10−8 ph cm−2 s−1. Fermi-LAT (which was running during the OB 6200) did not report the detection of the source because it was just for a 14% of the time below 50° off-axis; more details in Appendix A.
2AGL J1631−2039. This is a high latitude source whose elongated ellipse does not include any known γ-ray source. We detect this source as active over the OB 6800 period (MJD 54890.5−54921.5), at 3.6σ, and a flux F = (16 ± 5)× 10−8 ph cm−2 s−1. Using the VOUblaz tool an interesting 408 mJy (1.4 GHz) NVSS radio source, PMN J1629−2039, is found at 13′ (RA,Dec: 247.26267,−20.44881), but the possible extrapolated γ-ray emission into the AGILE–GRID range for a possible LBL (Padovani & Giommi 1995) blazar is too weak for the AGILE–GRID sensitivity.
2AGL J1636−4610 Low latitude source with a detection at 4.1σ and a flux F = (16 ± 4) × 10−8 ph cm−2 s−1 appears over the OB 6800 period (MJD 54890.5−54921.5).
2AGL J1640−5050c. Low latitude source showing a very soft spectral index of 2.84 ± 0.17. Two detections appear from the OB timescale light curve: one at 3.9σ and a flux F = (19.2 ± 5.2) × 10−8 ph cm−2 s−1 on MJD 54647.5−54672.75 (OB 5900) and the other at 3.4σ and a flux F = (12.4 ± 3.8) × 10−8 ph cm−2 s−1 on MJD 55055.5−55074.5 (OB 7800). Its large elliptical confidence location region partially overlaps with the unassociated 3FGL J1643.6−5002 error ellipse. Another Fermi-LAT unassociated source, 3FGL J1639.4−5146, appears at around 1° from the source centroid. This source is denoted with “c” owing to the large source confidence location region.
2AGL J1731−0527. High latitude source without any known γ-ray source within its elliptical confidence region. It shows a detection at 3.7σ and flux F = (27.6 ± 8.7) × 10−8 ph cm−2 s−1 over the OB period MJD 55104.5−55119.5 (OB 8300), plus other detections over two-, four-, and seven-day timescales. Within the confidence location region, at 15′ from the source centroid, lies the flat-spectrum radio source CRATES J173032−051505.
2AGL J1736−7819. Low latitude source with no known γ-ray source within its elliptical confidence region. Partially overlapping with the 95% confidence contour of the EGRET source 3EG J1720−7820. The source is also detected on a four-day integration starting at MJD = 54653.5 at 3.1σ, with a flux F = (21 ± 8) × 10−8 ph cm−2 s−1. At 19′ from the 2AGL J1736−7819 centroid lies the radio source PKS 1723−78.
2AGL J1740−3013. This is a Galactic centre region source, positionally consistent with TeVJ1741−302 (HESS J1741−302). Despite several attempts to constrain its nature, no plausible counterpart has been found (Abdalla et al. 2018). We note an increasing flux from this source during the seven-day time interval MJD 54740.5−54747.5; a MLE analysis yields a detection of 4.3σ and a flux F = (86 ± 23) × 10−8 ph cm−2 s−1.
2AGL J1743−2613c. The 2AGL J1743−2613c is an unidentified source of the Galactic centre region. Within 0.8° we found 3FGL J1740.5−2642, and 3FGL J1741.9−2539 associated with the BCU NVSS J174154−253743. This source is denoted with “c” owing to the complexity of the region.
2AGL J1746−2921. The 2AGL J1746−2921 is a flaring source of the Galactic centre. The source had shown a increasing γ-ray emission in the OB 6200 (MJD 54719.5−54749.5). More refined light curves of one-, four-, and seven-day timescales showed flaring activities in these periods: 54719.5−54726.5 (seven days), 54730.5−54731.5 (one day), 54737.5−54741.5 (four days).
2AGL J1754−2626. The 2AGL J1754−2626 is an unidentified source near the Galactic centre. At about 11′ appears the high-mass X-ray binary IGR J17544−2619 (Liu et al. 2006), seen by INTEGRAL (Ebisawa et al. 2003) and also by Swift-BAT (Oh et al. 2018). The source shows two flaring episodes on the OB 5600 (MJD 54566.5/54586.5) and OB 6200 (MJD 54719.5−54749.5), both with a significance above 5σ and a flux F = (58 ± 12) × 10−8 ph cm−2 s−1 and F = (23 ± 5) × 10−8 ph cm−2 s−1, respectively.
2AGL J1820−1150c. Low latitude source with no known γ-ray source within its elliptical confidence region. It shows a strong flaring episode at 6.1σ and a flux F = (85 ± 16)× 10−8 ph cm−2 s−1 over the OB 4800 period (MJD 54406.5−54435.5). No clear possible association has been identified. This source is denoted with “c” owing to the large uncertainty on its location.
2AGL J1823−1504. The 2AGL J1823−1504 is an unidentified source of the Galactic plane. The 3EG J1824−1514 was partially inside the 95% elliptical confidence region. We detect a γ-ray flare from 2AGL J1823−1504 region in the time interval MJD 54552.5−54553.5; a MLE analysis yields a detection of 4.1σ and a flux F = (281 ± 86) × 10−8 ph cm−2 s−1.
2AGL J1857+0015. Low latitude source without any known γ-ray source within its elliptical confidence region, close to the W44 region. It shows only a detection at 3.4σ and a flux F = (105 ± 39) × 10−8 ph cm−2 s−1 over the four-day timescale MJD 54773.5−54777.5. At 46′ from the source centroid lays the pulsar PSR B1853+00.
2AGL J1910−0637. This source is just outside the Galactic plane and we have two detections on a one-week timescale, the most significant at 3.6σ in MJD 54572.5−54579.5 time interval. No γ-ray source neither flat spectrum radio source are within the 95% elliptical confidence region.
2AGL J1913+0050. This AGILE–GRID-only source appears just below the Galactic plane. It shows two detections over OB 6400 (MJD 54770.5−54800.5): one at 3.5σ and flux F = (8.0 ± 2.5) × 10−8 ph cm−2 s−1, and the other at 3.2σ and flux F = (14.0 ± 4.6) × 10−8 ph cm−2 s−1 on OB 6500 (MJD 54800.5−54820.5). Interestingly, within the 95% elliptical confidence location region, at 27′ from the source centroid, appears the low-mass X-ray binary Aql X-1 (also known 4U 1908+005), which has also been seen by Swift-BAT (Swift J1911.2+0036 (Oh et al. 2018)).
2AGL J1927−4318. High latitude source without any known γ-ray source within its elliptical confidence region. It shows a detection at 3.3σ and a flux F = (17.2 ± 6.0)× 10−8 ph cm−2 s−1 over the OB 6200 period (MJD 54719.5−54749.5) plus a detection at 3.1σ over a short timescale of four days on MJD 54533.5−54537.5. Within the AGILE–GRID elliptical source contour, there is the radio source PKS B1922−430 (at 25′ from the source centroid).
2AGL J2029+4403. Low latitude source in the complex Cygnus region without any known γ-ray source within its elliptical confidence location region. We note that the LAT pulsar 3FGL J2030.8+4416 is at about 28′.
2AGL J2055+2521. The PSR 3FGL J2055.8+2539 is at 22′ from the source centroid, just outside the 95% elliptical confidence region. It shows a detections in MJD 54426.5−54427.5 (one-day timescale) at 4.1σ and flux F = (191 ± 71) × 10−8 ph cm−2 s−1.
2AGL J2206−1044. We have a γ-ray detection on OB 8300 (MJD 55104.5−55111.5) at 4.7σ and a flux F = (63 ± 16) × 10−8 ph cm−2 s−1. A 390 mJy NVSS (1.4GHz) radio source is just outside the 95% c.l. elliptical confidence region. The source has a VI = 1 at a four-day timescale.
2AGL J2227+6418. We detect a γ-ray flare from 2AGL J2227+6418 region over the time interval MJD 54425.5−54429.5 (four days). An MLE analysis yields a detection of 4.9σ and a flux F = (32 ± 8) × 10−8 ph cm−2 s−1.
2AGL J2228−0818. The 2AGL J2228−0818 source is a high latitude AGILE–only source with a variable behaviour. We detect 2AGL J2228−0818 during the time interval MJD 54425.5−54429.5 (four days); a MLE analysis yields a detection of 4.2σ and a flux F = (61 ± 18) × 10−8 ph cm−2 s−1. Another interesting episode is in the time interval MJD 54573.5−54577.5: a MLE analysis yields a detection of 4.1σ and a flux F = (80 ± 22) × 10−8 ph cm−2 s−1. The source has a VI = 1 at a four-day timescale.
2AGL J2303+2120. This high latitude weak source, with a large error ellipse, has been detected in a single two-days integration on MJD 54571.5−54573.5 time interval at 3.7σ and a flux F = (150 ± 50) × 10−8 ph cm−2 s−1 and at 3σ on a single one-week exposure.
2AGL J2332+8215c. We find a marginal overlap of 2AGL J2332+8215c 95% c.l. elliptical confidence region with FSRQ S5 2353+81. We detect a γ-ray flare from 2AGL J2332+8215c region on the time interval MJD 54425.5−54429.5 (four days): an MLE analysis yields a detection of 5σ and a flux F = (37 ± 8) × 10−8 ph cm−2 s−1. No firm association can be established and the source is denoted as “c” since the region appears noisy.
7.3. γ-ray only sources
In this section we report notes for some γ-ray only sources. Table 14 reports the full list.
Unidentified γ-ray sources.
2AGL 0032+0512c. This source is marginally spatially coincident with 3FGL J0030.4+0451, associated with the PSR J0030+0451. This source is denoted with “c” because the evaluation of its position is strongly influenced by the spectral index α. For this reason we keep this source as γ-ray only without association with the PSR. The VOUblaz tool allows us to find some possible blazar candidates among which: (i) 5BZQ J0029+0554 (CRATES J002945+055443), a possible LBL. The SED created with the tool shows a hint of synchrotron bump but the extrapolated γ-ray emission is too weak for the AGILE–GRID sensitivity; (ii) a candidate NVSS radio source (NVSS J003047+044038). Again considering the source SED the possible synchrotron peak is too low for the extrapolated γ-ray emission in the AGILE–GRID band.
2AGL J0221+6208c. The region of 2AGL J0221+6208c includes 3FGL J0217.3+6209 (TXS 0213+619), 3FGL J0220.1+6202c, 3FGL J0223.6+6204 (unass.), and partially 3FGL J0224.0+6235. Integrating in the time interval MJD 54641.5−54645.5 (four-day timescale), a MLE analysis yields a detection of 4.1σ and a flux F = (45 ± 13) × 10−8 ph cm−2 s−1 in the energy range 100 MeV–10 GeV, but the 95% confidence region already includes the mentioned 3FGL sources. For this reason we classify this source as γ-ray only but without association with a specific 3FGL source.
2AGL J1103−7747. This source is spatially associated with the unclassified γ-ray source 3FGL J1104.3−7736c. Using the VOUblaz tool at least three candidate radio source are found, among which CRATES J105731−772424 at 4.9′ from the Fermi-LAT source: the SED seems compatible with a weak γ-ray emission in the AGILE–GRID range.
2AGL J1718−0432. The 2AGL J1718−0432 source is spatially associated with the unclassified γ-ray source 3FGL J1720.3−0428, and shows a detection at 4.0σ and a flux F = (35 ± 10) × 10−8 ph cm−2 s−1 in MJD 54897.5−54899.5. The VOUblaz tool shows a known blazar with which no radio/X-ray could be associated; this blazar is 5BZQ J1716−0452 at a distance of 27.316 ′, which is a probable FSRQ; the SED shows a clear synchrotron bump, but without X-ray or γ-ray counterparts.
2AGL J1737−3206. The 2AGL J1737−3206 shows a full overlapping with 3FGL J1737.3−3214c.
2AGL J1847−0157 The 2AGL J1847−0157 shows a full overlapping with 3FGL J1848.4−0141. We note the source TeV J1848−017 (HESS J1848−018) inside the 95% c.l. elliptical confidence region, already present in the AGILE TeVCat (Rappoldi et al. 2016).
7.4. Pulsars
Forty-one pulsars are associated with 2AGL sources. Thirteen pulsars have been identified with pulsed timing analysis on AGILE data, but only seven of these are included in the 2AGL catalogue because for these we also obtained spatial identification using the MLE analysis.
PSR J2021+3651 (2AGL J2021+3654) was the first pulsar identified by pulsation in the AGILE–GRID γ-ray data (Halpern et al. 2008). In Pellizzoni et al. (2009a,b) the pulsation of Vela (2AGL J0835−4514), Geminga (2AGL J0634+1749; Fig. 10 shows the spectra), Crab (2AGL J0534+2205), and PSR B1706−44 (2AGL J1710−4429) have been reported.
 |
Fig. 10. Comparison between the 2AGL (black spectra; 30 MeV–10 GeV) and 3FGL (red spectra; 100 MeV–10 GeV) spectra for some of the most highly exposed AGILE–GRID sources. Error bars are 1σ statistical error; upper limits are 2σ. Different values in flux at the highest energy bands depend on the evaluation of the cut-off energies due to the statistics. Panel a: Vela pulsar. Panel b: 2AGL J2021+4029 (Gamma Cygni and LAT PSR J2021+4026). Panel c: 2AGL J1710−4429. Panel d: 2AGL J1836+5924 (PSR J1836+5925). |
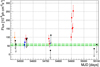 |
Fig. 11. Light curve of PKS 1510−089 in the energy range 100 MeV–10 GeV with a four-day resolution. The black downward arrows represent 2σ upper limits. The blue, orange, and red circles refer to a |

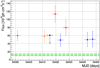 |
Fig. 12. Light curve of PKS 2023−07 in energy range 100 MeV–10 GeV, with a four-day resolution. The black downward arrows represent 2σ upper limits. The blue, orange, and red circles refer to a |

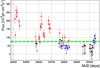 |
Fig. 13. Light curve of 3C454.3 in the energy range 100 MeV–10 GeV, with a four-day resolution. The black downward arrows represent 2σ upper limits. The blue, orange, and red circles refer to a |

In Pellizzoni et al. (2009b) the detection of pulsation for seven additional pulsars has been reported: first, four pulsars have been identified only by pulsation because no spatial identification using the MLE analysis is possible, i.e. PSR J1357−6429, PSR J1524−5625, PSR J1824−2452, and PSR J2043+2740; second, PSR J1016−5857 (2AGL J1015−5852), PSR J1513−5908 (2AGL J1517−5909), and PSR J2229+6114 (2AGL J2230+6113) have been identified with both pulsed emission and MLE analysis. An additional comment about PSR J1824−2452 is necessary because Pellizzoni et al. (2009b) also reported a MLE identification of this source; PSR J1824−2452, inside the globular cluster M28, was observed by the AGILE–GRID with good significance (>4σ) but only within a time interval of five days during a targeted pointing (for details see Pellizzoni et al. 2009b). No increase in significance of the detection was obtained with the addition of more data. The source was also detected in the imaging data relative to the same time interval. The apparent single burst of emission observed by the AGILE–GRID might be related to the fact that this millisecond pulsar is known to experience variability episodes (Cognard & Backer 2004). The pulsation of PSR J2021+4026, that is part of the extended source pulsar + nebula 2AGL J2021+4029, has been identified.
To summarise, the seven pulsars with identified pulsed emission that are firmly identified as 2AGL sources are PSR J2021+3651, Vela, Geminga, PSR B1706−44, PSR J1016−5857, PSR J1513−5908, and PSR J2229+6114. The PSR J2021+4026 is classified as a SNR and the Crab region is classified as PWN (see Sect. 7.7) because the analysis considers the integrated flux of the regions.
In the following we report additional notes.
2AGL J1029−5834. The source is associated with PSR J1028−5819 but there is only a partial overlap of the 95% elliptical confidence region.
2AGL J1458−6055. The 95% elliptical confidence region of 2AGL J1458−6055 source partially overlaps the 95% elliptical confidence region of LAT PSR J1459−6053 and 3FGL J1456.7−6046. It is not possible to establish a direct association with the pulsar.
2AGL J1517−5909. PSR J1513−5908 (Pellizzoni et al. 2009b; Pilia et al. 2010) is included in the 2AGL J1517−5909 95% elliptical confidence region. In the same region the associated extended source PWN MSH 15−12 is not detected by the AGILE–GRID.
2AGL J1710−4429. PSR J1709−4429 (PSR B1706−44) (Pellizzoni et al. 2009a) is firmly identified with 2AGL J1710−4429. Fig. 10 reports the spectra of this 2AGL source.
2AGL J1836+5924. The 2AGL J1836+5924 (Bulgarelli et al. 2008) is associated with LAT PSR J1836+5925 and shows an exponential cut-off PL spectral shape.
7.5. Cygnus region
The Cygnus region (Fig. 14) is a site of bright diffuse emission, transient, and persistent point-like and extended sources in γ-ray. The most prominent persistent γ-ray point-like sources are the three pulsars: PSR J2021+3651 (2AGL J2021+3654; see Sect. 7.4), PSR J2021+4026 (2AGL J2021+4029; see Sect. 7.8), PSR J2032+4127 (2AGL J2032+4135). Furthermore, three microquasars were detected in this region with variable γ-ray emission: Cygnus X-1 (Sabatini et al. 2010, 2013), Cygnus X-3 (2AGL J2033+4060; Tavani et al. 2009b; Abdo et al. 2009c; Bulgarelli et al. 2012b; Piano et al. 2012), and V404 Cygni (Piano et al. 2017). Cygnus X-1 and V404 Cygni are not part of this catalogue. Many Astronomer’s Telegrams are associated with sources of the Cygnus region, in particular with PSR J2021+4026 and Cygnus X-3 (see Table 12).
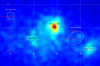 |
Fig. 14. Count map of the Cygnus region in Galactic coordinates with superimposed the 2AGL catalogue 95% c.l. elliptical confidence regions. We report also some associations and 3FGL catalogue 95% c.l. elliptical confidence regions inside the 2AGL regions. |
Two main extended γ-ray sources are present in this region but not present in the 2AGL catalogue because not detected with extended model: the Cygnus cocoon (Ackermann et al. 2011) and the SNR Gamma Cygni (G78.2+2.1, Fraija & Araya 2016).
7.6. Carina region
The Carina region is shown in Fig. 15. We have detected some remarkable sources. We detect η-Carinae (2AGL J1045−5954) binary system, the HMXB 1FLG J1018.6−5856 (Ackermann & Ajello 2012) (2AGL J1020−5906), eight pulsars, i.e. PSR J1016−5857 (2AGL J1015−5852; see Sect. 7.4), PSR J1019−5749 (2AGL J1020−5752), PSR J1028−5819 (2AGL J1029−5834), LAT PSR J1044−5737 (2AGL J1045−5735), PSR J1048−5832 (2AGL J1048−5836), PSR J1112−6103 (2AGL J1111−6060), LAT PSR J1135−6055 (2AGL J1136−6045), PSR J1203−63 (2AGL J1204−6247), a marginal association with the PSR J1028−581 (2AGL J1029−5834; see Sect. 7.4), and two AGNs ATG20G J112319−641735 (associated with 2AGL J1119−6443) and PMN J1047−6217 (identified with 2AGL J1052−6234, see Sect. 7.1).
 |
Fig. 15. Count map of the Carina region in Galactic coordinates with superimposed the 2AGL catalogue 95% c.l. elliptical confidence regions. We also report some associations and 3FGL catalogue 95% c.l. elliptical confidence regions inside the 2AGL regions. On top and left there is a zoom of the region around (l, b)=(285° ,0°). |
η-Carinae (2AGL J1045−5954) is a colliding wind binary in the same Galactic region of the Carina nebula. The system was observed from radio to X-ray and, in 2009, the AGILE–GRID detected for the first time γ-ray emission correspondent to η-Carinae (Tavani et al. 2009c; Sabatini et al. 2011). The source was also then detected by Fermi-LAT (Abdo et al. 2009a, 2010a) with a flux consistent with the AGILE–GRID estimation. The absence of γ-ray emission variation correlated with the X-ray variability cannot provide an unambiguous identification of the detected source with η-Carinae. However, the AGILE–GRID revealed a flare activity that could be associated with particle acceleration and, in recent months, a Nustar observation has detected non-thermal variable X-ray emission with the same spectral index 1.65 as in the γ-ray band (Hamaguchi et al. 2018). This could be the first evidence that η-Carinae is emitting high-energy photons (in both hard X-ray and γ-ray bands) likely from particle acceleration.
7.7. Pulsar wind nebulae (PWN)
2AGL J0534+2205. The Crab pulsar has been identified by pulsation in Pellizzoni et al. (2009a). Crab is the most prominent PWN of the 2AGL catalogue. The anti-centre region (including Crab and Geminga) was observed for ∼45 days, mostly in 2007 September and in 2008 April (during AO1) with the addition of other sparse short Crab pointings for SuperAGILE calibration purpose during the science verification phase. Figure 16 shows the light curve with one-day resolution, where the first recorded γ-ray flare from the Crab nebula is evident (Tavani et al. 2011; Vittorini et al. 2011; Striani et al. 2011, 2013). The flux reported in the 2AGL catalogue includes the contribution from both pulsar and nebula, excluding the first γ-ray flare from the Crab nebula, and no separate analysis is made for this catalogue because we rely on the already cited papers.
 |
Fig. 16. Light curve of the Crab pulsar+nebula in the energy range 100 MeV–10 GeV, with a one-day resolution. The black downward arrows represent 2σ upper limits. The blue, orange, and red circles refer to a |

2AGL J0835−4514. In the 2AGL catalogue the Vela region is reported as a pulsar (see Sect. 7.4). The detection of the Vela PWN with the AGILE–GRID was reported in Pellizzoni et al. (2010).
2AGL J1634−4734e. HESS J1632−478 (Balbo et al. 2010), associated with 2AGL J1634−4734e, is an energetic pulsar wind nebula with an age of the order of 104 years in the Norma region. The nebula has a size of 1 pc and is modelled as an extended source in the 2AGL catalogue.
7.8. Supernova remnants
The AGILE–GRID has detected many confirmed γ-ray SNRs, all middle-aged and very bright in the radio band.
2AGL J0617+2239e. This source is associated with the SNR IC 443. In angular size, it is the largest SNR detected in the Galaxy in the radio band. Its radio morphology is composed of two interacting synchrotron emitting shells. The AGILE–GRID detects γ-ray emission from IC 443 in correspondence of the more external radio shell (Tavani et al. 2010). In 2013, Fermi-LAT published a γ-ray spectrum down to energies below 200 MeV, confirming the presence of high-energy CR at the SNR shock (Ackermann et al. 2013a,b). TeV γ-ray emission was detected at the centre of the radio shell, in correspondence of a likely associated molecular cloud (MC) (Acciari et al. 2009a,b). The spectral index of the remnant is steeper than 2.0 and the cut-off is at energies below 100 TeV.
2AGL J1715−3815. This extended source is associated with the TeV emitting SNR CTB 37A (Aharonian et al. 2008a, HESS J1714−385) located at a distance of ∼13 kpc. The TeV emission is correlated with detected MCs (Maxted et al. 2013) and could be associated with the non-thermal X-ray source CXOU J171419.8−383023. The detection of this SNR with Fermi-LAT in 2013 (Brandt et al. 2001) in the GeV band is correlated with TeV and X-ray emissions, supporting the likely hypothesis of the presence of energised particles in the SNR shock with surrounding MCs.
2AGL J1801−2334. This source is associated with the SNR W28, another mixed morphology SNR with a shell radio structure described by a set of large, coherent arcs running along the edge of the remnant. The AGILE–GRID detected γ-ray emission from two different regions of this remnant, correlated with two MCs at different distances and with an anti-correlation in brightness with the TeV emission (Giuliani et al. 2010; Aharonian et al. 2008b). In 2014, Fermi-LAT confirmed the AGILE–GRID detection (Hanabata et al. 2014). The γ-ray emission is interpreted as accelerated CR interacting with two distant MCs. The parameters in this catalogue are found assuming a LP shape for the spectrum (see Table 8), with a very steep spectral index. We are unable to detect W28 with an extended model; only the point-like model provides a detection.
2AGL J1856+0119e. This source is associated with the very radio-bright, middle-aged SNR W44. The AGILE–GRID detects a γ-ray spectrum down to energies below 200 MeV, confirming for the first time the presence of energised CRs in correspondence of a SNR/MC interaction shock (Giuliani et al. 2011; Cardillo et al. 2014). This spectrum was confirmed by Fermi-LAT in 2013 (Ackermann et al. 2013a). No TeV emission has been detected from this source. The parameters in this catalogue are found assuming a LP shape for the spectrum with a steep spectral index (see Sect. 8).
2AGL J1911+0907. This source is in correspondence of the TeV J1911+0905/SNR W49B. The VHE γ-ray emission is found to be point-like and this source is found in the AGILE–GRID data. The SNR originated from a core-collapse supernova that occurred between one and four thousand years ago, and has evolved into a mixed morphology remnant that is interacting with MCs (Abdalla et al. 2018).
2AGL J1924+1416. This source is associated with the SNR W51c, a component of the MC complex W51, together with the two star-forming regions, W51A and W51B. W51C shows a thick incomplete shell-like structure in the radio band, explained by electron synchrotron emission. Fermi-LAT detected γ-ray emission from this remnant, for the first time, in 2009 (Abdo et al. 2009b) and then, thanks to the improvement of the analysis software, the satellite data were re-analysed showing a spectrum down to energies below 200 MeV for this source as well (Jogler & Funk 2016). The Major Atmospheric Gamma Imaging Cherenkov telescope (MAGIC) also detected TeV emission from W51c (Aleksic 2012) but, as in all the other γ-ray detected SNRs, the spectrum has a spectral index steeper than the theoretical value of 2 and has a cut-off energy below 100 TeV.
2AGL J2021+4029. The radio source G78.2+2.1 (Gamma Cygni) is a typical shell-type SNR located within the extended emission of the Cygnus X region and it has the pulsar PSR J2021+4026 at its centre. The 2AGL J2021+4029 includes both the SNR Gamma Cygni and the PSR J2021+4026. Figure 10 reports the spectra in the energy range 100 MeV–10 GeV. PSR J2021+4026 is found to be variable in γ-ray (Chen et al. 2011; Allafort et al. 2013); many ATELs are associated with this source (see Table 12). Work is ongoing on the analysis of non-pulsed γ-ray emission to separate the pulsar contribution from that due to the SNR (Piano et al. 2019).
2AGL J2044+5012e. This source is associated with the mixed morphology SNR HB 21, located in a dense environment with a radio shape suggesting interaction with a MC. Its γ-ray emission was detected by Fermi-LAT in 2013 (Pivato et al. 2013) but there are no other detection in the γ-ray band. However, the behaviour of the remnant seems to be the same as all the other middle-aged SNRs detected at high energies. We detect HB 21 as an extended source (see Table 7).
7.9. Binaries
The 2AGL catalogue contains the detection of four High Mass X-ray Binaries (HMXB): LSI +61 303 (2AGL J0239+6120; which shows variability), Cygnus X-3 (2AGL J2033+4060; see Sect. 7.5), LS 5039 (2AGL J1826−1438), and 1FGL J1018.6−5856 (2AGL J1020−5906; see Sect. 7.6). Two other TeV emitters, HESS J0632+057 and PSR B1259−63, do not have persistent counterparts in the 2AGL catalogue. Cygnus X-1, which has shown a flaring activity during the pointing mode (see Sect. 7.5), has no 2AGL counterpart. η-Carinae, identified as a binary system, is included as 2AGL J1045−5954 (see Sect. 7.6).
7.10. Confused sources
In this section we comment on some confused sources (see Sect. 6.1). The sources 2AGL J1203−2701c, 2AGL J1640−5050c, 2AGL J1743−2613c, 2AGL J1820−1150c, and 2AGL J2332+8215c are discussed in Sect. 7.2. The sources 2AGL 0032+0512c and 2AGL J0221+6208c are discussed in Sect. 7.3.
2AGL J1407−6136c. The 95% elliptical confidence region of this 2AGL source partially overlaps the 95% elliptical confidence region of 3FGL J1405.4−6119 and 3FGL J1409.7−6132 (PSR J1410−6132). In the 1AGL catalogue a source was centred at a distance of 1.21° from the current position of this 2AGL source. An ATEL is reported for this source (see Table 12) during the pointing mode.
2AGL J1838−0623c. This is a Galactic plane source with a large 95% c.l. elliptical confidence region, which leads to multiple spatial coincidences. A refined analysis is not able to reduce the c.l. confidence region.
8. 2AGL γ-ray sources list detected below 100 MeV
Table 15 reports an extension of the 2AGL catalogue, which lists the sources also detected in the energy range 50–100 MeV. The spectral model is the same as in the 2AGL catalogue and the flux is calculated fixing all the spectral model parameters. Galactic and diffuse emission model parameters are determined independently for each energy band. In addition, the low-confidence extension in the energy range 30–50 MeV is also reported in the same table with the same assumptions.
2AGL sources with detection in the range 30–100 MeV.
9. Conclusions
This paper presents an exhaustive report of the results obtained by the AGILE–GRID during the pointing mode period of operations starting in mid-2007 and ending in October 2009 (2.3 years). The AGILE–GRID turns out to be very effective in studying γ-ray sources above 100 MeV. The AGILE mission has been the first to operate in 2007 after the end of operations in 1996 of the EGRET γ-ray instrument on board the Compton Gamma-Ray Observatory. The AGILE–GRID was the first γ-ray detector capable of obtaining an unprecedentedly large FoV of 2.5 sr with much improved angular resolution compared with the previous generation of instruments. The pointing capability and observation strategy during the pointing phase of operations provided an excellent exposure of γ-ray sources for each individual pointing period.
The detector optimisation in the energy range 100 MeV to a few hundreds MeV (with significant capability in the energy range 50–100 MeV) is among the most relevant assets of the AGILE–GRID. Despite its relatively small size, the AGILE–GRID turns out to be very effective in detecting both short-lived and persistent γ-ray sources. This paper presents the 2AGL catalogue of persistent γ-ray sources detected by the AGILE–GRID during the pointing phase, which includes 175 high-confidence sources of both Galactic and extragalactic origin. Many source classes are represented: pulsars, PWNe, SNRs, compact objects, and blazars. In addition to confirming previously known relatively strong γ-ray sources, the 2AGL catalogue includes a substantial number of new sources compared to EGRET and 29 sources that are detected only by the AGILE–GRID.
A comparison with the Fermi-LAT instrument (operating since 2008 and overlapping in time during the second half of the pointing period considered in this work) has been performed. Different observing strategy, effective area, sky region exposures, and viewing angle during gamma-ray transient episodes may account for different results; see Appendix A for a direct comparison between the AGILE–GRID and Fermi-LAT visibility of some of the 2AGL sources detected only by AGILE–GRID.
Starting in 2010, AGILE has continued operations in orbit in spinning mode, therefore changing several important details concerning the exposure of γ-ray observations. An account of the γ-ray sources detected by the AGILE–GRID in spinning mode will be presented elsewhere.
Estimate of the pure cosmic extragalactic diffuse emission is out of the scope of this paper, and it would require much more stringent requirements on the purity of the γ-ray event selection (Ackermann et al. 2015).
http://tevcat.uchicago.edu/ (Wakely, S., and Horan, D.)
At high values of the off-axis angle (>50°), the Fermi-LAT sensitivity is up to 50% lower than the nominal on-axis value.
Acknowledgments
The AGILE Mission is funded by the Italian Space Agency (ASI) with scientific and programmatic participation by the Italian Institute of Astrophysics (INAF) and the Italian Institute of Nuclear Physics (INFN). Investigation supported by the ASI grant I/089/06/2. We thank the ASI management for unfailing support during AGILE operations. We acknowledge the effort of ASI and industry personnel in operating the ASI ground station in Malindi (Kenya), and the data processing done at the ASI/SSDC in Rome: the success of AGILE scientific operations depend on the effectiveness of the data flow from Kenya to SSDC and on the data analysis and software management. We also acknowledge the use of innovative tools that are under development within the United Nations “Open Universe” initiative.
References
- Abdalla, H., Abramowski, A., Aharonianet, F., et al. 2018, A&A, 612, A13 [NASA ADS] [CrossRef] [EDP Sciences] [Google Scholar]
- Abdo, A. A., Ackermann, M., Ajello, M., et al. 2009a, ApJS, 183, 46 [NASA ADS] [CrossRef] [Google Scholar]
- Abdo, A. A., Ackermann, M., Ajello, M., et al. 2009b, ApJ, 706, L1 [NASA ADS] [CrossRef] [Google Scholar]
- Abdo, A. A., Ackermann, M., Ajello, M., et al. 2009c, Science, 326, 1512 [NASA ADS] [CrossRef] [PubMed] [Google Scholar]
- Abdo, A. A., Ackermann, M., Ajello, M., et al. 2010a, ApJ, 723, 649 [NASA ADS] [CrossRef] [Google Scholar]
- Abdo, A. A., Ackermann, M., Ajello, M., et al. 2010b, ApJS, 188, 405 [NASA ADS] [CrossRef] [Google Scholar]
- Abdo, A. A., Ackermann, M., Ajello, M., et al. 2011, Science, 331, 739 [NASA ADS] [CrossRef] [PubMed] [Google Scholar]
- Acciari, V. A., Aliu, E., Arlen, T., et al. 2009a, ApJ, 698, 133 [Google Scholar]
- Acciari, V. A., Aliu, E., Arlen, T., et al. 2009b, ApJ, 707, 612 [NASA ADS] [CrossRef] [Google Scholar]
- Acero, F., Ackermann, M., Ajello, M., et al. 2015, ApJS, 218, 2 [Google Scholar]
- Ackermann, M., Ajello, M., Allafort, A., et al. 2011, Science, 334, 1103 [NASA ADS] [CrossRef] [PubMed] [Google Scholar]
- Ackermann, M., Ajello, M., Ballet, J., et al. 2012, Science, 335, 189 [NASA ADS] [CrossRef] [Google Scholar]
- Ackermann, M., Ajello, M., Allafort, A., et al. 2013a, Science, 339, 807 [NASA ADS] [CrossRef] [PubMed] [Google Scholar]
- Ackermann, M., Ajello, M., Allafort, A., et al. 2013b, ApJS, 209, 34 [NASA ADS] [CrossRef] [Google Scholar]
- Ackermann, M., Ajello, M., Albert, A., et al. 2015, ApJ, 799, 86 [NASA ADS] [CrossRef] [Google Scholar]
- Ajello, M., Atwood, W. B., Baldini, L., et al. 2017, ApJS, 232, 18 [NASA ADS] [CrossRef] [Google Scholar]
- Aleksic, J., Alvarez, E. A., Antonelli, L. A., et al. 2012, A&A, 541, A13 [NASA ADS] [CrossRef] [EDP Sciences] [Google Scholar]
- Allafort, A., Baldini, L., Ballet, J., et al. 2013, ApJ, 777, L2 [NASA ADS] [CrossRef] [Google Scholar]
- Aharonian, F., Akhperjanian, A., & de Barres Almeida, U. 2008a, A&A, 486, 829 [NASA ADS] [CrossRef] [EDP Sciences] [Google Scholar]
- Aharonian, F., Akhperjanian, A., Bazer-Bachi, A., et al. 2008b, A&A, 481, 401 [NASA ADS] [CrossRef] [EDP Sciences] [MathSciNet] [PubMed] [Google Scholar]
- Argan, A., Tavani, M., Giuliani, A., et al. 2004, NSSMIC IEEE, 375, 371 [Google Scholar]
- Atwood, W. B., Abdo, A. A., Ackermann, M., et al. 2009, ApJ, 697, 1071 [NASA ADS] [CrossRef] [Google Scholar]
- Balbo, M., Saouter, P., Walter, R., et al. 2010, A&A, 520, A111 [NASA ADS] [CrossRef] [EDP Sciences] [Google Scholar]
- Barbiellini, G., Bordignon, G., & Fedel, G. 2001, in Gamma 2001: Gamma-Ray Astrophysics, eds. S. Ritz, N. Gehrels, & C. R. Shrader, AIP Conf. Ser., 587, 754 [Google Scholar]
- Brandt, T. J., & Fermi Collaboration 2013, Adv. Space Res., 51, 247 [NASA ADS] [CrossRef] [Google Scholar]
- Bulgarelli, A., Tavani, M., Caraveo, P., et al. 2008, A&A, 489, L17 [NASA ADS] [CrossRef] [EDP Sciences] [Google Scholar]
- Bulgarelli, A., Argan, A., & Barbiellini, G. 2010, NIM A, 614, 213 [NASA ADS] [CrossRef] [Google Scholar]
- Bulgarelli, A., Tavani, M., Chen, A. W., et al. 2012a, A&A, 540, A79 [NASA ADS] [CrossRef] [EDP Sciences] [Google Scholar]
- Bulgarelli, A., Tavani, M., Chen, A. W., et al. 2012b, A&A, 538, A63 [NASA ADS] [CrossRef] [EDP Sciences] [Google Scholar]
- Bulgarelli, A., Trifoglio, M., & Gianotti, F. 2014, ApJ, 781, 19 [NASA ADS] [CrossRef] [Google Scholar]
- Calabretta, M. R., & Greisen, E. W. 2002, A&A, 395, 1077 [NASA ADS] [CrossRef] [EDP Sciences] [Google Scholar]
- Cardillo, M., Tavani, M., Giuliani, A., et al. 2014, A&A, 565, A74 [NASA ADS] [CrossRef] [EDP Sciences] [Google Scholar]
- Carosi, A., Antonelli, L. A., Giommi, P., Lucarelli, F., et al. 2015, ICRC, 34, 757 [NASA ADS] [Google Scholar]
- Cattaneo, P. W., Argan, A., Boffelli, F., et al. 2011, NIM A, 630, 251 [NASA ADS] [CrossRef] [Google Scholar]
- Cattaneo, P. W., Rappoldi, A., Arganet, A., et al. 2018, ApJ, 861, 2 [CrossRef] [Google Scholar]
- Chen, A. W., D’Ammando, F., Villata, M., et al. 2008, A&A, 489, L37 [NASA ADS] [CrossRef] [EDP Sciences] [Google Scholar]
- Chen, A. W., Piano, G., Tavani, M., et al. 2011, A&A, 525, A33 [NASA ADS] [CrossRef] [EDP Sciences] [Google Scholar]
- Chen, A. W., Argan, A., Bulgarelli, A., et al. 2013, A&A, 558, A37 [NASA ADS] [CrossRef] [EDP Sciences] [Google Scholar]
- Chi, X., & Wolfendale, A. W. 1991, J. Phys. G, 17, 987 [NASA ADS] [CrossRef] [Google Scholar]
- Clemens, D. P. 1985, ApJ, 295, 422 [NASA ADS] [CrossRef] [Google Scholar]
- Cognard, I., & Backer, D. C. 2004, ApJ, 612, 125 [NASA ADS] [CrossRef] [Google Scholar]
- Dame, T. M., Hartmann, D., & Thaddeus, P. 2001, ApJ, 547, 792 [NASA ADS] [CrossRef] [Google Scholar]
- D’Ammando, F., Pucella, G., Raiteri, C. M., et al. 2009, A&A, 508, 181 [NASA ADS] [CrossRef] [EDP Sciences] [Google Scholar]
- D’Ammando, F., Bulgarelli, A., Chen, A. W., et al. 2011a, Adv. Space Res., 48, 76 [NASA ADS] [CrossRef] [Google Scholar]
- D’Ammando, F., Raiteri, C. M., Villata, M., et al. 2011b, A&A, 2011, A145 [CrossRef] [EDP Sciences] [Google Scholar]
- Donnarumma, I., Pucella, G., Vittorini, V., et al. 2009, ApJ, 707, 2 [Google Scholar]
- Donnarumma, I., De Rosa, A., Vittorini, V., et al. 2011, ApJ, 736, 2 [Google Scholar]
- Ebisawa, K., Bourban, G., Bodaghee, A., Mowlavi, N., & Courvoisier, T. J.-L. 2003, A&A, 411, L59 [NASA ADS] [CrossRef] [EDP Sciences] [Google Scholar]
- Feroci, M., Costa, E., Soffitta, P., et al. 2007, NIM A, 581, 728 [NASA ADS] [CrossRef] [Google Scholar]
- Fraija, N., & Araya, M. 2016, ApJ, 826, 31 [NASA ADS] [CrossRef] [Google Scholar]
- Freeman, P. E., Kashyap, V., Rosner, R., & Lamb, D. Q. 2002, APJS, 138, 185 [NASA ADS] [CrossRef] [Google Scholar]
- Giuliani, A., Chen, A. W., Mereghetti, S., et al. 2004, Mem. Soc. Astron. It. Suppl., 5, 135 [Google Scholar]
- Giuliani, A., Cocco, V., Mereghetti, S., et al. 2006, NIM A, 568, 692 [NASA ADS] [CrossRef] [Google Scholar]
- Giuliani, A., D’Ammando, F., Vercellone, S., et al. 2009, A&A, 494, 509 [NASA ADS] [CrossRef] [EDP Sciences] [Google Scholar]
- Giuliani, A., Tavani, M., Bulgarelli, A., et al. 2010, A&A, 516, A11 [NASA ADS] [CrossRef] [EDP Sciences] [Google Scholar]
- Giuliani, A., Cardillo, M., Tavani, M., et al. 2011, ApJ, 742, 30 [Google Scholar]
- Giommi, P., Colafrancesco, S., Cutini, S., et al. 2008, A&A, 487, L49 [NASA ADS] [CrossRef] [EDP Sciences] [Google Scholar]
- Giommi, P., Arrigo, G., & De Almeida, U. B. 2018, Proc. of the ESPI-UNISPACE+50 Conference [arXiv:1805.08505] [Google Scholar]
- Górski, K. M., Hivon, E., Banday, A. J., et al. 2005, ApJ, 622, 759 [NASA ADS] [CrossRef] [Google Scholar]
- Hartman, R. C., Bertsch, D. L., Bloom, S. D., Chen, A. W., et al. 1999, ApJS, 123, 79H [NASA ADS] [CrossRef] [Google Scholar]
- Halpern, J. P., Camilo, F., Giuliani, A., et al. 2008, ApJ, 688, L33 [NASA ADS] [CrossRef] [Google Scholar]
- Hamaguchi, K., Corcoran, M. F., & Pittard, J. M. 2018, Nat. Astron., 2, 731 [NASA ADS] [CrossRef] [Google Scholar]
- Hanabata, Y., Katagiri, H., Hewitt, J. W., et al. 2014, ApJ, 786, 145 [NASA ADS] [CrossRef] [Google Scholar]
- Helene, O. 1983, NIM A, 212, 319 [NASA ADS] [CrossRef] [Google Scholar]
- Jogler, T., & Funk, S. 2016, ApJ, 816, 100 [NASA ADS] [CrossRef] [Google Scholar]
- Kalberla, P. M. W., Burton, W. B., Hartmann, D., et al. 2005, A&A, 440, 775 [NASA ADS] [CrossRef] [EDP Sciences] [Google Scholar]
- Labanti, C., Marisaldi, M., Fuschino, F., et al. 2009, NIM A, 598, 470 [NASA ADS] [CrossRef] [Google Scholar]
- Liu, Q. Z., van Paradijs, J., & van den Heuvel, E. P. J. 2006, A&A, 455, 1165 [NASA ADS] [CrossRef] [EDP Sciences] [Google Scholar]
- Louis, A. K., Maas, D., & Rieder, A. 1997, Wavelets: Theory and Applications (Wiley) [Google Scholar]
- Maxted, N. I., Rowell, G. P., Dawson, B. R., et al. 2013, MNRAS, 434, 2188 [NASA ADS] [CrossRef] [Google Scholar]
- Mattox, J. R., Bertsch, D. L., Chiang, J., et al. 1996, ApJ, 461, 396 [NASA ADS] [CrossRef] [Google Scholar]
- Michelson, P. F. 2008, APS Meeting Abstracts, TSSP, L2002 [Google Scholar]
- Nolan, P. L., Abdo, A. A., Ackermann, M., et al. 2012, ApJS, 199, 31 [NASA ADS] [CrossRef] [Google Scholar]
- Oh, K., Koss, M., Markwardt, C. B., et al. 2018, ApJ, 235, 1 [Google Scholar]
- Pacciani, L., Donnarumma, I., Vittorini, V., et al. 2009, A&A, 494, 49 [NASA ADS] [CrossRef] [EDP Sciences] [Google Scholar]
- Pacciani, L., Vittorini, V., Tavani, M., et al. 2010, ApJ, 716, 2 [Google Scholar]
- Padovani, P., & Giommi, P. 1995, MNRAS, 277, 1477 [NASA ADS] [CrossRef] [Google Scholar]
- Padovani, P., Giommi, P., Resconi, E., et al. 2018, MNRAS, 480, 192 [NASA ADS] [CrossRef] [Google Scholar]
- Perotti, F., Fiorini, M., Incorvaia, S., Mattaini, E., & Sant Ambrogio, E. 2006, NIM A, 556, 228 [NASA ADS] [CrossRef] [Google Scholar]
- Pellizzoni, A., Pilia, M., Possenti, A., et al. 2009a, ApJ, 691, 2 [Google Scholar]
- Pellizzoni, A., Pilia, M., Possenti, A., et al. 2009b, ApJ, 695, 1 [NASA ADS] [CrossRef] [Google Scholar]
- Pellizzoni, A., Trois, A., Tavani, M., et al. 2010, Science, 327, 663 [NASA ADS] [CrossRef] [PubMed] [Google Scholar]
- Piano, G., Tavani, M., Vittorini, V., et al. 2012, A&A, 545, A110 [NASA ADS] [CrossRef] [EDP Sciences] [Google Scholar]
- Piano, G., Munar-Adrover, P., Verrecchia, F., Tavani, M., & Trushkin, S. A. 2017, ApJ, 839, 84 [NASA ADS] [CrossRef] [Google Scholar]
- Piano, G., Cardillo, M., Pilia, M., et al. 2019, ApJ, accepted [arXiv:1905.01255] [Google Scholar]
- Pilia, M., Pellizzoni, A., Trois, A., et al. 2010, ApJ, 723, 1 [NASA ADS] [CrossRef] [Google Scholar]
- Pittori, C. 2013, NuPhS, 239, 104 [NASA ADS] [CrossRef] [Google Scholar]
- Pittori, C., Verrecchia, F., Chen, A. W., et al. 2009, A&A, 506, 1563 [NASA ADS] [CrossRef] [EDP Sciences] [Google Scholar]
- Pittori, C., Lucarelli, F., Verrecchia, F., et al. 2018, ApJ, 856, 2 [Google Scholar]
- Pivato, G., Hewitt, J. W., & Tibaldo, L. 2013, ApJ, 779, 179 [NASA ADS] [CrossRef] [Google Scholar]
- Pucella, G., Vittorini, V., D’Ammando, F., et al. 2008, A&A, 491, L21 [NASA ADS] [CrossRef] [EDP Sciences] [Google Scholar]
- Prest, M., Barbiellini, G., Bordignon, G., et al. 2003, NIM A, 501, 280 [NASA ADS] [CrossRef] [Google Scholar]
- Rappoldi, A., Lucarelli, F., Pittori, C., et al. 2016, A&A, 587, A93 [NASA ADS] [CrossRef] [EDP Sciences] [Google Scholar]
- Sabatini, S., Tavani, M., Striani, E., et al. 2010, ApJ, 712, L10 [NASA ADS] [CrossRef] [Google Scholar]
- Sabatini, S., Tavani, M., Pian, E., et al. 2011, NIM A, 630, 1 [CrossRef] [Google Scholar]
- Sabatini, S., Tavani, M., Coppi, P., et al. 2013, ApJ, 766, 83 [NASA ADS] [CrossRef] [Google Scholar]
- Sabatini, S., Donnarumma, I., Tavani, M., et al. 2015, ApJ, 809, 60 [NASA ADS] [CrossRef] [Google Scholar]
- Striani, E., Vercellone, S., Tavani, M., et al. 2010, ApJ, 718, 1 [NASA ADS] [CrossRef] [Google Scholar]
- Striani, E., Tavani, M., Piano, G., et al. 2011, ApJ, 741, 1 [NASA ADS] [CrossRef] [Google Scholar]
- Striani, E., Tavani, M., Vittorini, V., et al. 2013, ApJ, 765, 1 [CrossRef] [Google Scholar]
- Strong, A. W., Moskalenko, I. V., & Reimer, O. 2000, ApJ, 537, 763 [NASA ADS] [CrossRef] [Google Scholar]
- Tavani, M., Barbiellini, G., Argan, A., et al. 2008, NIM A, 588, 52 [NASA ADS] [CrossRef] [Google Scholar]
- Tavani, M., Barbiellini, G., Argan, A., et al. 2009a, A&A, 502, 995 [NASA ADS] [CrossRef] [EDP Sciences] [Google Scholar]
- Tavani, M., Bulgarelli, A., Piano, G., et al. 2009b, Nature, 462, 620 [NASA ADS] [CrossRef] [PubMed] [Google Scholar]
- Tavani, M., Sabatini, S., Pian, E., et al. 2009c, ApJ, 698, L142 [Google Scholar]
- Tavani, M., Giuliani, A., Chen, A. W., et al. 2010, ApJ, 710, 151 [Google Scholar]
- Tavani, M., Bulgarelli, A., Vittorini, V., et al. 2011, Science, 331, 736 [NASA ADS] [CrossRef] [PubMed] [Google Scholar]
- Vercellone, S., Chen, A. W., Vittorini, V., et al. 2008a, ApJ, 676, L13 [NASA ADS] [CrossRef] [Google Scholar]
- Vercellone, S., Chen, A. W., Vittorini, V., et al. 2008b, ApJ, 690, 1 [Google Scholar]
- Vercellone, S., D’Ammando, F., Vittorini, V., et al. 2010, ApJ, 712, 1 [Google Scholar]
- Vercellone, S., Striani, E., Vittorini, V., et al. 2011, ApJ, 736, 2 [Google Scholar]
- Verrecchia, F., Pittori, C., Chen, A. W., et al. 2013, A&A, 558, A137 [NASA ADS] [CrossRef] [EDP Sciences] [Google Scholar]
- Vittorini, V., Tavani, M., Paggi, A., et al. 2009, ApJ, 706, 2 [NASA ADS] [CrossRef] [Google Scholar]
- Vittorini, V., Tavani, M., Pucella, G., et al. 2011, ApJ, 732, 2 [NASA ADS] [CrossRef] [Google Scholar]
- Wilks, S. S. 1938, Ann. Math. Stat., 9, 60 [Google Scholar]
- Yang, H.-J., Roe, B. P., & Zhu, J. 2005, NIM A, 555, 370 [NASA ADS] [CrossRef] [Google Scholar]
Appendix A: AGILE–only sources and the non-detection by Fermi-LAT
In this Appendix, we show that the Fermi-LAT non-detection of some of the short flaring episodes observed by the AGILE–GRID in correspondence of the so-called AGILE–only sources (see Sect. 7.2) might be due to poor exposure and non-optimal viewing angle of the source within the FoV of the instrument.
To verify that, we compared the Fermi-LAT attitude data with the AGILE–GRID data during the time intervals of two transient episodes observed only by AGILE–GRID for the 2AGL J1138−1724 and 2AGL J1402−8142 sources.
For the former case, 2AGL J1138−1724, we compared the AGILE–GRID/Fermi-LAT visibility for the γ-ray flare observed by AGILE–GRID from its position during the one-day time interval MJD 54968.5−54969.5 (see Sect. 7.2). For this period we found that the Fermi-LAT observed the 2AGL J1138−1724 sky region at an off-axis angle greater than 50° for more than 80% of its total exposure time, while for AGILE–GRID the off-axis viewing angle was always below 50° because of the constant pointing attitude (see Fig. A.1, left panel)7
Analogously, we compared the AGILE–GRID/Fermi-LAT visibility of the 2AGL J1402−8142 sky region during a transient episode detected by AGILE–GRID on the two-day timescale ranging from MJD 54751.5 to MJD 54753.5. Again, for the Fermi-LAT, the source viewing angle is mostly above 50° off-axis, while for the AGILE–GRID the source is almost always in good visibility (see Fig. A.1, right panel).
 |
Fig. A.1. Left panel: time-evolution of the off-axis viewing angles for the AGILE–only source 2AGL J1138−1724, as observed by AGILE–GRID (red points) and Fermi-LAT (blue points) during the 1 day time interval MJD 54968.5–54969.5. Right panel: same plot of the AGILE–GRID/Fermi-LAT off-axis viewing angles for the 2AGL J1402−8142 AGILE–only source over the time interval MJD 54751.5–54753.5. |
Even for AGILE–only detections occurring on longer OB timescales, the AGILE–GRID pointing attitude can always guarantee an optimum source viewing angle with respect to the Fermi-LAT. This is the case, for instance, of the 2AGL J1628−4448 detection during the OB 6200 (30 day long) (see Sect. 7.2). Also on this longer interval, the source visibility for the AGILE–GRID is, for most of the time, well below an off-axis angle of 40°, while for the Fermi-LAT it is just below 50° for 14% of the time (see Fig. A.2).
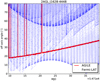 |
Fig. A.2. Time-evolution of the off-axis viewing angles for the AGILE–only source 2AGL J1628−4448, as observed by the AGILE–GRID (red points) and the Fermi-LAT (blue points) during the 30 day AGILE OB 6200 time-interval (MJD 54719.5−54749.5). |
Besides the source visibility/exposure due to the different observing modes (AGILE–GRID in pointing, Fermi-LAT in all-sky survey observing mode), particularly relevant over short time intervals, other reasons can be invoked to explain the Fermi-LAT non-detection of the AGILE–only sources. Among these, we can consider: source variability, different spectral response of the instruments, event classification algorithms, and background model (especially important for sources near the Galactic plane).
Appendix B: Evaluation of the maximum likelihood method for detection of 2AGL sources
The detection process reported in Sect. 4 can be divided in the following steps: (i) the determination of the seeds, (ii) iterative analysis of seeds, and (iii) refined analysis.
For the evaluation of the list of initial seeds we considered that the most seeds found with the significance TS maps method has also been found with the wavelet method, wherein only one trial for each seed has been carried out. A second trial could be considered during the iterative analysis of seeds.
To evaluate the final number of spurious sources involved in the 2AGL procedure, that is related with the refined analysis, we performed a set of Monte Carlo simulations of AGILE–GRID observations, to compare the data distribution of TS produced by the analysis procedure with that predicted by Wilks’s theorem. The probability that the result of a trial in an empty field has TS ≥ h is the complement of the cumulative distribution of TS. Simulated data are generated using a background model and the AGILE–GRID IRFs described in Sect. 2. The energy range used is 100 MeV–10 GeV. We considered a typical mean value of the exposure, considering the ring centred at (l = 39.375, b = −22.024), simulating observation of an empty field (considering only isotropic background model with giso = 5 and putting ggal = 0), adding Poisson-distributed noise to each pixel, and analysing each resulting sky map exactly as flight data. We performed a maximum likelihood analysis at the centre of the ring, keeping the position and spectral index of a candidate source fixed. Figure B.1 shows the resulting TS distribution (left panel) and the related p-value distribution (right panel); if we fit the TS distribution with the function  if TS > 1 (see Bulgarelli et al. 2012a) we get η = 0.5, i.e. TS = 16 corresponds to 4σ significance and TS = 9 corresponds to 3σ significance.
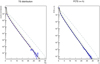 |
Fig. B.1. TS distribution (left side) and p-distribution (right side) of a simulated empty field, with ggal = 0 and giso = 5, flux free, and position and spectral parameters fixed. The blue crosses indicate the calculated distribution, the black line indicates the best fit, the red dotted line indicates the |


All Tables
AGILE astronomer’s telegrams (ATEL) in pointing mode and associated 2AGL catalogue sources.
All Figures
|
Fig. 1. Squared root scaled exposure sky map in the energy range 100 MeV–10 GeV in Galactic coordinates and Hammer–Aitoff projection for the 2.3 year period analysed for the 2AGL catalogue (expressed in units of cm2 s sr). Bin size = 0.1°. |
| In the text | |
|
Fig. 2. Intensity map in the 100 MeV–10 GeV energy band in Galactic coordinates and Hammer–Aitoff projection for the 2.3 year period analysed for the 2AGL catalogue (expressed in units of ph cm−2 s−1 sr−1). Bin size = 0.1°. |
| In the text | |
|
Fig. 3. AGILE diffuse γ-ray background emission model Giuliani et al. (2004) in the energy range 300 MeV–1 GeV, in ph cm−2 s−1 sr−1, in plate carree projection with a bin size of 0.1°. |
| In the text | |
|
Fig. 4. Scales 10, 20, 25, and 35 of the wavelet algorithm applied on the Cygnus region from top to bottom and left to right. The maps of scale 20 (top, right) contains a zoom of the Cygnus region. |
| In the text | |
|
Fig. 5. First six steps of the iterative procedure on the significance TS maps described in Sect. 4.3 applied to the Cygnus region (panels from top to bottom and left to right). Green circles are centred on the pixels with the maximum TS found in each step. The last map (bottom right) contains all the green circles of the first six steps and the final 95% confidence region of the 2AGL sources. Even if border seeds are removed (see seeds found in panels 4 and 5), they are still present in the final version of the catalogue because they may be located in the overlapping nearby rings with a position closer to the centre, and sometimes the final position couldslightly change (see seed found in panel 4). |
| In the text | |
|
Fig. 6. Comparison of the energy flux in the energy range 100 MeV–10 GeV estimated from the sum of bands (ordinate) and the fit to the full band (abscissa) for all 2AGL sources, in 10−8 ph cm−2 s−1. No obvious bias can be observed. |
| In the text | |
|
Fig. 7. Sky map of 4σ sensitivity in the energy range 100 MeV–10 GeV in Galactic coordinates and Hammer–Aitoff projection; the hypothesis of a PL spectral model with α = 2.1, in ph cm−2 s−1. The 95% elliptical confidence regions of the 2AGL sources are superimposed in black. |
| In the text | |
|
Fig. 8. Some distributions of 2AGL source parameters. Top left figure: spectral index distributions for sources with PL spectral model, all sources (blue), and only for sources with high latitude (|b| > 10) (red). Top right figure: 95% confidence region error radius (blue), the semi-major axes of 95% elliptical confidence region (red), and the semi-minor axes (green). Middle left figure: integral flux in the energy range 100 MeV–10 GeV, for sources with PL spectral model. Middle right figure: eccentricity of the 95% elliptical confidence region for all sources (blue) and for high latitude sources (|b|> 10) (red). Bottom left figure: distance between the 2AGL sources classified as pulsars and their 3FGL counterparts for sources with |
| In the text | |
|
Fig. 9. Positions, in Galactic coordinates, of the 2AGL sources labelled by different symbols according to their class for the full sky (top) and a blow-up of the inner Galactic region (bottom). All AGN classes are plotted with the same symbol. |
| In the text | |
|
Fig. 10. Comparison between the 2AGL (black spectra; 30 MeV–10 GeV) and 3FGL (red spectra; 100 MeV–10 GeV) spectra for some of the most highly exposed AGILE–GRID sources. Error bars are 1σ statistical error; upper limits are 2σ. Different values in flux at the highest energy bands depend on the evaluation of the cut-off energies due to the statistics. Panel a: Vela pulsar. Panel b: 2AGL J2021+4029 (Gamma Cygni and LAT PSR J2021+4026). Panel c: 2AGL J1710−4429. Panel d: 2AGL J1836+5924 (PSR J1836+5925). |
| In the text | |
|
Fig. 11. Light curve of PKS 1510−089 in the energy range 100 MeV–10 GeV with a four-day resolution. The black downward arrows represent 2σ upper limits. The blue, orange, and red circles refer to a |
| In the text | |
|
Fig. 12. Light curve of PKS 2023−07 in energy range 100 MeV–10 GeV, with a four-day resolution. The black downward arrows represent 2σ upper limits. The blue, orange, and red circles refer to a |
| In the text | |
|
Fig. 13. Light curve of 3C454.3 in the energy range 100 MeV–10 GeV, with a four-day resolution. The black downward arrows represent 2σ upper limits. The blue, orange, and red circles refer to a |
| In the text | |
|
Fig. 14. Count map of the Cygnus region in Galactic coordinates with superimposed the 2AGL catalogue 95% c.l. elliptical confidence regions. We report also some associations and 3FGL catalogue 95% c.l. elliptical confidence regions inside the 2AGL regions. |
| In the text | |
|
Fig. 15. Count map of the Carina region in Galactic coordinates with superimposed the 2AGL catalogue 95% c.l. elliptical confidence regions. We also report some associations and 3FGL catalogue 95% c.l. elliptical confidence regions inside the 2AGL regions. On top and left there is a zoom of the region around (l, b)=(285° ,0°). |
| In the text | |
|
Fig. 16. Light curve of the Crab pulsar+nebula in the energy range 100 MeV–10 GeV, with a one-day resolution. The black downward arrows represent 2σ upper limits. The blue, orange, and red circles refer to a |
| In the text | |
|
Fig. A.1. Left panel: time-evolution of the off-axis viewing angles for the AGILE–only source 2AGL J1138−1724, as observed by AGILE–GRID (red points) and Fermi-LAT (blue points) during the 1 day time interval MJD 54968.5–54969.5. Right panel: same plot of the AGILE–GRID/Fermi-LAT off-axis viewing angles for the 2AGL J1402−8142 AGILE–only source over the time interval MJD 54751.5–54753.5. |
| In the text | |
|
Fig. A.2. Time-evolution of the off-axis viewing angles for the AGILE–only source 2AGL J1628−4448, as observed by the AGILE–GRID (red points) and the Fermi-LAT (blue points) during the 30 day AGILE OB 6200 time-interval (MJD 54719.5−54749.5). |
| In the text | |
|
Fig. B.1. TS distribution (left side) and p-distribution (right side) of a simulated empty field, with ggal = 0 and giso = 5, flux free, and position and spectral parameters fixed. The blue crosses indicate the calculated distribution, the black line indicates the best fit, the red dotted line indicates the |
| In the text | |
Current usage metrics show cumulative count of Article Views (full-text article views including HTML views, PDF and ePub downloads, according to the available data) and Abstracts Views on Vision4Press platform.
Data correspond to usage on the plateform after 2015. The current usage metrics is available 48-96 hours after online publication and is updated daily on week days.
Initial download of the metrics may take a while.