Fig. 5.
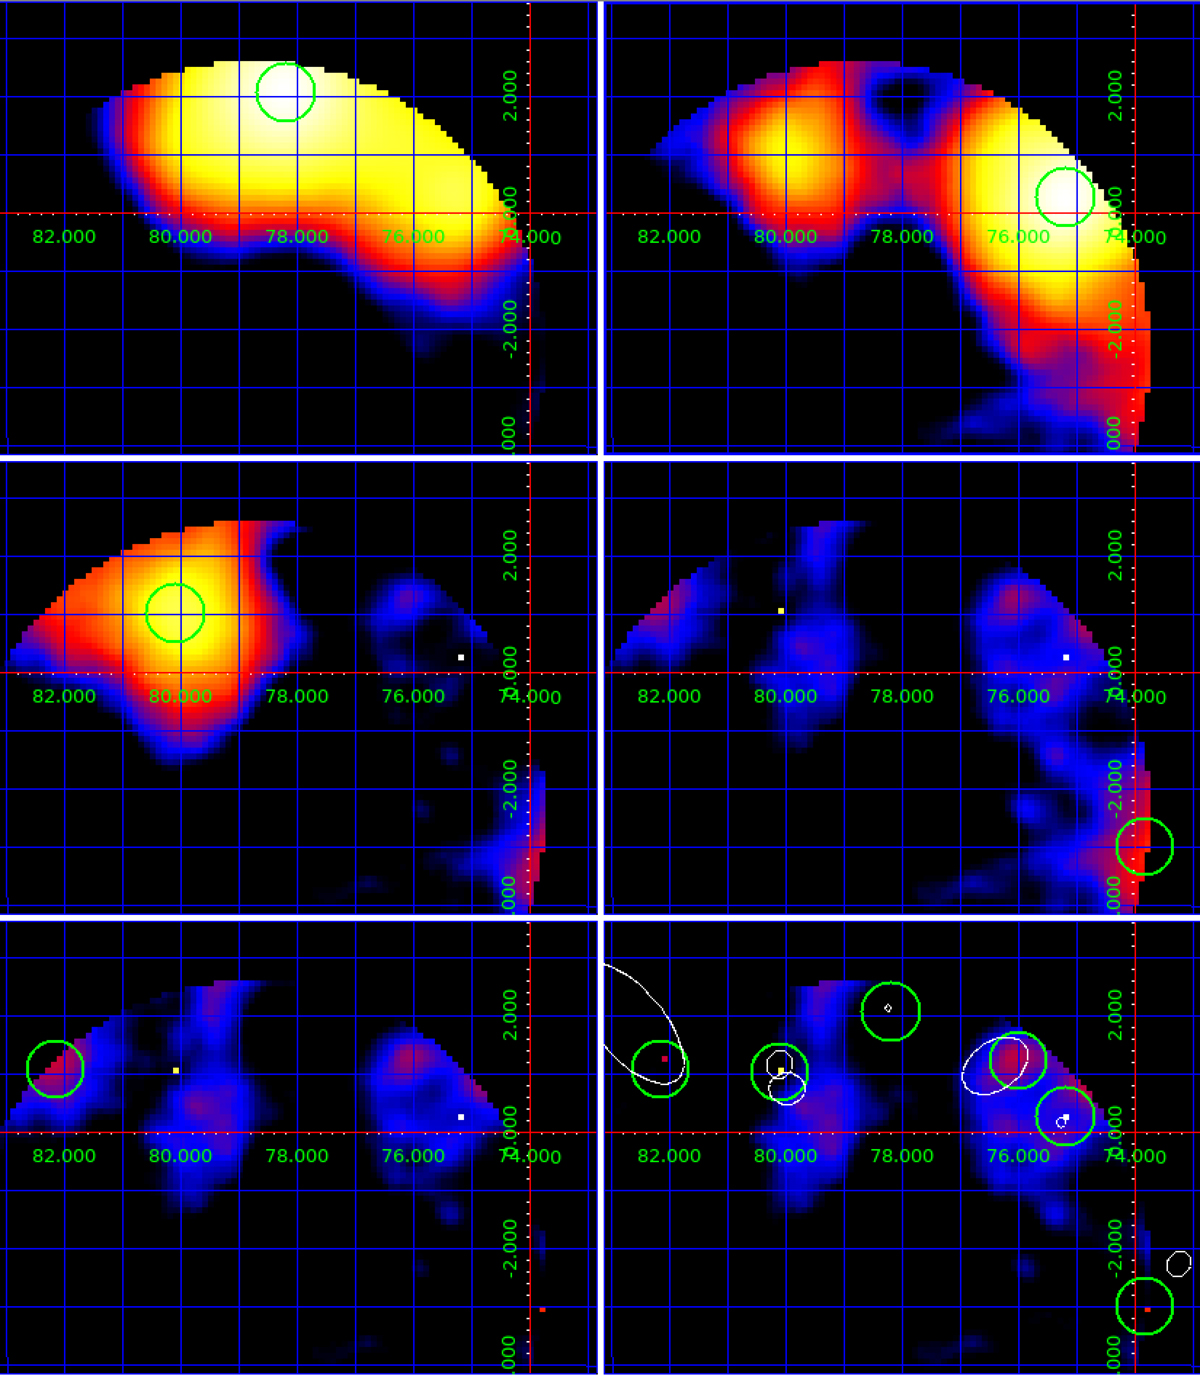
First six steps of the iterative procedure on the significance TS maps described in Sect. 4.3 applied to the Cygnus region (panels from top to bottom and left to right). Green circles are centred on the pixels with the maximum TS found in each step. The last map (bottom right) contains all the green circles of the first six steps and the final 95% confidence region of the 2AGL sources. Even if border seeds are removed (see seeds found in panels 4 and 5), they are still present in the final version of the catalogue because they may be located in the overlapping nearby rings with a position closer to the centre, and sometimes the final position couldslightly change (see seed found in panel 4).
Current usage metrics show cumulative count of Article Views (full-text article views including HTML views, PDF and ePub downloads, according to the available data) and Abstracts Views on Vision4Press platform.
Data correspond to usage on the plateform after 2015. The current usage metrics is available 48-96 hours after online publication and is updated daily on week days.
Initial download of the metrics may take a while.