Fig. 8.
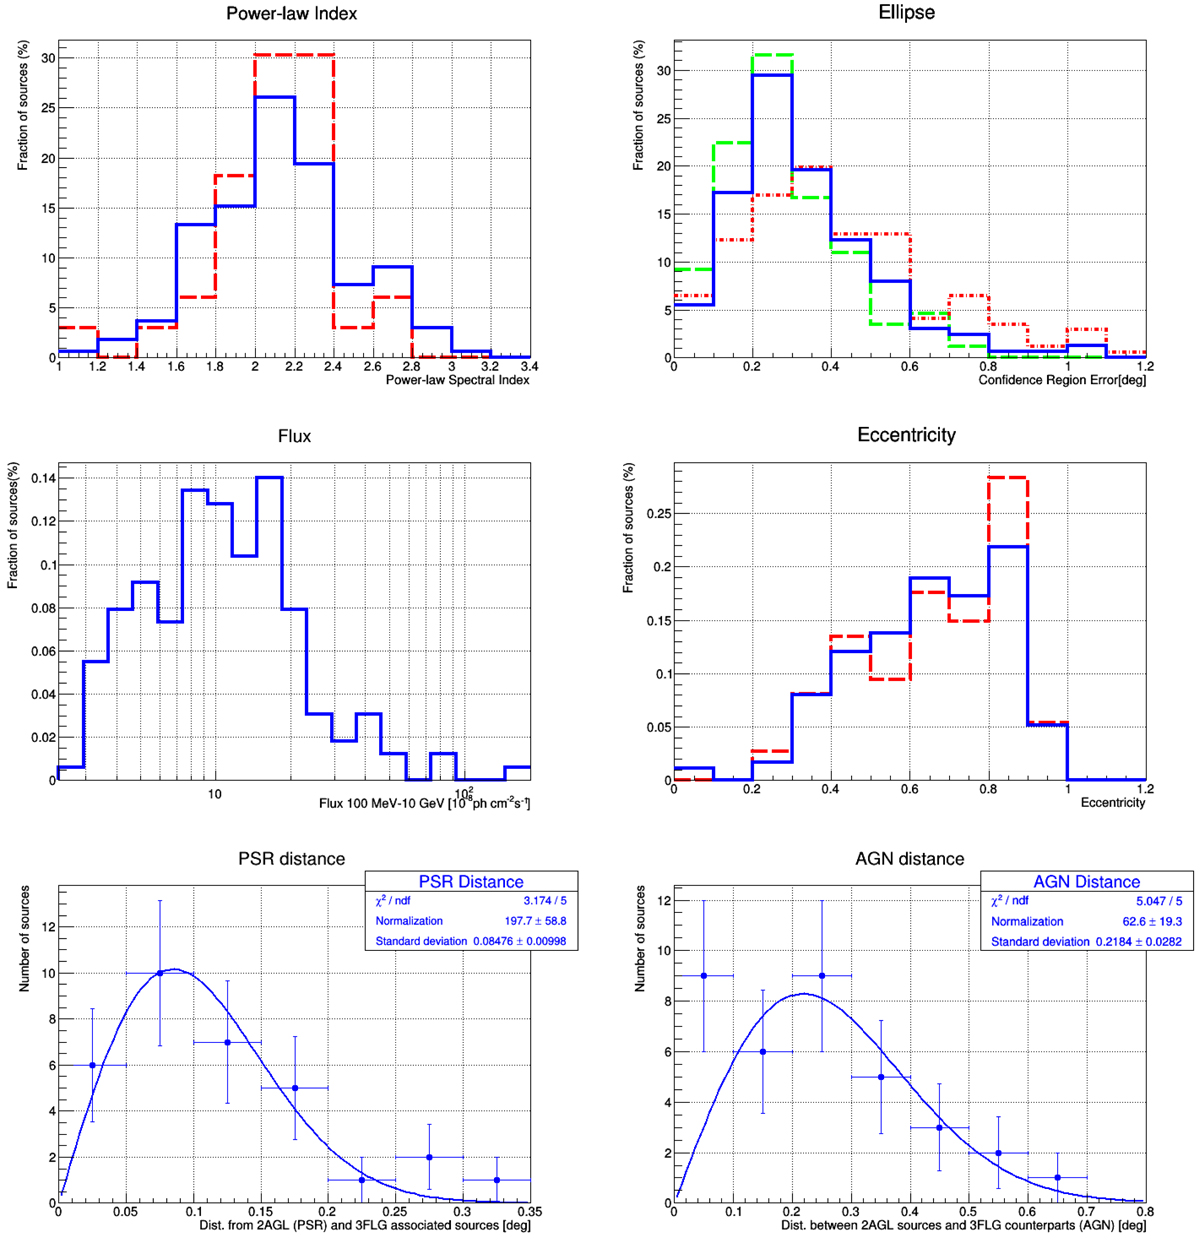
Some distributions of 2AGL source parameters. Top left figure: spectral index distributions for sources with PL spectral model, all sources (blue), and only for sources with high latitude (|b| > 10) (red). Top right figure: 95% confidence region error radius (blue), the semi-major axes of 95% elliptical confidence region (red), and the semi-minor axes (green). Middle left figure: integral flux in the energy range 100 MeV–10 GeV, for sources with PL spectral model. Middle right figure: eccentricity of the 95% elliptical confidence region for all sources (blue) and for high latitude sources (|b|> 10) (red). Bottom left figure: distance between the 2AGL sources classified as pulsars and their 3FGL counterparts for sources with ![]() . Boottom right figure: distance between 2AGL sources classified as AGN and their 3FGL counterparts, for sources with
. Boottom right figure: distance between 2AGL sources classified as AGN and their 3FGL counterparts, for sources with ![]() . In the latter two figures the data are fit with a Rayleigh function.
. In the latter two figures the data are fit with a Rayleigh function.
Current usage metrics show cumulative count of Article Views (full-text article views including HTML views, PDF and ePub downloads, according to the available data) and Abstracts Views on Vision4Press platform.
Data correspond to usage on the plateform after 2015. The current usage metrics is available 48-96 hours after online publication and is updated daily on week days.
Initial download of the metrics may take a while.