Free Access
Fig. 11.
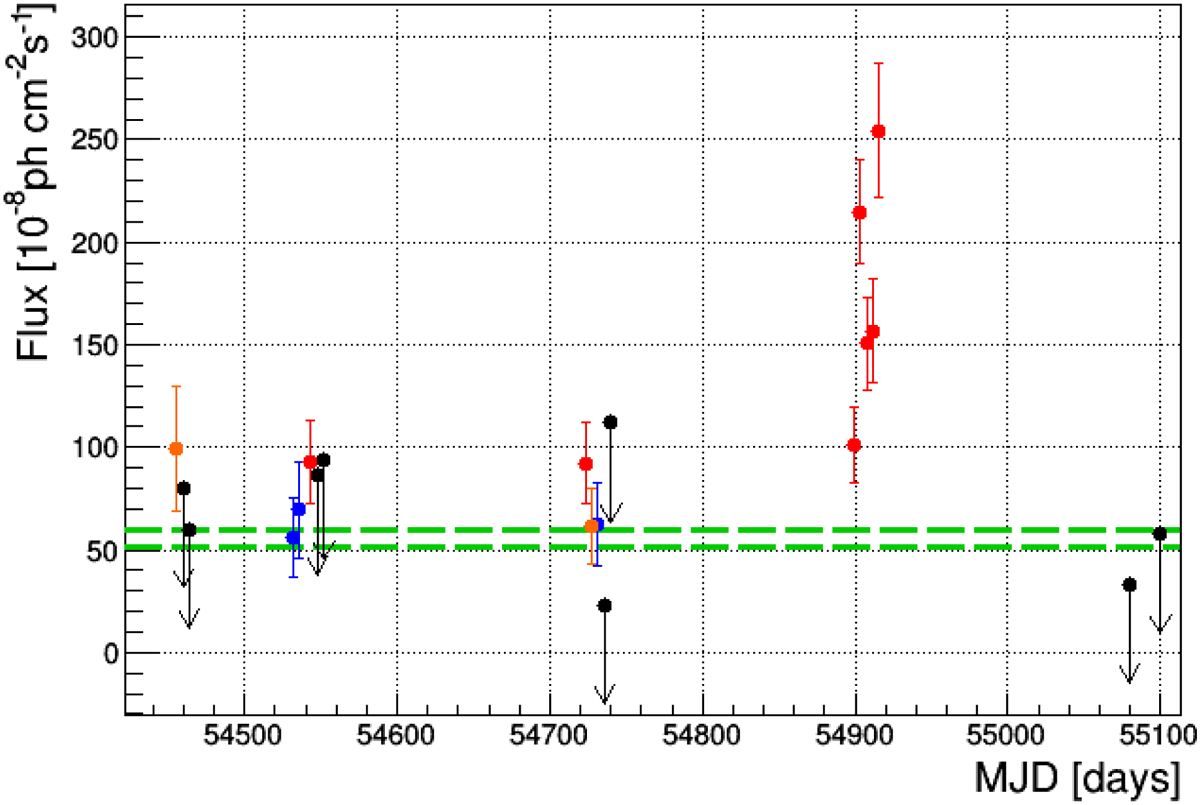
Light curve of PKS 1510−089 in the energy range 100 MeV–10 GeV with a four-day resolution. The black downward arrows represent 2σ upper limits. The blue, orange, and red circles refer to a ![]() , ≥4, and ≥5 respectively. The green dashed lines indicate the average flux plus/minus the error from Table 10.
, ≥4, and ≥5 respectively. The green dashed lines indicate the average flux plus/minus the error from Table 10.
Current usage metrics show cumulative count of Article Views (full-text article views including HTML views, PDF and ePub downloads, according to the available data) and Abstracts Views on Vision4Press platform.
Data correspond to usage on the plateform after 2015. The current usage metrics is available 48-96 hours after online publication and is updated daily on week days.
Initial download of the metrics may take a while.