Fig. A.1.
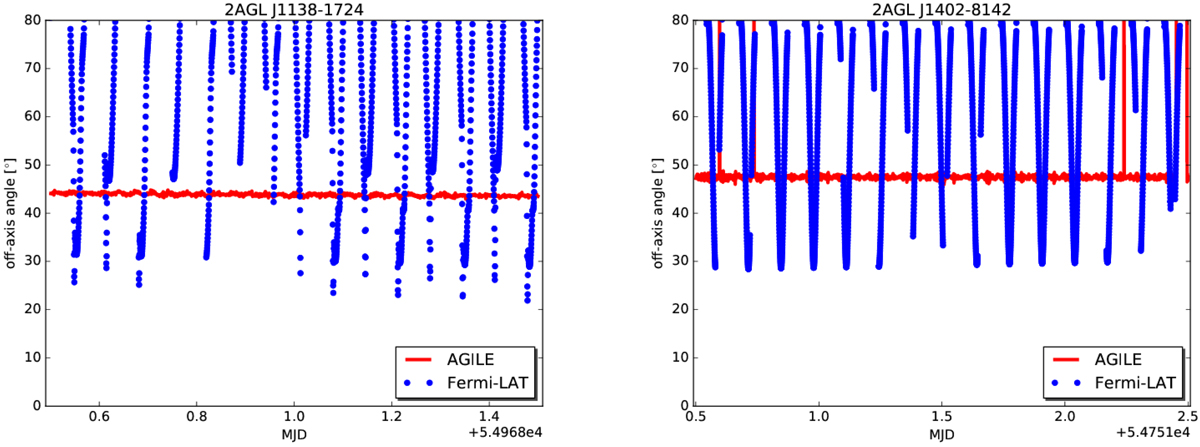
Left panel: time-evolution of the off-axis viewing angles for the AGILE–only source 2AGL J1138−1724, as observed by AGILE–GRID (red points) and Fermi-LAT (blue points) during the 1 day time interval MJD 54968.5–54969.5. Right panel: same plot of the AGILE–GRID/Fermi-LAT off-axis viewing angles for the 2AGL J1402−8142 AGILE–only source over the time interval MJD 54751.5–54753.5.
Current usage metrics show cumulative count of Article Views (full-text article views including HTML views, PDF and ePub downloads, according to the available data) and Abstracts Views on Vision4Press platform.
Data correspond to usage on the plateform after 2015. The current usage metrics is available 48-96 hours after online publication and is updated daily on week days.
Initial download of the metrics may take a while.