Fig. 10.
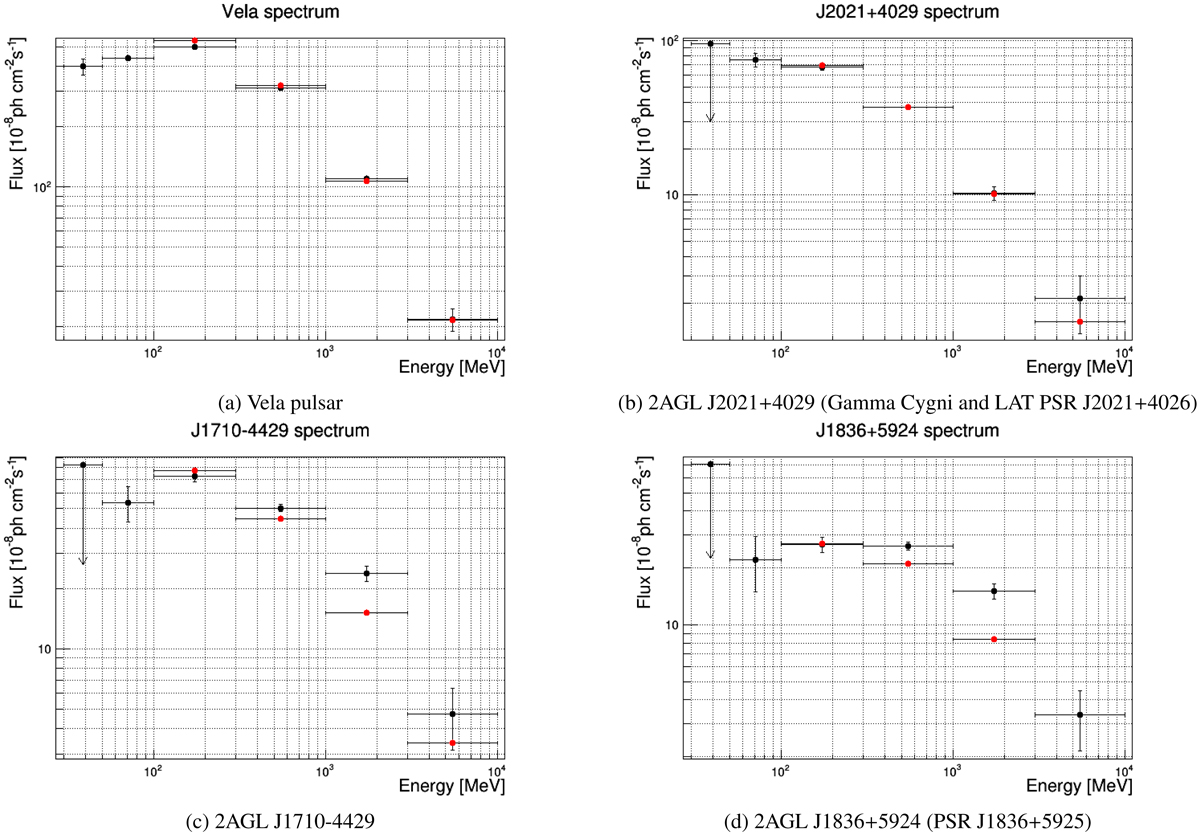
Comparison between the 2AGL (black spectra; 30 MeV–10 GeV) and 3FGL (red spectra; 100 MeV–10 GeV) spectra for some of the most highly exposed AGILE–GRID sources. Error bars are 1σ statistical error; upper limits are 2σ. Different values in flux at the highest energy bands depend on the evaluation of the cut-off energies due to the statistics. Panel a: Vela pulsar. Panel b: 2AGL J2021+4029 (Gamma Cygni and LAT PSR J2021+4026). Panel c: 2AGL J1710−4429. Panel d: 2AGL J1836+5924 (PSR J1836+5925).
Current usage metrics show cumulative count of Article Views (full-text article views including HTML views, PDF and ePub downloads, according to the available data) and Abstracts Views on Vision4Press platform.
Data correspond to usage on the plateform after 2015. The current usage metrics is available 48-96 hours after online publication and is updated daily on week days.
Initial download of the metrics may take a while.