| Issue |
A&A
Volume 626, June 2019
|
|
|---|---|---|
| Article Number | A47 | |
| Number of page(s) | 28 | |
| Section | Extragalactic astronomy | |
| DOI | https://doi.org/10.1051/0004-6361/201833771 | |
| Published online | 12 June 2019 | |
Galaxies lacking dark matter in the Illustris simulation⋆
1
Helmholtz Institut für Strahlen- und Kernphysik (HISKP), University of Bonn, Nussalle 14-16, 53121 Bonn, Germany
e-mail: This email address is being protected from spambots. You need JavaScript enabled to view it.
2
Charles University, Faculty of Mathematics and Physics, Astronomical Institute, V Holešovivckách 2, 180 00 Praha 8, Czech Republic
3
School of Astronomy, Institute for Research in Fundamental Sciences (IPM), PO Box 19395-5531 Tehran, Iran
4
LESIA, Paris Observatory, PSL University, CNRS, Sorbonne University, Univ. Paris Diderot, Paris Cité Sorbonne, 5 Place Jules Janssen, 92195 Meudon, France
Received:
4
July
2018
Accepted:
22
April
2019
Abstract
Context. Any viable cosmological model in which galaxies interact predicts the existence of primordial and tidal dwarf galaxies (TDGs). In particular, in the standard model of cosmology (ΛCDM), according to the dual dwarf galaxy theorem, there must exist both primordial dark matter-dominated and dark matter-free TDGs with different radii.
Aims. We study the frequency, evolution, and properties of TDGs in a ΛCDM cosmology.
Methods. We use the hydrodynamical cosmological Illustris-1 simulation to identify TDG candidates (TDGCs) and study their present-day physical properties. The positions of galaxies in the radius–mass plane, depending on their nonbaryonic content, are compared with observational data and other simulations. We also present movies on the formation of a few galaxies lacking dark matter, confirming their tidal dwarf nature. Tidal dwarf galaxy candidates can however also be formed via other mechanisms, such as from ram-pressure-stripped material or, speculatively, from cold-accreted gas.
Results. We find 97 TDGCs with Mstellar > 5 × 10⁷M⊙ at redshift z = 0, corresponding to a co-moving number density of 2.3 × 10⁻⁴ h3 cMpc−3. The most massive TDGC has Mtotal = 3.1 × 10⁹ M⊙, comparable to that of the Large Magellanic Cloud. Tidal dwarf galaxy candidates are phase-space-correlated, reach high metallicities, and are typically younger than dark matter-rich dwarf galaxies.
Conclusions. We report for the first time the verification of the dual dwarf theorem in a self-consistent ΛCDM cosmological simulation. Simulated TDGCs and dark matter-dominated galaxies populate different regions in the radius–mass diagram in disagreement with observations of early-type galaxies. The dark matter-poor galaxies formed in Illustris-1 have comparable radii to observed dwarf galaxies and to TDGs formed in other galaxy-encounter simulations. In Illustris-1, only 0.17 percent of all selected galaxies with Mstellar = 5 × 10⁷−109 M⊙ are TDGCs or dark matter-poor dwarf galaxies. The occurrence of NGC 1052-DF2-type objects is discussed.
Key words: Galaxy: evolution / Galaxy: formation / Galaxy: abundances / galaxies: dwarf / dark matter
Movies are available at https://www.aanda.org
© ESO 2019
1. Introduction
The current standard model of cosmology is based on Einstein’s general relativity and requires the existence of cold dark matter (CDM) and a cosmological constant (Λ) in Einstein’s gravitational field equations. This ΛCDM model is a much-used description of the large-scale structure of the Universe, but fundamental problems, not only on galactic and galaxy-group scales, remain unsolved (e.g., Kroupa et al. 2010; Famaey & McGaugh 2012; Pawlowski et al. 2014; Kroupa 2012, 2015; Müller et al. 2018).
In the ΛCDM framework, the dual dwarf theorem has to be valid, according to which primordial and tidal dwarf galaxies (TDGs) must exist (Kroupa et al. 2010; Kroupa 2012). These two types of dwarf galaxies are characterized by different formation scenarios and differ mainly by their amounts of nonbaryonic dark matter.
Primordial galaxies are formed by the collapse of cold dark matter particles into halos. These structures become gravitationally bound and their deep gravitational potentials act on the baryonic matter, which streams and condenses into the halos. Thus, each primordial galaxy has to be dark matter-dominated (Bournaud & Duc 2006; Bournaud et al. 2008a; Ploeckinger et al. 2018).
In the hierarchical ΛCDM cosmology, the formation of dwarf galaxies can also be triggered by interactions of gas-rich galaxies. Galaxy encounters create tidal forces, which distort the galactic disk and cause the expulsion of gas and stars. The ejected stars and gas form tidal tails and arms, which surround and orbit around the host galaxy. Overdensities within tidal arms collapse and grow continually in mass (Barnes & Hernquist 1992; Bournaud & Duc 2006; Wetzstein et al. 2007; Bournaud et al. 2008b,a; Fouquet et al. 2012; Ploeckinger et al. 2014, 2015). These substructures reach stellar masses between 106 M⊙ and 109 M⊙ and are called TDGs. The high velocity dispersion of dark matter particles and the relatively shallow gravitational potential compared to their host galaxy prevent TDGs from capturing a significant amount of dark matter (Barnes & Hernquist 1992; Wetzstein et al. 2007; Bournaud et al. 2008b,a; Fouquet et al. 2012; Yang et al. 2014; Ploeckinger et al. 2018). Consequently, TDGs are not dark matter-dominated (Kroupa 2012). The small amount of dark matter also has implications for the survival time of TDGs. Since the dynamical friction force depends linearly on the density of the surrounding matter field and on the square of the mass of the dwarf galaxy, dark matter-dominated dwarf galaxies have a faster orbital decay with respect to their host galaxy (Angus et al. 2011). Therefore, in spite of the vicinity of TDGs to a larger host galaxy, it has been shown that especially low-mass TDGs have survival times comparable with the Hubble time (Kroupa 1997; Recchi et al. 2007; Casas et al. 2012; Ploeckinger et al. 2014, 2015). Observational constraints also show that TDGs survive for many gigayears (Duc et al. 2014). Ram-pressure stripping, interactions with their host galaxy, star formation, and evolution can deplete the gas reservoir of TDGs over cosmic time. Therefore, long-lived and gas-poor TDGs can potentially resemble dwarf elliptical galaxies (dEs; Dabringhausen & Kroupa 2013), and models suggest that the Large and Small Magellanic Clouds can also be TDGs (Fouquet et al. 2012). Estimates based on the merger tree in the CDM cosmological model have shown that TDGs can probably account for the observed number density of dEs (Okazaki & Taniguchi 2000). Because of the different formation scenarios, TDGs should typically be phase-space-correlated while primordial dwarfs should be spheroidally distributed in phase-space around their host (Kroupa et al. 2005; Pawlowski et al. 2011; Kroupa 2012; Pawlowski 2018). In the local Universe, phase-space correlations (a clustering of the direction of the orbital angular momentum vectors of dwarf galaxies) are observed around the majority of the nearest (≲4 Mpc) major galaxies, namely M 31 (Metz et al. 2007; Ibata et al. 2013), the Milky Way (Pawlowski & Kroupa 2013; Pawlowski 2018), and Centaurus A (Müller et al. 2018). Observing the phase-space distribution of distant satellite galaxies is currently very difficult, but a significant excess of observed co-rotating satellite pairs over that expected in a ΛCDM universe has been found (Ibata et al. 2014). Disks of satellites thus appear to be the rule rather than the exception. Phase-space-correlated satellite systems may however be destroyed if the host galaxy suffers another encounter. The observed high incidence of disk-of-satellite systems thus suggests that such encounters, let alone mergers, cannot be frequent.
Several observations of interacting galaxies have confirmed the existence of gaseous tidal tails, arms, and TDGs in the Universe (e.g., Mirabel et al. 1992; Duc et al. 2000, 2014; Mendes de Oliveira et al. 2001; Weilbacher et al. 2002; Martínez-Delgado et al. 2010; Kaviraj et al. 2012; Lee-Waddell et al. 2012). Since primordial dwarf galaxies form in the dark matter halo while TDGs form naked under their own self-gravity, the latter are expected to have systematically smaller radii if dark matter exists (Kroupa 2012). Dabringhausen & Kroupa (2013) studied the position of early-type galaxies and ultra compact dwarf galaxies (UCDs) in the radius–mass plane. These latter authors conclude that no significant difference in the radius–mass plane between observed dEs and observed TDGs can be found, which is in conflict with the current standard model of cosmology. However, the data they used are from different observations (Bender et al. 1992, 1993; Ferrarese et al. 2006; Misgeld et al. 2008, 2009; Misgeld & Hilker 2011; Miralles-Caballero et al. 2012). Moreover, UCDs and globular clusters (GCs) are clearly separated from dEs and TDGs in the radius–mass plane (Gilmore et al. 2007; Dabringhausen & Kroupa 2013). Until now, no self-consistent study exists of formation in a cosmological context quantifying the expected differences between TDGs and primordial dwarf galaxies.
The recently observed ultra-diffuse galaxy NGC 1052-DF2 with a dark matter mass 400 times smaller than theoretically expected based on an internal velocity dispersion of  km s−1, seems to support the existence of dark matter-free galaxies in our Universe (van Dokkum et al. 2018a). van Dokkum et al. (2018b) derived a revised internal velocity dispersion of
  km s−1 using ten GCs surrounding this galaxy. Danieli et al. (2019) measured a stellar velocity dispersion of
  km s−1 with the Keck Cosmic Web Imager (KCWI). The high relative velocity to the nearby massive elliptical galaxy NGC 1052 underpins the theory that this observed dark matter-lacking galaxy is indeed a TDG. However, Martin et al. (2018) revised the internal velocity of NGC 1052-DF2 to a 90 percent upper limit of 17.3 km s−1 corresponding to a mass-to-light ratio of M/LV < 8.1 Υ⊙, consistent with many Local Group dwarf galaxies. Emsellem et al. (2019) obtain M/LV in the range 3.5−3.9(±1.8) Υ⊙ using the Jeans model if located at D = 20 Mpc. This result would be close to the 2σ upper limit of the study from Martin et al. (2018). The lack of dark matter and the unusual high luminosity of ten globular cluster-like objects surrounding this galaxy only holds if NGC 1052-DF2 is located at a distance of around 20 Mpc (van Dokkum et al. 2018a). Danieli et al. (2019) confirmed that DF2 is dark matter deficient and concluded that it is an outlier to dwarf galaxies of the Local Group. In contrast to that, Trujillo et al. (2019) derived a revised distance to NGC 1052-DF2 of D = 13.0 ± 0.4 Mpc based on five redshift-independent measurements including the tip of the red giant branch and the surface brightness fluctuation method. Thus, NGC 1052-DF2 would be a dwarf galaxy with an ordinary dark matter content Mhalo/Mstellar > 20 and a normal globular cluster population. Meanwhile, van Dokkum et al. (2019) reported that the dwarf galaxy NGC 1052-DF4 also lacks dark matter and is found at a distance of D = 20 Mpc.
In this paper we investigate dark matter-free galaxies in the Illustris simulation, which is currently one of the most advanced cosmological computations. We analyze their physical properties and qualitatively estimate the probability of finding NGC 1052-DF2-like galaxies in a ΛCDM Universe at redshift z = 0 assuming that this observed ultra-diffuse galaxy is indeed free of dark matter. High-resolution runs of modern cosmological hydrodynamical simulations such as EAGLE (McAlpine et al. 2016) and Illustris (Vogelsberger et al. 2014a) allow the analysis of TDGs in a self-consistent cosmological ΛCDM framework. The formation of TDGs in the EAGLE simulation has been studied by Ploeckinger et al. (2018). The formation of TDGs in individual galaxy–galaxy encounters in the ΛCDM context is well established (Wetzstein et al. 2007; Bournaud et al. 2008b,a).
The layout of the paper is as follows. In Sect. 2, we introduce the Illustris simulation and the selection criteria for dark matter-free galaxies. Section 3 presents the results, in particular we study different physical properties of dark matter-free galaxies and we plot the radius–mass relation. The results are compared with observational data. The evolution of dark matter-free galaxies over cosmic time is shown. The results are discussed in Sect. 4. We finally summarize and conclude with Sect. 5. Throughout this paper co-moving distances are marked with the prefix “c” (i.e., cpc, ckpc, cMpc). We note that at redshift z = 0, the scale factor a(t) becomes unity and by definition proper and co-moving distances become the same.
2. Methods
We use the cosmological hydrodynamical Illustris simulation to study the evolution and physical properties of dark matter-free galaxies. This section introduces the Illustris project by describing the cosmological and numerical parameters and the implemented physics of galaxy-formation models. The selection criteria for primordial and TDG candidates (TDGCs) are stated. Movies on the formation and evolution of TDGCs are attached in the supplementary material.
2.1. Illustris simulation
The Illustris simulation project1 is a set of cosmological hydrodynamical and dark matter-only simulations at different resolutions performed with the moving-mesh code AREPO (Springel 2010). The simulations assume a flat ΛCDM cosmology based on the Wilkinson Microwave Anisotropy Probe (WMAP)-9 measurements with the values of the cosmological parameters at the present time being Ωm, 0 = 0.2726, ΩΛ, 0 = 0.7274, Ωb, 0 = 0.0456, σ8 = 0.809, ns = 0.963, and H0 = 100 h−1 km s−1 Mpc−1 with h = 0.704 (Hinshaw et al. 2013). The main simulations cover a co-moving volume of (75 h−1 cMpc)3 and start at redshift z = 127. The evolution of dark matter particles, gas cells, passive gas tracers, stars and stellar wind particles, and supermassive black holes (SMBHs) are followed up to redshift z = 0 (Nelson et al. 2015).
Dark matter halos are identified with the standard friends-of-friends (FOF) algorithm (Davis et al. 1985) with a linking length of 0.2 times the mean particle separation. The minimum particle number of each halo is 32. Subhalos within halos are identified with the Subfind algorithm (Springel et al. 2001; Dolag et al. 2009) and have a unique identification number (ID) within each snapshot. The particle with the minimum gravitational potential energy defines the spatial position of the subhalo (halo) within the periodic box, and the total mass of a subhalo (halo) is defined as the sum of the individual masses of particles (cells) connected to the subhalo (halo). The physical properties of FOF and Subfind objects for each snapshot are listed in the group catalogs, which can be downloaded from the Illustris webpage (Vogelsberger et al. 2014a; Genel et al. 2014).
Throughout this paper, we use the highest-resolution run (Illustris-1) with a dark matter mass resolution of 6.26 × 10⁶ M⊙ (the mass of one particle) and an initial baryonic mass resolution of 1.26 × 10⁶ M⊙ (the mass of one particle). The gravitational softening lengths of dark matter and baryonic particles are 1420 cpc and 710 cpc in co-moving length scale, respectively (Vogelsberger et al. 2014b; Nelson et al. 2015).
Torrey et al. (2015) provide images for subhalos with Mstellar > 1010 M⊙ at redshift z = 0, which are produced with the radiative transfer code SUNRISE (Jonsson 2006; Jonsson et al. 2010). These galaxy PNG images and fits files can be downloaded with the web-based search tool Illustris Galaxy Observatory from the Illustris webpage2.
In addition, the Illustris team supplies an online tool called “The Illustris Explorer” which visualizes a slice with a depth of 15 h−1 Mpc in projection of the Illustris-1 simulation box at redshift z = 0. This deep zoom map interface allows one to visualize, for example, the gas temperatures and densities, the dark matter densities, and the stellar luminosities in Johnson/SDSS filters3.
2.2. Galaxy-formation models
A detailed galaxy formation model for simulating astrophysical processes is implemented in the Illustris simulation. The model includes a stochastic star formation description in dense gas, stellar evolution with mass loss and chemical enrichment, cooling and heating mechanisms of the ISM, AGN feedback, and the growth and evolution of SMBHs. The implemented physical models and a comparison with observations can be found in detail in Vogelsberger et al. (2013) and Torrey et al. (2014). We point out that in the Illustris simulation the mass loading and wind velocity are scaled with the local dark matter velocity dispersion (Vogelsberger et al. 2013). This is in contradiction with the standard view of cold dark matter theory, which assumes weak interactions between nonbaryonic and baryonic matter. With this recipe, more massive halos produce stronger baryonic feedback.
2.3. Selection criteria for dark matter-containing and dark matter-free stellar objects
We select two different kinds of stellar objects based on their baryonic and dark matter masses. We identify subhalos with a stellar mass Mstellar > 0 and a nonzero dark matter mass and refer to them as dark matter-containing (DMC) stellar objects. Dark matter-free (DMF) stellar objects are defined as subhalos with a stellar mass Mstellar > 0 and a dark matter mass of Mdm = 0. These selection criteria give us 304 302 DMC and 3484 DMF stellar objects at redshift z = 0.
2.4. Selection criteria for DMC dwarf galaxies and TDG candidates
The selection criteria stated above for DMF and DMC stellar objects are independent of the environment. In fact, DMF and DMC stellar objects can be substructures which are embedded in the galactic disk of their host galaxies rather than real physical galaxies (Ploeckinger et al. 2018; Graus et al. 2018). Therefore we divide stellar objects based on the separation, s, to their next host galaxy4. A host galaxy is defined as the closest subhalo with Mstellar > 109 M⊙ and a stellar mass at least ten times larger than the considered stellar object. A stellar object with a separation to its host halo smaller than or equal to ten times the stellar half-mass radius of the host ( ) is defined as a substructure within a galaxy such as a massive GC or a numerical artifact. Dark matter-free or dark matter-containing stellar objects beyond the distance criterion of
  and within
  are identified as TDGCs or dark matter-containing dwarf galaxies (DMC DGs), respectively. We label these dark matter-free objects explicitly as TDG “candidates” in order to emphasis that apart from galactic interactions (tidal forces) such objects can also be formed in other scenarios, such as for example ram-pressure disruption or perhaps cold accretion.
The minimum separation criterion is motivated by the fraction of the separation between the Milky Way (MW) galaxy and the Large Magellanic Cloud (LMC; sMW−LMC ≈ 50 kpc, Pietrzyński et al. 2013) to the 3D deprojected half-light radius of the MW ( kpc, Koda et al. 2015; Wolf et al. 2010). A maximum separation limit is used because the catalog of observed early-type galaxies from Dabringhausen & Fellhauer (2016) only includes dwarf galaxies which are found in dense galactic regions. Ignoring this criterion the most distant TDGC has a separation of 987 kpc to its host and was probably expelled by a galaxy–galaxy interaction.
Furthermore, we restrict our main analysis to TDGCs with Mstellar > 5 × 10⁷ M⊙ (hereafter TDGC sample A) and DMC DGs within the 5 × 10⁷−109 M⊙ stellar mass regime. The minimum stellar mass ensures that these subhalos are resolved with at least 50 stellar particles. Using these selection criteria we find 97 TDGCs corresponding to a co-moving number density of 2.3 × 10⁻⁴h3 cMpc−3 at redshift z = 0.
In order to study the separation of TDGCs to their host galaxies we introduce the 3D distance-criterion parameter Dcr,
 (1)
(1)
where sTDGC−host is the 3D separation between the TDGC and its host galaxy, and  is the stellar half-mass radius of the host galaxy as already defined in the text above. The distribution of the Dcr parameter for TDGCs of sample A is shown in Fig. 1. This plot and Table 1 point out that most of the TDGCs are located in the vicinity of a larger galaxy, which is theoretically expected from the formation theory of TDGs. In contrast to that, a significant number of DMC objects are also beyond the chosen maximum separation limit of
  (i.e.,
  ) as summarized in Table 2. DMC DGs with less dark matter than baryonic mass are found mostly close to their host galaxies suggesting that TDGCs can in principle capture dark matter particles. About 0.35 percent of all galaxies with Mstellar = 5 × 10⁷−109 M⊙ and within the applied distance criteria are TDGCs or DM-poor DGs. This reduces to 0.17 percent when ignoring the maximum separation limit on the samples.
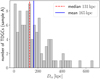 |
Fig. 1. Distribution of the 3D distance-criterion parameter, Dcr (Eq. (1)), for TDGCs of sample A at redshift z = 0. The dashed red and the solid blue lines highlight the median and the mean of the distribution, respectively. |
Number of TDGCs for different selection criteria identified at redshift z = 0.
Number of DMC DGs for different selection criteria identified at redshift z = 0.
The criteria applied here for TDGCs are independent of the gas half-mass radius of the host galaxy,  , in contrast to Ploeckinger et al. (2018). In particular, Ploeckinger et al. (2018) consider TDG candidates with Mgas > 107 M⊙ and Mstellar > 2.26 × 10⁵ M⊙ which are located beyond
  and within a proper radius of 200 kpc or
  (i.e., smax = min [200 kpc,
  ]). The host galaxy is defined as a galaxy with Mgas > 109 M⊙ or a galaxy that has a gas content at least ten times higher than the considered TDGC. We therefore define another sample, TDGCs sample B, which includes TDGCs with Mgas > 5 × 10⁷ M⊙ and at least one stellar particle (see Table 1). The different described samples and where they are described are summarized in Table 3.
Different defined samples and where we discuss them.
2.5. Formation scenarios of TDGCs
In order to confirm the tidal nature of TDGCs, we present a series of snapshots of the formation and evolution of some DM-poor DGs and TDGCs by plotting 2D histograms of the gas distribution at different time steps. The corresponding movies can be found as supplementary material. TDGCs and DM-poor objects are identified at redshift z = 0 and are then backtraced by following their individual stellar particle IDs found in the Subfind subhalos at different time steps (excepted are the subhalos of their potentially host galaxies). The backtracing algorithm developed here stops when stellar particles can no longer be detected in a potential progenitor of the considered object.
First, we study in Fig. 2a the evolution of the host galaxy with the identification number ID 404871 at redshift z = 0 (see also Fig. A.1 and the movie “ID404871.mp4”) by following its main progenitor branch (Rodriguez-Gomez et al. 2015). This galaxy hosts a TDGC in a gaseous tidal arm, which was formed by a close encounter with another massive galaxy around 1.6 Gyr ago. A similar formation process of the TDGCs ID 78410 and ID 74010 (both of sample A) is seen in Fig. 2b. A galaxy merger at a lookback time of around 1.9 Gyr creates tidal debris. The first stellar particles in the subhalos of both identified TDGCs at z = 0 appear at about 0.1 Gyr (ID 74010) and 0.5 Gyr (ID 74810) after the merger, allowing us to estimate their ages to be about 1.8 Gyr and 1.4 Gyr, respectively. At present, ID 74810 and ID 74010 have 63 and 200 stellar particles, respectively. ID 74010 has similar properties to the observed NGC 1052-DF2 galaxy by van Dokkum et al. (2018a) (see also Sect. 3.2 and the movies “ID73663.mp4” and “ID73663_zoom.mp4”). Figure 2c shows the host galaxy ID 150872 with the TDGCs of sample B IDs 151014, 151271, 151299, 151878, and 151132, which were formed again through a galaxy–galaxy encounter around 1.9 Gyr ago (see also the movie “ID150872.mp4”).
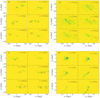 |
Fig. 2. Time evolution of the gas distribution weighted by the logarithm of the gas cell mass and with position relative to the subhalo center of host galaxies. The TDGC and DM-poor objects identified at z = 0 are being backtraced by their individual stellar particle IDs and are highlighted in the panels until stellar particles can no longer be found in their subhalo. The lookback time of the corresponding snapshot is given in the upper-right corner of the panels. a) Host galaxy ID 404871 with the TDGC of sample B ID 404882 (red circle), DM-poor substructure ID 404873 (blue square), and the subhalo ID 404879 (green down-pointing triangle) being identified at z = 0 (see also Fig. A.1 and the movie “ID404871.mp4” in the supplementary information). The subhalo ID 404879 has Mstellar = 2.2 × 10⁷ M⊙ and thus does not fulfill our criteria for a DM-poor DG (see Table 2). A close encounter of two galaxies happens at a lookback time of about 1.6 Gyr creating a large extended tidal arm in which these dark matter-lacking subhalos are identified. b) Host galaxy ID 73663 with the TDGCs ID 74010 (DF2-like; red circle) and ID 74810 (green down-pointing triangle) being identified at z = 0 (both of sample A; see also Sect. 3.2 and the movies “ID73663.mp4” and “ID73663_zoom.mp4”). A galaxy merger occurs at a lookback time of around 1.9 Gyr. c) Host galaxy ID 150872 with the TDGCs of sample B ID 151014 (red circle), ID 151271 (blue square), ID 151299 (black up-pointing triangle), ID 151878 (magenta diamond), and ID 151332 (green down-pointing triangle) formed by an interaction around 1.9 Gyr ago (see the movie “ID150872.mp4”). d) Host galaxy ID 138 with the DMF substructures ID 878 (red circle) and ID 1683 (green down-pointing triangle) being identified at z = 0 (see also Fig. A.1 and the movies “ID138.mp4”). These are not TDGs because they form from gas ram-pressure stripped from the host ID 138. Ram-pressure stripping can be observed at a lookback time ≲1 Gyr. |
Finally, by tracing the host galaxy ID 138 back in time, a different formation process of dark matter-lacking subhalos compared to the above discussed examples can be observed in Fig. 2d (see also Fig. A.1 and the movie “ID138.mp4”). At a lookback time ≲1 Gyr this galaxy undergoes ram-pressure stripping. This is an example of how baryon-dominated dwarf galaxies can form from material stripped from a host galaxy through ram-pressure (the “type B dwarfs” of Kroupa 2012 and “fireballs” observed by Yoshida et al. 2008; Yagi et al. 2010). Recent observations have shown that enhanced star formation can appear in the ram-pressure stripped tails of jellyfish galaxies (Vulcani et al. 2018). The DMF subhalos around the host galaxy ID 138 have Mstellar > 5 × 10⁷ M⊙ but are located within  and are defined as DMF substructures of their host and therefore are not counted as TDGCs in this work. This example also demonstrates that we have applied a very stringent minimum separation criterion in order to avoid a misidentification of DMF substructures. In other words, we expect to have several false negatives but accept this in order to minimize false positives.
In Fig. 3 we address the gas, stellar, and dark matter mass evolution of the objects discussed here. Each of these subhalos has at most one dark matter particle at the time when their first stellar particle was identified. Given the high velocity dispersion of dark matter particles, their presence in the objects could simply be transients detected by the Subfind algorithm. Moreover, the objects are always baryon-dominated.
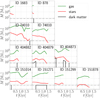 |
Fig. 3. Gas (green), stellar (red), and dark matter (black) mass evolution of TDGCs and DM-poor objects shown in Fig. 2 starting from the first time step at which the first stellar particles in their subhalos appeared. Their ID numbers are given in the upper-right corner of the panels and the discussed subhalos of each row belong to the same host galaxy. The subhalo ID 404879 has Mstellar = 2.2 × 10⁷ M⊙, Mgas = 3.0 × 10⁸ M⊙, and Mdm = 6.3 × 10⁶ M⊙ and is thus not included in the main sample of DMC (-poor) DGs (see Table 2). The dashed and long-dashed horizontal lines indicate the initial baryonic (1.26 × 10⁶ M⊙) and dark matter mass (6.26 × 10⁶ M⊙) of a particle. The dark matter content is short lived and is due to individual dark matter particles crossing the objects. |
2.6. The orbital angular momentum of dwarf galaxies
The different formation scenarios of galaxies with and without dark matter cause differences in their phase-space distributions. In particular, TDGs can be significantly correlated in phase space (Kroupa 2012; Ploeckinger et al. 2015). The specific orbital angular momenta of dwarf galaxies with respect to their host galaxies are calculated by,
 (2)
(2)
where rDG, and rhost, and vDG, and vhost are the position and velocity vectors of the dwarf galaxy and host galaxy, respectively.
The degree of the phase-space correlation of a system with more than two TDGCs or DMC DGs is then determined by
 (3)
(3)
with var(lorbit, x), var(lorbit, y), and var(lorbit, z) being the variances of the x, y, and z components of the normalized specific orbital angular momenta given by Eq. (2); for example,
 (4)
(4)
where N is the number of dwarf galaxies around a host galaxy and l̅orbit,x is the mean of all x-components of the normalized specific orbital angular momenta.
This method is independent of the coordinate system. In the case of a purely spherical distribution of the angular momenta the degree of the phase-space correlation becomes σorbit = 1.
2.7. Dispersion- and rotation-dominated galaxies
Determining the morphology of simulated galaxies and the comparison thereof with observations is a nontrivial task. Here, we use the κrot morphological parameter in order to separate them in dispersion- and rotation-dominated systems, which was already studied by Sales et al. (2012) and Rodriguez-Gomez et al. (2017). The κrot parameter is defined as the fraction of the rotational energy, Krot, to the kinetic energy, K, of all stellar particles in the considered subhalo. The morphological parameter, κrot, is
 (5)
(5)
where ĥ is a unit vector proportional to the total stellar angular momentum of the galactic system, hi is the specific angular momentum vector, mi is the mass, and Ri is the projected radius of the ith stellar particle. The positions and velocities of the stellar particles are calculated with respect to the center of mass of the subhalo. According to Eq. (5), the κrot parameter can range between 0 and 1 meaning that in the latter case all stellar particles move on circular orbits with respect to the total stellar angular momentum. Subhalos with κrot smaller or larger than 0.5 are dispersion- or rotation-dominated systems, respectively. Images of the most massive dispersion- and rotation-dominated Illustris galaxies identified at redshift z = 0 are presented in Fig. 4. An interesting discussion about the properties of the κrot morphological parameter for dynamical systems is found in Appendix A of Rodriguez-Gomez et al. (2017).
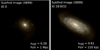 |
Fig. 4. Examples of Subfind Starburst 99 (SB99) images of the most massive dispersion- (left; ID 0, κrot = 0.28, Mstellar + gas = 2.9 × 10¹³ M⊙, Mdm = 2.9 × 10¹⁴ M⊙) and most massive rotation-dominated (right; ID 283832, κrot = 0.61, Mstellar + gas = 4.9 × 10¹¹ M⊙, Mdm = 6.7 × 10¹² M⊙) galaxy in the Illustris-1 simulation at redshift z = 0. The image field of view (FoV) is ten times the stellar half-mass radius, R0.5 stellar, of the shown galaxy. Credit: Illustris Galaxy Observatory http://www.illustris-project.org/galaxy_obs/ [25.08.2018]. |
3. Results
We present the physical properties of TDGCs and DMC DGs and their positions in the radius-mass plane at redshift z = 0. The results are compared with observational data from Dabringhausen & Fellhauer (2016) and Mieske et al. (2008, 2013). The metallicities of TDGCs and DMC DGs are studied in Appendix B. In addition, a discussion about the internal structures and kinematics of TDGCs including a σ-clipping scheme as a 6D phase-space halo finder applied on gas-free Subfind TDGCs of sample A can be found in Appendix C where the gravitationally bound nature of these simulated objects is also discussed.
3.1. Phase-space correlation of TDGCs and DMC DGs
We quantify the degree of the phase-space correlation, σorbit (Eq. (3)), for all galactic systems with more than one TDGC or DMC DG. Considering all TDGCs with Mstellar > 5 × 10⁷ M⊙ (sample A) gives only five galactic systems that host more than one such TDGC. Therefore, we determine the phase-space correlation for both samples A and B. The results are listed in Table 4 and the distributions of the degree of the phase-space correlation, σorbit, for TDGCs and DMC DGs are shown in Fig. 5. Tidal dwarf galaxy candidates from sample B are significantly more phase-space-correlated than DMC DGs. These results are discussed in Sect. 4.1.
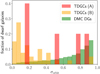 |
Fig. 5. Degree of the phase-space correlation, σorbit (Eq. (3)), for TDGCs of sample A (red) and sample B (orange) and DMC DGs (green). The histograms have a bin width of Δσorbit = 0.05. |
3.2. NGC 1052-DF2-like galaxies in the Illustris-1 simulation
The ultra-diffuse galaxy NGC 1052-DF2 has Mstellar ≈ 2 × 10⁸ M⊙ with a dark matter mass 400 times smaller than theoretically predicted and has an effective radius along the major axis of Re = 2.2 kpc, assuming it is at a distance of 20 Mpc (van Dokkum et al. 2018a). Wolf et al. (2010) derived a scaling relation between the 2D projected half-light radius, Re, and the 3D deprojected half-light radius, R0.5 light, for stellar systems. These latter authors showed that the relation,
 (6)
(6)
is accurate for most surface brightness profiles of spherical stellar systems with Sérsic indices in the range 0.10 ≤ n−1 ≤ 2.0 (see Appendix B in Wolf et al. 2010). Applying this scaling relation to the effective radius of NGC 1052-DF2 and taking into account its axis ratio being 0.85 gives a 3D stellar half-light radius of 2.7 kpc.
Using the Illustris-1 simulation we found no single TDGC fulfilling a minimum stellar mass criterion of 2 × 10⁸ M⊙ and a minimum stellar half-mass radius criterion of 2.7 kpc at the same time. Choosing instead 20 percent reduced lower limits of Mstellar = 0.8 × (2×108) M⊙ and R0.5 stellar = 0.8 × 2.7 kpc gives only one TDGC at redshift z = 0 (ID 74010). The probability of finding such a NGC 1502-DF2-like galaxy among all TDGCs of sample A is around 1.0 × 10⁻². In particular, this TDGC has R0.5 stellar = 2.4 kpc, Mstellar = 1.9 × 10⁸ M⊙, Mgas = 1.5 × 10⁹ M⊙, and κrot = 0.46. The separation to its host galaxy (ID 73679) is about 219 kpc, which is roughly consistent with the observed NGC 1052-DF2 galaxy found in the vicinity of the massive elliptical galaxy NGC 10525. The simulated host galaxy is dispersion-dominated and has Mstellar = 6.4 × 10¹⁰ M⊙ and Mdm = 4.4 × 10¹¹ M⊙. Interestingly, this galaxy hosts a second gas-rich TDGC (ID 74810) at 150 kpc. As seen in a series of snapshots in Sect. 2.5 (see also the movies “ID73663.mp4” and “ID73663_zoom.mp4”) these TDGCs were formed from the gas expelled by tidal forces from massive interacting galaxies.
Summing up, there is no TDGC in the Illustris-1 simulations at redshift z = 0 which has a stellar mass and a stellar-half mass radius equal to or larger than the observed NGC 1052-DF2 at the same time. However, relaxing the lower mass limits of the selection criteria by 20 and 40 percent yields one and six TDGCs, respectively. But invoking the condition Mgas = 0 because NGC 1052-DF2 is gas-free (Chowdhury 2019; Sardone et al. 2019) and choosing lower limits of Mstellar = 0.8 × (2×108) M⊙ and R0.5 stellar = 0.8 × 2.7 kpc lead to no similar dwarf galaxies existing in the Illustris-1 simulation. A parameter study of different selection criteria is given in Table 5. Regardless of the exact definition, finding a NGC 1052-DF2-like galaxy at redshift z = 0 in the Illustris-1 simulation is extremely rare. This analysis does not include a comparison of the peculiar velocity of the observed NGC 1052-DF2 with simulated analogs.
Probability of finding a NGC 1052-DF2-like galaxy in the Illustris-1 simulation at redshift z = 0.
However, the observed velocity dispersion is rather uncertain and allows for a significant dark matter content (Martin et al. 2018). In addition, Trujillo et al. (2019) concluded that NGC 1052-DF2 is at a distance of 13.0 ± 0.4 Mpc from Earth and is not an outlier to dwarf galaxies of the Local Group6.
3.3. Physical properties of TDGCs and DMC DGs
Figure 6 shows the stellar (top) and total (bottom) mass distributions of TDGCs with Mstellar > 5 × 10⁷ M⊙ (sample A). As expected, TDGCs have typically small masses whereby the most massive TDGC has Mtotal = 3.1 × 10⁹ M⊙. In high-resolution simulations of merging galaxies with dark matter, the most massive TDGs have been reported to have baryonic masses in the range of 108 M⊙–109 M⊙ such that also the Large and Small Magellanic Clouds can be TDGs (Bournaud et al. 2008b,a; Fouquet et al. 2012).
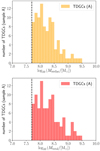 |
Fig. 6. Stellar mass, Mstellar, (top) and total mass, Mtotal, (bottom) distributions of TDGCs (sample A) at redshift z = 0. The dashed vertical line illustrates the minimum stellar mass criterion of 5 × 10⁷ M⊙. The histograms have a bin width of log10(ΔMstellar/[M⊙]) = 0.10 and log10(ΔMtotal/[M⊙]) = 0.10. |
The applied selection criteria for TDGCs of sample A identify dwarf galaxies with low amounts of gas. In particular, around 89 percent of all TDGCs are completely gas-free and also have no star formation. If we apply similar selection criteria for TDGCs as in the work of Ploeckinger et al. (2018) (sample B), we obtain many more TDGCs than in sample A (see Table 1)7. This can be understood by the formation scenario of TDGCs, which are formed in gas-rich tidal tails expelled from their host galaxies triggered by galactic interactions. The median (mean) of the stellar mass of TDGCs belonging to sample B is about 1.7 (5.6) higher than the median (mean) of the TDGCs from Ploeckinger et al. (2018). Furthermore, we report a median (mean) of the gas mass that is 2.4 (1.6) times higher than the sample of Ploeckinger et al. (2018). These discrepancies could be caused by the different selection criteria for TDGCs and the use of different cosmological simulations. Ploeckinger et al. (2018) set a minimum gas mass limit of 107 M⊙ because of the higher resolution of baryonic and dark matter particles in the EAGLE simulations they used compared to the Illustris-1 run employed here. Moreover, Ploeckinger et al. (2018) select TDGCs within z ≤ 2.0.
The age of dwarf galaxies is estimated here by the formation time of the oldest stellar particle within a subhalo identified at redshift z = 0. The derived age distribution of different dwarf galaxy samples are studied in Fig. 7 and analyzed in more detail in Table 6. The mean age of DM-rich DGs is 12.7 Gyr, which is significantly higher than for DM-poor DGs (8.9 Gyr) and TDGCs and underlines that DM-rich DGs are formed in early stages of the Universe. The mean ages of the TDGCs of samples A and B are 7.6 Gyr and 1.5 Gyr, respectively. Therefore TDGCs with a vanishing gas content are older objects, which have already consumed or lost their gas reservoir via ram-pressure stripping and interactions.
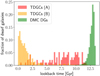 |
Fig. 7. Distribution of the age of the oldest stellar particles within dwarf galaxies identified at redshift z = 0. The histograms have a bin width of Δt = 0.2 Gyr. The statistics of the distributions shown here are listed in Table 6. |
Physical properties of DMC DG and TDGC samples at redshift z = 0.
The distribution of the κrot morphology parameter of TDGCs (sample A) and DMC DGs is presented in Fig. 8, which states that around 94 percent of all TDGCs with Mstellar > 5 × 10⁷ M⊙ (sample A) are dispersion-dominated (κrot < 0.5) at redshift z = 0. The high fraction of dispersion-dominated TDGCs is unexpected, because high-resolution simulations of galaxy encounters by Bournaud et al. (2008b,a) have shown that the most massive stellar TDGs in the mass range of 108−109 M⊙ are dominated by rotation. However, the TDGs in their simulations are young and gas-rich while most of the observed satellite galaxies surrounding the MW are old and typically dispersion-dominated. The simulations by Bournaud et al. (2008b,a) suggest that feedback processes such as SN explosions transform them into gas-poor DGs which suffer from a loss of angular momentum. Therefore, TDGs can be transformed into dwarf spheroidal satellite galaxies within a Hubble time (Metz & Kroupa 2007; Dabringhausen & Kroupa 2013). The medians and means of the distribution of the κrot parameter for simulated TDGCs (sample A) and DMC DGs are almost the same (see Table 6). Nevertheless, calculating the κrot parameter for objects with a small number of stellar particles is insecure and the present results should be treated with caution.
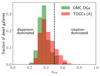 |
Fig. 8. Distribution of the κrot morphological parameter for DMC DGs (green) and TDGCs (red) with Mstellar > 5 × 10⁷ M⊙ (sample A). DMC DGs and TDGCs are divided into rotation- and dispersion-dominated objects at κrot = 0.5 (dashed black line). The histograms have a bin width of Δκrot = 0.05. |
Finally, we study the 1D velocity dispersion of simulated dwarf galaxies which is calculated by all particles (cells) belonging to the considered subhalo. The medians and means of the 1D velocity dispersion for different dwarf galaxy samples reveal information about the properties of baryonic and dark matter particles. Dwarf galaxies with a small amount of dark matter have significantly lower velocity dispersions than dark matter-dominated objects, as theoretically expected. The medians of the 1D velocity dispersion of simulated TDGCs (sample A) and DM-poor DGs are 7.8 km s−1 and 9.7 km s−1, respectively. The intrinsic velocity dispersion of NGC 1052-DF2 derived by observing ten GCs is  km s−1 (van Dokkum et al. 2018b).
The stellar and gas metallicities of TDGCs belonging to sample A are shown and discussed in Appendix B and in Sect. 4.2, respectively. The physical properties of different TDGCs and DMC DGs samples at redshift z = 0 are summarized in Table 6.
The host halos of TDGCs (sample A) are studied in Fig. 9, which shows the total host halo mass distribution of host halos which contain at least one DMC DG (top; green) and/ or at least one TDGC (top; red) at redshift z = 0. Most of the TDGCs appear in host halos with a total halo mass range of  , but a small number of TDGCs can also be found in the 7.8 × 10⁷ − 2.7 × 10⁸ M⊙ total halo mass regime. In fact, 97 TDGCs belong to 42 different host halos and the most massive host halo (
 ) possesses the highest number of TDGCs (nTDGCs = 12). Only a very small number of TDGCs are found in low-mass host halos. The number of TDGCs per number of host halos within a given mass bin is shown in Fig. 9 (bottom). The number of TDGCs per host halo increases with the total host halo mass. The distribution is fitted with an exponential function of the form,
![Mathematical equation: $$ \begin{aligned} \tilde{\rho }_{\rm {TDGCs}} \bigg ( \log _{10} \bigg ( \frac{M_{\rm {total}}^{\mathrm{halo} }}{{M}{_{\odot }}} \bigg ) \bigg ) = a + b ^{\bigg [ \log _{10} \bigg ( \frac{M_{\rm {total}}^{\mathrm{halo} }}{{M}{_{\odot }}} \bigg ) - c \bigg ]}, \end{aligned} $$](/articles/aa/full_html/2019/06/aa33771-18/aa33771-18-eq35.gif) (7)
(7)
with the fitting parameters
where  is the number of TDGCs per host halo with a mass in the range
  to
to  .
.
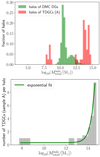 |
Fig. 9. Top: total host halo mass, |

![Mathematical equation: $ \log_{10}(\Delta M_\mathrm{{total}}^{\mathrm{halo}}/[{M}{_{\odot}}]) = 0.25 $](/articles/aa/full_html/2019/06/aa33771-18/aa33771-18-eq41.gif)
The higher probability for galactic interactions and mergers in massive host halos can explain the increase of TDGCs per host halo with total host halo mass, consistent with these dark matter-free galaxies indeed being TDGs. This is qualitatively consistent with the analysis by Okazaki & Taniguchi (2000).
3.4. Radius-mass relation
According to the dual dwarf theorem, two types of dwarf galaxies must exist and they can be distinguished based on their stellar masses and radii (Kroupa et al. 2010; Kroupa 2012; Dabringhausen & Kroupa 2013). In order to verify these predictions in the ΛCDM cosmological Illustris simulation, we show first the positions of DMC and DMF stellar objects in the radius–mass plane in Fig. 10. Due to the cell resolution of the Illustris-1 simulation, a significant number of DMF stellar objects have a stellar half-mass radius below the resolution limit and in this sense are consistent with a radius equal to zero8. These 1240 subhalos are removed from the diagram; they could be UCDs (Hilker et al. 2007; Baumgardt & Mieske 2008). Dark matter-free and DMC stellar objects are clearly distributed differently in the radius–mass diagram. In general, DMF stellar objects have smaller stellar half-mass radii than most of the galaxies with a nonzero dark matter component, confirming the prediction by Kroupa (2012). However, a few objects with a nonvanishing dark matter mass and with stellar masses between 107 M⊙ and 1010 M⊙ can also be found in the region of DMF stellar objects. The properties of these DMC stellar objects are discussed in Fig. 11, wherein the populations of dark matter-poor and dark matter-rich DMC stellar objects in the radius–mass plane are plotted. Most DMC stellar objects in the region of DMF stellar objects have a dark matter-to-baryonic mass ratio Mdm/Mbaryonic < 1 and are thus dark matter-poor.
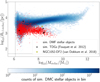 |
Fig. 10. Proper radius containing half of the stellar mass, R0.5 stellar, as a function of the stellar mass, Mstellar, of simulated stellar objects at redshift z = 0. Blue bins are DMC and red dots are DMF stellar objects. The stellar masses and the total half-mass radii of simulated TDGs by Fouquet et al. (2012) are shown as black crosses. A few DMC stellar objects can also be found in the regions of DMF stellar objects. The properties of these DMC stellar objects are studied in Fig. 11. The dashed vertical and horizontal lines indicate the initial baryonic matter mass of a particle (1.26 × 10⁶ M⊙) and the smallest fiducial cell size (48 pc) of the Illustris-1 run, respectively. Subhalos with a stellar half-mass radius below the cell resolution are not shown in the plots. The yellow star shows the position of NGC 1052-DF2 with Mstellar = 2 × 10⁸ M⊙ and a 3D deprojected half-light radius of 2.7 kpc (van Dokkum et al. 2018a). |
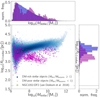 |
Fig. 11. Proper radius containing half of the stellar mass, R0.5 stellar, as a function of the stellar mass, Mstellar, of simulated DMC stellar objects at redshift z = 0. Dark matter-containing stellar objects are separated in dark matter-rich (Mdm/Mbaryonic ≥ 1; blue bins) and dark matter-poor (Mdm/Mbaryonic < 1; purple crosses) types. The yellow star shows the position of NGC 1052-DF2 with Mstellar = 2 × 10⁸ M⊙ and a 3D deprojected half-light radius of 2.7 kpc (van Dokkum et al. 2018a). The dashed vertical and horizontal lines indicate the initial baryonic matter mass of a particle (1.26 × 10⁶ M⊙) and the smallest fiducial cell size (48 pc). Subhalos with a stellar half-mass radius below the cell resolution are not shown in the plots. The histograms are normalized such that the total area is equal to 1.0 and such that they have bin widths of log10(ΔMstellar/[M⊙]) = 0.10 and log10(ΔR0.5 stellar/[pc]) = 0.10. |
Some of the stellar objects shown here are substructures with a separation to their host galaxies smaller than  according to Tables 1 and 2. Therefore, we discuss the radius–mass diagram for TDGCs of sample A9 and DMC DGs in Fig. 12, which shows for the first time that the dual dwarf theorem is valid in a self-consistent ΛCDM simulation. It is worth noting that the independent simulations of galaxy-galaxy encounters (in a dark matter Universe) by Fouquet et al. (2012) of TDG formation show these to have radii consistent with the DMF stellar objects and TDGCs in the Illustris simulation (upper panel of Fig. 12).
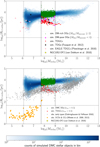 |
Fig. 12. Top: proper radius containing half of the stellar mass, R0.5 stellar, as a function of the stellar mass, Mstellar, of simulated stellar objects at redshift z = 0. Blue bins are DMC stellar objects, green dots are DM-rich DGs (Mdm/Mbaryonic ≥ 1), magenta squares are DM-poor DGs (Mdm/Mbaryonic < 1), and red triangles are TDGCs. The stellar masses and the total half-mass radii of simulated TDGs by Fouquet et al. (2012) are shown as black crosses. Pink circles are simulated TDGCs identified in the EAGLE simulations by Ploeckinger et al. (2018). Bottom: masses and radii of the simulated stellar objects compared with the 3D deprojected half-light radii of observed galaxies. The colors here refer to the same objects as in the top panel, but only dispersion-dominated (κrot < 0.5) TDGCs and DMC DGs are shown. Gray circles are early-type galaxies from faint dwarf spheroidals to giant ellipticals taken from Dabringhausen & Fellhauer (2016). Orange diamonds are ultra compact dwarf galaxies (UCDs) and globular clusters (GCs) taken from Mieske et al. (2008, 2013). The stellar masses of UCDs and GCs are calculated by assuming a constant stellar mass-to-light ratio in the V-band of |

The Kolmogorov–Smirnov (KS) test is applied in Fig. 13 in order to decipher whether or not DMC DGs and TDGCs follow the same stellar mass and stellar half-mass radius distribution. We only include simulated dwarf galaxies with stellar masses between 5 × 10⁷ M⊙ and 109 M⊙. The lower mass limit ensures that only well-resolved galaxies with a significant number of stellar particles are included in the statistical analysis. The P-values for the stellar half-mass radii are <10−12, which quantitatively confirms the dual dwarf theorem. Moreover, we find only 15 DM-poor DGs that are possibly TDGs that captured dark matter particles from their host galaxy. These DM-poor DGs typically reside in the radius–mass plot between the DMC DG and TDGC branches. The probability of such a capture is very small because of the high velocity dispersion of dark matter particles and the shallow gravitational potential of TDGs, consistent with the small number of such DM-poor DGs.
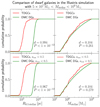 |
Fig. 13. KS test for all and dispersion-dominated (κrot < 0.5) simulated DMC DGs (green) and TDGCs (red) in the 5 × 10⁷−109 M⊙ stellar mass regime at redshift z = 0. |
The simulated dispersion-dominated (κrot < 0.5) galaxies formed in a ΛCDM framework are compared with observational data from Dabringhausen & Fellhauer (2016) (early type galaxies) and Mieske et al. (2008, 2013) (UCDs and GCs). The data for UCDs and GCs only include dynamical masses but not stellar masses. Therefore, we estimate the stellar mass by assuming a constant stellar mass-to-light ratio of  in the V-band. The 2D effective radii, Re, are converted into 3D deprojected half-light radii, R0.5 light, by multiplying them by a factor of 4/3 (see Appendix B in Wolf et al. 2010).
The bottom panel of Fig. 12 demonstrates that UCDs and GCs are separated from early-type galaxies in the radius–mass diagram and are found below the spatial resolution limit of the Illustris-1 run. The yellow star in the radius–mass diagram represents the ultra-diffuse galaxy NGC 1052-DF2, which has Mstellar = 2 × 10⁸ M⊙ and an effective radius along the major axis of Re = 2.2 kpc (van Dokkum et al. 2018a) corresponding to a 3D deprojected half-light radius of 2.7 kpc. Especially remarkable is the large effective radius of NGC 1052-DF2 compared to the sample of observed early-type galaxies from Dabringhausen & Fellhauer (2016). The median values of simulated stellar half-mass radii and 3D deprojected half-light radii of observed galaxies for different stellar mass ranges are listed in Table 7 and are shown in Fig. 14. The median of simulated TDGCs is within the first and third quartiles of observed half-light radii for galaxies with stellar masses between 108 M⊙ and 1010 M⊙. However, the observed galaxy NGC 1052-DF2 is not within the first and third quartiles of simulated TDGCs and DM-rich DGs.
Medians of simulated stellar half-mass radii, R0.5 stellar, for dispersion-dominated (κrot < 0.5) DMC stellar objects, DMC DGs, and TDGCs samples for different stellar mass ranges.
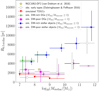 |
Fig. 14. Median, first, and third quartile of simulated stellar half-mass radii, R0.5 stellar, of dispersion-dominated (κrot < 0.5) objects and 3D deprojected half-light radii, R0.5 light, of observed early type galaxies for different stellar mass bins (107−108 M⊙, 108−109 M⊙, 109−1010 M⊙, 1010−1011 M⊙, and 1011−1012 M⊙). Blue right triangles are DM-rich stellar objects, purple crosses are DM-poor stellar objects, green dots are DM-rich DGs, magenta squares are DM-poor DGs, and red triangles are TDGCs (see Table 3). Gray open circles are observed early-type galaxies taken from Dabringhausen & Fellhauer (2016). The yellow star shows the position of NGC 1052-DF2 with Mstellar = 2 × 10⁸ M⊙ and a 3D deprojected half-light radius of 2.7 kpc (van Dokkum et al. 2018a). The medians of simulated and observed galaxies for different mass ranges are listed in Table 7. |
A series of KS tests are performed to decipher whether or not the stellar masses and radii of observed galaxies follow the same distribution as simulated dwarf galaxies. The full sample from Dabringhausen & Fellhauer (2016) is observationally biased, such that different types of galaxies can be over- or under-represented resulting in an incorrect stellar mass function of galaxies. In contrast to that, the sample from the Illustris simulation includes all formed galaxies without any mass, luminosity, or radius restrictions except for the resolution limits. Therefore, we choose a statistically fair subsample from the catalog by Dabringhausen & Fellhauer (2016), which includes all galaxies of the Fornax, the Hydra, and the Centaurus cluster catalogs with Mstellar > 5 × 10⁷ M⊙. These catalogs include dwarf galaxies as well as large galaxies such that these catalogs sample the observed galaxy luminosity and stellar mass function of galaxies over a wide range.
Since galaxy cluster surveys almost always include the central parts of the clusters where the massive galaxies tend to gather, dwarf galaxies can be under-represented in the observational sample. In order to remove this bias towards high stellar masses for observed galaxies we restrict the KS test to dwarfs with stellar masses between 5 × 10⁷ M⊙ and 109 M⊙ as shown in Fig. 15. We find that the stellar mass distribution for all simulated DMC DGs and TDGCs fits the observed stellar mass distribution with a P-value of 0.260 and 0.766, respectively. The P-value for the stellar half-mass radius distribution for DMC DGs is < 10−12, which means that it is virtually impossible that the simulated and observed radii can be described with the same distribution function. In contrast to that, the P-value obtained by comparing the stellar half-mass radius distributions of the observed dwarf galaxies with simulated TDGCs is 0.209. This means that if the treatment of baryonic physics in the Illustris-1 simulations is a reasonable approximation of reality, then the observed (real) dE galaxies ought to be TDGs. This conclusion was reached independently by Okazaki & Taniguchi (2000).
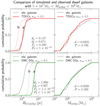 |
Fig. 15. KS test for observed late-type galaxies (gray) and dispersion-dominated (κrot < 0.5) simulated (red, green) DGs with stellar masses between 5 × 10⁷ M⊙ and 109 M⊙. The thick lines and the displayed da- and Pa-values refer to the real stellar half-mass radius distribution of the Illustris-1 simulation. The thin lines and the db- and Pb-values refer to a distribution in which all radii in the Illustris-1 simulation are divided by two (see text). The observational data are a subset of the catalog from Dabringhausen & Fellhauer (2016) including all galaxies from the Fornax, Hydra, and Centaurus cluster catalog with stellar masses between 5 × 10⁷ M⊙ and 109 M⊙. |
Pillepich et al. (2018) compared the galaxy sizes in the Illustris simulation and in the Illustris TNG (The Next Generation) simulation10,11. These latter authors concluded that the TNG simulation produces stellar half-mass radii two times smaller than in the Illustris simulation for galaxies Mstellar < 1010 M⊙, which is caused by a modification of the treatment of galactic winds. Although the new galaxy physics model improves the simulated galaxy sizes, a mismatch between stellar half-mass radii is still present in Illustris TNG. Therefore, we not only compare the observed radius distribution with the radius distributions directly from the Illustris simulation, but also with the distributions that follow when every radius is divided by two. The P-values of the KS test in Fig. 15 (red and green thin lines) for galaxies that are twice as compact as the original Illustris data are <10−12 for both DMC DGs and TDGCs. Interestingly, simulated TDGCs become more compact than the observed ones when their radii are divided by two. However, since the Illustris TNG data are not yet publicly available, we do not know at present whether the dark matter-poor and dark matter-free galaxies are indeed also more compact in the Illustris TNG simulation than in the Illustris simulation. Here we assume that all galaxies in the Illustris TNG simulation are more compact than in the Illustris simulation by a factor of two. Nevertheless, the vast majority of the simulated galaxies (i.e., the dark matter-dominated galaxies) would still have radii that are too large to be consistent with the observed radius distribution.
Summarizing, the observations do not clearly show different populations of galaxies based on their masses and radii, which was already reported by Dabringhausen & Kroupa (2013) using a sample they consider to be TDGs (TDG candidates) as discussed in their Sect. 2.2.1. This is in disagreement with the Illustris simulation, which predicts two populations of dwarf galaxies in the radius–mass plane. The possible implications of this for ΛCDM cosmology are discussed in Sect. 4.3.
3.5. Evolution of the number density of TDGCs across cosmic time
Figure 16 shows the evolution in the co-moving number density, nTDGCs, of simulated TDGCs (sample A) over cosmic time. These TDGCs with Mstellar > 5 × 10⁷ M⊙ are identified by the searching algorithm for the first time at redshift z = 4.7 and therefore appear 0.752 Gyr later than DMC stellar objects with a stellar mass of at least 5 × 10⁷ M⊙. This may indicate that the formation of TDGCs is triggered by the encounters of DMC galaxies once these DMC galaxies have grown sufficiently in mass through mergers to spawn TDGCs above a stellar mass threshold of 5 × 10⁷ M⊙. Less-massive TDGCs are most likely formed earlier, but cannot be resolved in the Illustris simulation. The number density of TDGCs increases up to redshift z = 1.4, where a global maximum of nTDGCs(z = 1.4)=8.2 × 10⁻⁴h3 cMpc−3 is reached. Later on, the number density of TDGCs decreases in time. Since galaxies at higher redshifts were more gas-rich, metal-poor, and more dynamically active, TDGCs are formed efficiently through galaxy interactions resulting in an increase of the co-moving numberdensity with decreasing redshift.
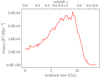 |
Fig. 16. Time evolution of the co-moving number density of TDGCs, nTDGCs, identified with the same selection criteria as for sample A. The x-axis shows the lookback time in gigayears (i.e., 0 Gyr corresponds to the present time) and redshift z. |
4. Discussion
In this section we discuss the properties of TDGCs and DMC DGs in the Illustris simulation. The dual dwarf theorem and its implications for ΛCDM cosmology are considered.
4.1. Formation and evolution of TDGCs
The highest-resolution run of the Illustris suite allows us to study the formation and evolution of TDGCs. We consider that baryonic substructures may be spurious objects or fragments within a galaxy and that TDGCs may be formed out of the gas of a disk galaxy during galactic interactions. Mergers of rotationally supported galaxies in dark matter halos occur in the Illustris simulation. Previous work has shown that TDGs form in such encounters (Barnes & Hernquist 1992; Bournaud & Duc 2006; Wetzstein et al. 2007; Fouquet et al. 2012; Yang et al. 2014) and thus it can be expected that they would also form in the self-consistent cosmological Illustris simulation. The verification of this theory would require following the merger tree of all TDGCs over cosmic time. However, none of the TDGCs at redshift z = 0 are included in the merger trees provided by the Illustris team (Rodriguez-Gomez et al. 2015) and backtracing all TDGCs by their particle data is very resource consuming. Therefore we have shown for some TDGCs that these subhalos have indeed been formed due to tidal forces caused by galactic interactions (see Sect. 2.5, Appendix A, and the movies in the supplementary information).
Tidal dwarf galaxies lack dark matter due to the physics of their formation. We point out that apart from galactic interactions, efficient cooling processes provided by the implemented galaxy-formation models of the Illustris simulation can also artificially trigger the formation of DMF stellar objects. Jeans instabilities depend on the mass and temperature of the molecular gas cloud. The collapse of a cloud is supported by an increase of the mass (at a given temperature) or a decrease of the temperature (at a given mass) (Jeans 1902; Coles & Lucchin 2003). Efficient cooling of great baryonic matter accumulations allows for the collapse of these structures without the need for high amounts of nonbaryonic matter. Cold accretion of gas clumps onto halos might also perhaps produce such DMF objects. The agreement of the properties of the TDGCs formed in Illustris-1 with independent work reporting the formation of TDGs (Barnes & Hernquist 1992; Bournaud & Duc 2006; Wetzstein et al. 2007; Fouquet et al. 2012; Yang et al. 2014; Ploeckinger et al. 2018), the shown formation scenarios in Sect. 2.5, and the applied 6D phase-space halo finder on selected TDGCs (see Appendix C) all together suggest that the TDGCs formed in Illustris-1 are physical.
By extracting the formation time of the oldest stellar particle within a dwarf galaxy identified at redshift z = 0, we have shown that TDGCs and DM-poor DGs are typically younger than DM-rich DGs. This underlines that DM-rich DGs are formed in the early universe in contrast to TDGCs as expected from their different formation scenarios, since TDGs are being formed from the expelled gas from massive galaxies triggered by galactic encounters and interactions. Furthermore, gas-rich TDGCs are typically younger than gas-free TDGCs.
We have shown that TDGCs with Mgas > 5 × 10⁷ M⊙ and with at least one stellar particle (sample B) are typically more phase-space-correlated than DMC DGs. TDGCs with Mstellar > 5 × 10⁷ M⊙ (sample A) are less phase-space-correlated than sample B but are still more so than DMC DGs. The difference is qualitatively consistent with sample A (gas-poor TDGCs) being older than sample B (gas-rich TDGCs). Gas-poor TDGs would have been stripped of their gas or would have consumed it and their orbits are likely perturbed due to later mergers of the hosting galaxy which are likely to destroy phase-space-correlated populations in the dark matter-based cosmological models (see also Kroupa 2015). However, the small number of galactic systems of sample A hosting more than one TDGC requires further study of this issue in order to produce any statistically robust conclusions about their phase-space correlation (see Sect. 3.1). In a more detailed analysis we also have to investigate if and how an initial phase-space correlation is affected by further galactic encounters and mergers. In the local Universe a large if not dominant fraction of the dwarf galaxies surrounding the MW, M 31, and NGC 5128 (Centaurus A) are significantly phase-space-correlated (Kroupa et al. 2005; Metz & Kroupa 2007; Ibata et al. 2013, 2014; Pawlowski & Kroupa 2013; Müller et al. 2018; Pawlowski 2018). This observed ubiquitous occurrence of disks or planes of satellites (Ibata et al. 2014; Pawlowski 2018) may thus imply an absence of such encounters in the real Universe.
4.2. Gas masses and star formation rates of TDGCs
TDGCs are likely formed out of the stellar and gas reservoir of their host galaxies. We have shown that the amount of gas depends strongly on the applied selection criteria. Our main sample (sample A) includes 97 TDGCs with Mstellar > 5 × 10⁷ M⊙, such that around 89 percent are completely gas-free suggesting that a significant fraction of TDGCs have already converted their gas content to stars. The large fraction of gas-free TDGCs has a direct consequence on the star formation rate such that 90 percent have no star formation. However, when we apply selection criteria similar to Ploeckinger et al. (2018) we find a larger number of TDGCs (sample B, see Table 1). These are young and gas-rich TDGCs which have recently formed out of the gaseous disk of their host galaxies (see Sects. 2.5 and 3.3).
TDGCs and DM-poor DGs (Mdm/Mbaryonic < 1) are often more metal-rich and younger than DM-rich DGs (Mdm/Mbaryonic ≥ 1). This is consistent with the formation theory of TDGs and underlines that TDGs can also capture at least a small amount of dark matter particles (see Appendix B). By back-tracing the particle identification numbers, one can decipher whether or not a TDGC in the Illustris simulation can indeed capture dark matter particles. Such events must be extremely rare given the weak gravitational potential of TDGCs, but it may be interesting to study this in the future. Indications of such a capture can be seen in Fig. 3 in Sect. 2.5, but it is likely that these dark matter particles identified by the Subfind algorithm are just individual particles crossing the object. Nevertheless, the small number of DMC DGs with a dark-to-baryonic matter fraction smaller than one and their similar physical properties to TDGCs indicate that such DM-poor DGs are TDGs.
4.3. Radius–mass relation
According to the dual dwarf theorem, two different types of dwarf galaxies should exist in the mass range between about 106 M⊙ and 1010 M⊙ (Kroupa 2012; Dabringhausen & Kroupa 2013). Although observed dEs and TDGs are indistinguishable in the radius–mass plane (Dabringhausen & Kroupa 2013), simulated TDGCs are clearly separated by being smaller than DMC DGs. By showing that TDGCs and DM-poor DGs are more compact than DM-rich DGs in the stellar mass range between 5 × 10⁷ M⊙ and 109 M⊙ we have verified the dual dwarf theorem for the first time in a self-consistent ΛCDM simulation. The KS test underlines a statistically highly significant difference between the stellar-half mass distribution of TDGCs and DMC DGs. The P-value of the KS test is <10−12. These results are consistent with the formation scenario of TDGs in the ΛCDM framework, which are understood to be formed naked without the help of a dark matter potential and ought to be therefore more compact than primordial dwarfs (Kroupa 2012). It is noteworthy that the observed physical stellar half-light radii more closely resemble simulated stellar half-mass radii of dark matter-free and -poor galaxies rather than of dark matter-dominated galaxies in the stellar mass regime of 5 × 10⁷ M⊙ and 109 M⊙ (Dabringhausen & Kroupa 2013; Duc et al. 2014). Comparing the stellar half-mass radius distributions of dispersion-dominated TDGCs and DMC DGs from the Illustris-1 simulation with observed early-type galaxies gives a P-value of 0.209 and <10−12, respectively. The radii of TDGCs formed in the Illustris-1 simulation are confirmed by the independent simulations of Fouquet et al. (2012). The fact that the radius of TDGCs and DM-poor galaxies in Illustris-1 agree with the observed dE galaxies suggests that the latter are TDGs, as also concluded by Okazaki & Taniguchi (2000) based on different arguments.
The first results from the new Illustris TNG simulation have shown that a modification of the galactic wind model reduces the stellar half-mass radii by a factor of two for galaxies with Mstellar < 1010 M⊙ (Pillepich et al. 2018). Nevertheless, we have shown in the present paper that even these current state-of-the-art cosmological hydrodynamical simulations cannot reproduce the observed galaxy sizes (see Sect. 3.4).
A further consistency test of the ΛCDM cosmology would be to study the positions on the baryonic Tully-Fisher relation (BTFR) of simulated dark matter-poor and dark matter-dominated galaxies. Dark matter-poor galaxies (i.e., TDGs) are thus expected to lie above the BTFR by having smaller rotation speeds than DMC galaxies of the same baryonic mass. The apparent absence of observed dwarf galaxies, some of which must be TDGs that lie above the BTFR, may pose a serious challenge for dark matter cosmology (Kroupa 2012; Flores et al. 2016). This issue could be directly tested with confirmed old TDGs settled down to virial equilibrium as is likely with the observed TDGs identified by Duc et al. (2014). Observations show a very tight power-law correlation between the baryonic mass and the circular velocity for galaxies with baryonic masses between 107 M⊙ and 5 × 10¹¹ M⊙ (McGaugh 2012; Lelli et al. 2016). However, a proper analysis requires the extraction of each model galaxy and the fitting of its rotation curve, meaning that this line of investigation needs to be postponed to a detailed analysis of the rotation curves of galaxies in the Illustris and EAGLE simulations.
5. Conclusion
We studied the physical properties of dwarf galaxies lacking dark matter in the ΛCDM Illustris simulation. In particular, we identified 3484 stellar objects without any dark matter in the simulation volume of (75 h−1 cMpc)3 at redshift z = 0. After applying a minimum mass criterion, we separated them into substructures and TDGCs based on their separation to their host galaxies (see Sect. 2.4). The minimum stellar mass of our main sample (sample A) is set to 5 × 10⁷ M⊙ and includes 97 TDGCs corresponding to a co-moving number density of 2.3 × 10⁻⁴h3 cMpc−3 in the Illustris-1 simulation. These galaxies have total masses up to 3.1 × 10⁹ M⊙, which is comparable to the mass of the LMC. Fouquet et al. (2012) suggest that the observed Magellanic Clouds could be TDGs (see Sect. 3.3). We present movies of the formation scenarios of TDGCs confirming their tidal dwarf nature. In particular, TDGCs are formed through galactic interactions and in the ram-pressure-stripped gas clouds of the host galaxy (see Sect. 2.5, Appendix A and the movies in the supplementary information). However, TDGCs may conceivably also be formed in other scenarios such as cold accretion of gas clumps onto halos (see also Sect. 4.1) which has not been addressed in this work, and has also never been reported to actually occur.
Dwarf galaxies lacking dark matter are mostly found in massive halos, in the vicinity of a massive galaxy, and are typically younger than DM-rich DGs. These results support the theory that these objects are TDGs formed through galactic interactions and mergers (see Sects. 2.4 and 3.3). TDGCs and DMC DGs with a small dark matter mass are often metal-rich (see Appendix B), which indicates that these satellite galaxies are possibly TDGs formed from a chemically enriched host galaxy (Recchi et al. 2015). Almost all of the TDGCs of sample A are gas depleted and dispersion-dominated, which suggest that these are older TDGs which could have already lost their gas content by feedback processes and suffered from an angular momentum loss. The density distribution of four selected massive TDGCs can be described by a Plummer model and an exponential profile (see Figs. C.2 and C.8).
Analyzing the orbital angular momenta of TDGCs which have a minimum gas mass of 5 × 10⁷ M⊙ and at least one stellar particle (sample B) yields that these objects are significantly phase-space-correlated as observed in the Local Group (Kroupa et al. 2005; Pawlowski 2018) and Centaurus A (Müller et al. 2018). Moreover, simulated TDGCs are significantly more phase-space-correlated than DMC DGs (see Sect. 3.1).
Throughout the paper we have identified TDGCs based on the Subfind algorithm, which is a position-space subhalo finder. We also apply a 2σ-clipping scheme as a 6D phase-space halo finder to the surroundings of gas-free Subfind TDGCs of sample A and we show that 92 percent of these objects are gravitationally self-bound by including the velocity-space information of stellar particles (see Appendix C).
We quantified the probability of finding a NGC 1052-DF2-like galaxy in the Illustris-1 simulation at redshift z = 0. While finding a few similar galaxies (Table 5), there is also a non-detection of gas-free TDGCs with Mstellar ≥ 0.8 × (2×108) M⊙ and R0.5 stellar ≥ 0.8 × 2.7 kpc. Thus, such dwarf galaxies appear to be extremely rare in the Illustris-1 simulation. However, we note that this analysis does not consider the peculiar velocity of the observed NGC 1052-DF2 dwarf galaxy (see Sect. 3.2).
We reported for the first time that the dual dwarf theorem is fulfilled in the self-consistent ΛCDM cosmological Illustris-1 simulation. TDGCs and DM-poor DGs populate regions in the radius–mass plane that are different from those populated by DM-rich DGs. In the stellar mass range between 5 × 10⁷ M⊙ and 109 M⊙ galaxies which are dark matter-poor have smaller stellar half-mass radii than dark matter-dominated galaxies as predicted by Kroupa (2012). In particular, the KS test showed that the probability that simulated TDGCs and DMC DGs follow the same stellar half-mass radius distributions is less than 10−12. The independent simulations by Fouquet et al. (2012) lead to TDGs which have radii in agreement with those of TDGCs in the Illustris simulation. However, the work of Dabringhausen & Kroupa (2013) has shown that observed TDGs occupy the same region in the radius–mass diagram as elliptical dwarf galaxies. This region agrees with our model TDGCs, causing a major conflict with ΛCDM cosmology, because based on Illustris-1 some splitting is expected for galaxies with such different origins (see Sect. 3.4). However, we note that only 0.17 percent of all galaxies with Mstellar = 5 × 10⁷−109 M⊙ are TDGCs or DM-poor DGs in the Illustris-1 simulation.
It is therefore essentially important to conduct dedicated dwarf galaxy surveys (such as Merritt et al. 2016; Javanmardi et al. 2016) to find dwarf galaxies which are lacking dark matter, as this would confirm the dual dwarf galaxy theorem (it would be established that dwarfs with and without dark matter do exist in the real Universe), thus supporting ΛCDM cosmology. van Dokkum et al. (2018a, 2019) have indeed found two candidates for such dwarf galaxies in the group of NGC 1052 (i.e., NGC 1052-DF2 and -DF4). However, the different positions of the Illustris TDGCs and DMC DGs in the radius–mass plane are in significant tension with the fact that there is only one population of observed dwarf galaxies. That the TDGCs in Illustris-1 have radii in agreement with the observed radii of dE galaxies suggests that the latter are TDGs, as also concluded independently by Okazaki & Taniguchi (2000).
Movies of Fig. 2
ID73663_zoom.mp4 Access Supplementary Material
ID73663.mp4 Access Supplementary Material
ID404871.mp4 Access Supplementary Material
ID150872.mp4 Access Supplementary Material
ID138.mp4 Access Supplementary Material
The separation, s, between two subhalos is defined as the distance between the particles with the minimum gravitational potential energy in each subhalo.
The statistically expected 3D separation between the observed NGC 1052 and NGC 1052-DF2 galaxies is about 100 kpc, which is  times its projected separation, assuming NGC 1052-DF2 is at a distance from us comparable to that of NGC 1052 (20 Mpc, van Dokkum et al. 2018a). However, this distance may be revised (Trujillo et al. 2019).
These calculations include only completely dark matter-free galaxies. In a further analysis subhalos with the ratio Mhalo/Mstellar at least 400 times lower than theoretically expected can be included. This analysis would be an interesting extension to the present work.
Here, we refer to the TDGC sample B, which includes DMF stellar objects beyond  and within
  with Mgas > 5 × 10⁷ M⊙ containing at least one stellar particle.
In the Illustris-1 simulation the smallest fiducial cell size  is 48 pc and the minimum mass
  of a cell is 0.15 × 10⁵ M⊙ (Vogelsberger et al. 2014b).
In this section we only refer to TDGCs of sample A.
The data of the TNG simulation project are not yet public available [02.06.2018].
Only cells within twice the stellar half-mass radius are considered.
The Illustris-1 simulation box includes 18203 dark matter particles and 18203 gas tracer particles (gas cells and stellar particles). Therefore operating on the gas cells and dark matter particles would be extremely storage consuming such that we focus here purely on the stellar particles.
Acknowledgments
We thank the anonymous referee for her/his constructive comments and suggested improvements. IB is supported by an Alexander von Humboldt research fellowship. We thank the DAAD-Ostpartnerschaftsprogramm für 2018 at the University of Bonn for funding exchange visits between Charles University in Prague and Bonn University. We would like to thank the staff of the Illustris project, especially Dylan Nelson and Vicente Rodriguez-Gomez, for providing the Illustris data, the κrot morphology parameter, example scripts, and useful suggestions. We thank Paul Torrey for explanations about the Illustris Galaxy Observatory.
References
- Angus, G. W., Diaferio, A., & Kroupa, P. 2011, MNRAS, 416, 1401 [NASA ADS] [CrossRef] [Google Scholar]
- Barnes, J. E., & Hernquist, L. 1992, Nature, 360, 715 [NASA ADS] [CrossRef] [Google Scholar]
- Baumgardt, H., & Mieske, S. 2008, MNRAS, 391, 942 [NASA ADS] [CrossRef] [Google Scholar]
- Bender, R., Burstein, D., & Faber, S. M. 1992, ApJ, 399, 462 [NASA ADS] [CrossRef] [Google Scholar]
- Bender, R., Burstein, D., & Faber, S. M. 1993, ApJ, 411, 153 [NASA ADS] [CrossRef] [Google Scholar]
- Binggeli, B., Sandage, A., & Tarenghi, M. 1984, AJ, 89, 64 [NASA ADS] [CrossRef] [Google Scholar]
- Bournaud, F., & Duc, P.-A. 2006, A&A, 456, 481 [NASA ADS] [CrossRef] [EDP Sciences] [Google Scholar]
- Bournaud, F., Duc, P.-A., & Emsellem, E. 2008a, MNRAS, 389, L8 [NASA ADS] [CrossRef] [Google Scholar]
- Bournaud, F., Bois, M., Emsellem, E., & Duc, P.-A. 2008b, Astron. Nachr., 329, 1025 [NASA ADS] [CrossRef] [Google Scholar]
- Casas, R. A., Arias, V., Peña Ramírez, K., & Kroupa, P. 2012, MNRAS, 424, 1941 [NASA ADS] [CrossRef] [Google Scholar]
- Chowdhury, A. 2019, MNRAS, 482, L99 [NASA ADS] [CrossRef] [Google Scholar]
- Coles, P., & Lucchin, F. 2003, Cosmology: The Origin and Evolution of Cosmic Structure (John Wiley& Sons) [Google Scholar]
- Dabringhausen, J., & Fellhauer, M. 2016, MNRAS, 460, 4492 [NASA ADS] [CrossRef] [Google Scholar]
- Dabringhausen, J., & Kroupa, P. 2013, MNRAS, 429, 1858 [NASA ADS] [CrossRef] [Google Scholar]
- Danieli, S., van Dokkum, P., Conroy, C., Abraham, R., & Romanowsky, A. J. 2019, ApJ, 874, L12 [NASA ADS] [CrossRef] [Google Scholar]
- Davis, M., Efstathiou, G., Frenk, C. S., & White, S. D. M. 1985, ApJ, 292, 371 [NASA ADS] [CrossRef] [Google Scholar]
- Dolag, K., Borgani, S., Murante, G., & Springel, V. 2009, MNRAS, 399, 497 [Google Scholar]
- Duc, P.-A., Brinks, E., Springel, V., et al. 2000, AJ, 120, 1238 [NASA ADS] [CrossRef] [Google Scholar]
- Duc, P.-A., Paudel, S., McDermid, R. M., et al. 2014, MNRAS, 440, 1458 [NASA ADS] [CrossRef] [Google Scholar]
- Emsellem, E., van der Burg, R. F. J., Fensch, J., et al. 2019, A&A, 625, A76 [NASA ADS] [CrossRef] [EDP Sciences] [Google Scholar]
- Famaey, B., & McGaugh, S. S. 2012, Liv. Rev. Relativ., 15, 10 [NASA ADS] [CrossRef] [Google Scholar]
- Ferrarese, L., Côté, P., Jordán, A., et al. 2006, ApJS, 164, 334 [NASA ADS] [CrossRef] [Google Scholar]
- Flores, H., Hammer, F., Fouquet, S., et al. 2016, MNRAS, 457, L14 [NASA ADS] [CrossRef] [Google Scholar]
- Fouquet, S., Hammer, F., Yang, Y., Puech, M., & Flores, H. 2012, MNRAS, 427, 1769 [NASA ADS] [CrossRef] [Google Scholar]
- Genel, S., Vogelsberger, M., Springel, V., et al. 2014, MNRAS, 445, 175 [Google Scholar]
- Gilmore, G., Wilkinson, M. I., Wyse, R. F. G., et al. 2007, ApJ, 663, 948 [NASA ADS] [CrossRef] [Google Scholar]
- Graus, A. S., Bullock, J. S., Boylan-Kolchin, M., & Nierenberg, A. M. 2018, MNRAS, 480, 1322 [NASA ADS] [CrossRef] [Google Scholar]
- Heggie, D., & Hut, P. 2003, The Gravitational Million-body Problem: A Multidisciplinary Approach to Star Cluster Dynamics (IOP Publishing) [Google Scholar]
- Hilker, M., Baumgardt, H., Infante, L., et al. 2007, A&A, 463, 119 [NASA ADS] [CrossRef] [EDP Sciences] [MathSciNet] [Google Scholar]
- Hinshaw, G., Larson, D., Komatsu, E., et al. 2013, ApJS, 208, 19 [NASA ADS] [CrossRef] [Google Scholar]
- Ibata, R. A., Lewis, G. F., Conn, A. R., et al. 2013, Nature, 493, 62 [CrossRef] [Google Scholar]
- Ibata, N. G., Ibata, R. A., Famaey, B., & Lewis, G. F. 2014, Nature, 511, 563 [NASA ADS] [CrossRef] [Google Scholar]
- Javanmardi, B., Martinez-Delgado, D., Kroupa, P., et al. 2016, A&A, 588, A89 [NASA ADS] [CrossRef] [EDP Sciences] [Google Scholar]
- Jeans, J. H. 1902, Trans. R. Soc. London Ser. A, 199, 1 [Google Scholar]
- Jonsson, P. 2006, MNRAS, 372, 2 [NASA ADS] [CrossRef] [Google Scholar]
- Jonsson, P., Groves, B. A., & Cox, T. J. 2010, MNRAS, 403, 17 [NASA ADS] [CrossRef] [Google Scholar]
- Kaviraj, S., Darg, D., Lintott, C., Schawinski, K., & Silk, J. 2012, MNRAS, 419, 70 [NASA ADS] [CrossRef] [Google Scholar]
- Knebe, A., Knollmann, S. R., Muldrew, S. I., et al. 2011, MNRAS, 415, 2293 [NASA ADS] [CrossRef] [Google Scholar]
- Koda, J., Yagi, M., Yamanoi, H., & Komiyama, Y. 2015, ApJ, 807, L2 [NASA ADS] [CrossRef] [Google Scholar]
- Kroupa, P. 1997, New Astron., 2, 139 [NASA ADS] [CrossRef] [Google Scholar]
- Kroupa, P. 2008, in The Cambridge N-Body Lectures, eds. S. J. Aarseth, C. A. Tout, & R. A. Mardling (Berlin Springer Verlag), Lect. Notes Phys., 760, 181 [NASA ADS] [CrossRef] [Google Scholar]
- Kroupa, P. 2012, PASA, 29, 395 [NASA ADS] [CrossRef] [Google Scholar]
- Kroupa, P. 2015, Can. J. Phys., 93, 169 [NASA ADS] [CrossRef] [Google Scholar]
- Kroupa, P., Theis, C., & Boily, C. M. 2005, A&A, 431, 517 [NASA ADS] [CrossRef] [EDP Sciences] [Google Scholar]
- Kroupa, P., Famaey, B., de Boer, K. S., et al. 2010, A&A, 523, A32 [NASA ADS] [CrossRef] [EDP Sciences] [Google Scholar]
- Lee-Waddell, K., Spekkens, K., Haynes, M. P., et al. 2012, MNRAS, 427, 2314 [NASA ADS] [CrossRef] [Google Scholar]
- Lelli, F., McGaugh, S. S., & Schombert, J. M. 2016, ApJ, 816, L14 [Google Scholar]
- Martin, N. F., Collins, M. L. M., Longeard, N., & Tollerud, E. 2018, ApJ, 859, L5 [NASA ADS] [CrossRef] [Google Scholar]
- Martínez-Delgado, D., Gabany, R. J., Crawford, K., et al. 2010, AJ, 140, 962 [NASA ADS] [CrossRef] [Google Scholar]
- McAlpine, S., Helly, J. C., Schaller, M., et al. 2016, Astron. Comput., 15, 72 [NASA ADS] [CrossRef] [Google Scholar]
- McGaugh, S. S. 2012, AJ, 143, 40 [NASA ADS] [CrossRef] [Google Scholar]
- Mendes de Oliveira, C., Plana, H., Amram, P., Balkowski, C., & Bolte, M. 2001, AJ, 121, 2524 [NASA ADS] [CrossRef] [Google Scholar]
- Merritt, A., van Dokkum, P., Danieli, S., et al. 2016, ApJ, 833, 168 [NASA ADS] [CrossRef] [Google Scholar]
- Metz, M., & Kroupa, P. 2007, MNRAS, 376, 387 [NASA ADS] [CrossRef] [Google Scholar]
- Metz, M., Kroupa, P., & Jerjen, H. 2007, MNRAS, 374, 1125 [NASA ADS] [CrossRef] [Google Scholar]
- Mieske, S., Hilker, M., Jordán, A., et al. 2008, A&A, 487, 921 [NASA ADS] [CrossRef] [EDP Sciences] [Google Scholar]
- Mieske, S., Frank, M. J., Baumgardt, H., et al. 2013, A&A, 558, A14 [NASA ADS] [CrossRef] [EDP Sciences] [Google Scholar]
- Mirabel, I. F., Dottori, H., & Lutz, D. 1992, A&A, 256, L19 [NASA ADS] [Google Scholar]
- Miralles-Caballero, D., Colina, L., & Arribas, S. 2012, A&A, 538, A61 [NASA ADS] [CrossRef] [EDP Sciences] [Google Scholar]
- Misgeld, I., & Hilker, M. 2011, MNRAS, 414, 3699 [NASA ADS] [CrossRef] [Google Scholar]
- Misgeld, I., Mieske, S., & Hilker, M. 2008, A&A, 486, 697 [NASA ADS] [CrossRef] [EDP Sciences] [Google Scholar]
- Misgeld, I., Hilker, M., & Mieske, S. 2009, A&A, 496, 683 [NASA ADS] [CrossRef] [EDP Sciences] [Google Scholar]
- Müller, O., Pawlowski, M. S., Jerjen, H., & Lelli, F. 2018, Science, 359, 534 [NASA ADS] [CrossRef] [Google Scholar]
- Nelson, D., Pillepich, A., Genel, S., et al. 2015, Astron. Comput., 13, 12 [NASA ADS] [CrossRef] [Google Scholar]
- Okazaki, T., & Taniguchi, Y. 2000, ApJ, 543, 149 [NASA ADS] [CrossRef] [Google Scholar]
- Pawlowski, M. S. 2018, Mod. Phys. Lett. A, 33, 1830004 [NASA ADS] [CrossRef] [Google Scholar]
- Pawlowski, M. S., & Kroupa, P. 2013, MNRAS, 435, 2116 [NASA ADS] [CrossRef] [Google Scholar]
- Pawlowski, M. S., Kroupa, P., & de Boer, K. S. 2011, A&A, 532, A118 [NASA ADS] [CrossRef] [EDP Sciences] [Google Scholar]
- Pawlowski, M. S., Famaey, B., Jerjen, H., et al. 2014, MNRAS, 442, 2362 [NASA ADS] [CrossRef] [Google Scholar]
- Pietrzyński, G., Graczyk, D., Gieren, W., et al. 2013, Nature, 495, 76 [NASA ADS] [CrossRef] [PubMed] [Google Scholar]
- Pillepich, A., Springel, V., Nelson, D., et al. 2018, MNRAS, 473, 4077 [NASA ADS] [CrossRef] [Google Scholar]
- Ploeckinger, S., Hensler, G., Recchi, S., Mitchell, N., & Kroupa, P. 2014, MNRAS, 437, 3980 [NASA ADS] [CrossRef] [Google Scholar]
- Ploeckinger, S., Recchi, S., Hensler, G., & Kroupa, P. 2015, MNRAS, 447, 2512 [NASA ADS] [CrossRef] [Google Scholar]
- Ploeckinger, S., Sharma, K., Schaye, J., et al. 2018, MNRAS, 474, 580 [NASA ADS] [CrossRef] [Google Scholar]
- Recchi, S., Theis, C., Kroupa, P., & Hensler, G. 2007, A&A, 470, L5 [NASA ADS] [CrossRef] [EDP Sciences] [Google Scholar]
- Recchi, S., Kroupa, P., & Ploeckinger, S. 2015, MNRAS, 450, 2367 [NASA ADS] [CrossRef] [Google Scholar]
- Rodriguez-Gomez, V., Genel, S., Vogelsberger, M., et al. 2015, MNRAS, 449, 49 [NASA ADS] [CrossRef] [Google Scholar]
- Rodriguez-Gomez, V., Sales, L. V., Genel, S., et al. 2017, MNRAS, 467, 3083 [NASA ADS] [CrossRef] [Google Scholar]
- Sales, L. V., Navarro, J. F., Theuns, T., et al. 2012, MNRAS, 423, 1544 [NASA ADS] [CrossRef] [Google Scholar]
- Sardone, A., Pisano, D. J., Burke-Spolaor, S., Mascoop, J. L., & Pol, N. 2019, ApJ, 871, L31 [NASA ADS] [CrossRef] [Google Scholar]
- Springel, V. 2010, MNRAS, 401, 791 [NASA ADS] [CrossRef] [Google Scholar]
- Springel, V., White, S. D. M., Tormen, G., & Kauffmann, G. 2001, MNRAS, 328, 726 [Google Scholar]
- Torrey, P., Vogelsberger, M., Genel, S., et al. 2014, MNRAS, 438, 1985 [NASA ADS] [CrossRef] [Google Scholar]
- Torrey, P., Snyder, G. F., Vogelsberger, M., et al. 2015, MNRAS, 447, 2753 [NASA ADS] [CrossRef] [Google Scholar]
- Trujillo, I., Beasley, M. A., Borlaff, A., et al. 2019, MNRAS, 733 [Google Scholar]
- van Dokkum, P., Danieli, S., Cohen, Y., et al. 2018a, Nature, 555, 629 [NASA ADS] [CrossRef] [Google Scholar]
- van Dokkum, P., Cohen, Y., Danieli, S., et al. 2018b, Res. Notes Am. Astron. Soc., 2, 54 [NASA ADS] [CrossRef] [Google Scholar]
- van Dokkum, P., Danieli, S., Abraham, R., Conroy, C., & Romanowsky, A. J. 2019, ApJ, 874, L5 [NASA ADS] [CrossRef] [Google Scholar]
- Vogelsberger, M., Genel, S., Sijacki, D., et al. 2013, MNRAS, 436, 3031 [NASA ADS] [CrossRef] [Google Scholar]
- Vogelsberger, M., Genel, S., Springel, V., et al. 2014a, MNRAS, 444, 1518 [NASA ADS] [CrossRef] [Google Scholar]
- Vogelsberger, M., Genel, S., Springel, V., et al. 2014b, Nature, 509, 177 [NASA ADS] [CrossRef] [Google Scholar]
- Vulcani, B., Poggianti, B. M., Gullieuszik, M., et al. 2018, ApJ, 866, L25 [NASA ADS] [CrossRef] [Google Scholar]
- Weilbacher, P. M., Fritze-v Alvensleben, U., Duc, P. A., & Fricke, K. J. 2002, ApJ, 579, L79 [NASA ADS] [CrossRef] [Google Scholar]
- Wetzstein, M., Naab, T., & Burkert, A. 2007, MNRAS, 375, 805 [NASA ADS] [CrossRef] [Google Scholar]
- Wolf, J., Martinez, G. D., Bullock, J. S., et al. 2010, MNRAS, 406, 1220 [NASA ADS] [Google Scholar]
- Yagi, M., Yoshida, M., Komiyama, Y., et al. 2010, AJ, 140, 1814 [NASA ADS] [CrossRef] [Google Scholar]
- Yang, Y., Hammer, F., Fouquet, S., et al. 2014, MNRAS, 442, 2419 [NASA ADS] [CrossRef] [Google Scholar]
- Yoshida, M., Yagi, M., Komiyama, Y., et al. 2008, ApJ, 688, 918 [NASA ADS] [CrossRef] [Google Scholar]
- Zjupa, J., & Springel, V. 2017, MNRAS, 466, 1625 [NASA ADS] [CrossRef] [Google Scholar]
Appendix A: Stellar luminosities and gas densities of TDGCs and their host galaxies
Using the Illustris Explorer online tool12, we visualize in Fig. A.1 the projected gas densities and stellar luminosities of TDGCs and DM-poor objects of the studied host galaxies ID 138 and ID 404871 in Sect. 2.5 at redshift z = 0. The identification number and physical parameters of the stellar objects shown in Fig. A.1 are listed in Table A.1.
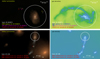 |
Fig. A.1. Projected stellar luminosity (left panels) and gas density (right panels) of the environment of the host galaxy ID 404871 (top panels) and ID 138 (bottom panels) at redshift z = 0. Top panels: stellar objects (1)–(3) close to ID 404871 (the white circle marks the host galaxy) are explained in the figure legend. Bottom panels: stellar objects (1) and (2) are identified as DMF substructures of the host galaxy ID 138 (the white circle as above). The luminous galaxy in the lower-right corner is a foreground galaxy, which has a 3D separation of 1626 kpc to the galaxy ID 138. Credits: http://www.illustris-project.org/explorer/ [13.08.2018]. |
Properties of the discussed and depicted stellar objects identified at redshift z = 0 and shown in Fig. A.1.
Appendix B: Gas and stellar metallicity of TDGCs and DMC DGs
Figure B.1 shows the stellar and gas metallicity in dependence of the stellar and gas mass, respectively, for DMC stellar objects, DMC DGs, and TDGCs (sample A). The stellar and gas mass-weighted average metallicities are defined as
 (B.1)
(B.1)
where Mtot is the total mass and M> He is the mass of all elements above Helium (He)13. DM-poor DGs and TDGCs are often significantly more metal-rich than DM-rich DGs, which is consistent with these galaxies being TDGs formed from chemically enriched host galaxies in the Illustris model (Recchi et al. 2015). Dark matter-containing stellar objects in the region of TDGCs and DM-poor DGs in Fig. B.1 (top) are typically metal-enriched substructures of massive subhalos. Therefore, DM-poor DGs can have captured dark matter particles.
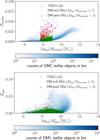 |
Fig. B.1. Stellar (top) and gas (bottom) mass-weighted average metallicity, Zstellar and Zgas, respectively, in dependence of the stellar mass, Mstellar, and gas mass, Mgas. The stellar and gas mass-weighted average metallicities, Zstellar and Zgas, are defined by Eq. (B.1). Blue bins are DMC stellar objects, green dots are DM-rich DGs (Mdm/Mbaryonic ≥ 1), magenta squares are DM-poor DGs (Mdm/Mbaryonic < 1), and red triangles are TDGCs of sample A. |
Appendix C: Internal structures and kinematics of TDGCs
In the following we discuss the internal structures and kinematics of TDGCs, which includes an analysis of their energy contents, density and dispersion distributions, and rotation curves. Different halo finders running on the same simulation can provide different results (Knebe et al. 2011). Therefore a σ-clipping procedure as a 6D phase-space halo finder is applied to the surroundings of the Subfind TDGCs to examine whether or not these objects are gravitationally bound by including their particle velocity data.
C.1. Virial equilibrium of TDGCs
The kinetic energy (including the thermal energy of the gas), Ekin, and the potential energy, Epot, of subhalos at redshift z = 0 are taken from a supplementary catalog prepared by Zjupa & Springel (2017) in which the energies of the subhalos are calculated by the particles identified by the Subfind algorithm (Springel et al. 2001).
All identified Subfind TDGCs of sample A and sample B fulfill the condition |Epot| > |Ekin|, which demonstrates that these subhalos are gravitationally bound. Here the virial ratio is defined by
 (C.1)
(C.1)
such that for a self-gravitating object virial equilibrium is achieved if q = 1 and the object is gravitationally bound if q < 2. Figure C.1 shows that TDGCs of sample A only slightly deviate from virial equilibrium for larger stellar masses or smaller stellar half-mass radii in the sense that they become dominated by potential energy (q < 1). The mean and the standard deviation of the virial ratio of all TDGCs of sample A is 0.85 and 0.18, respectively. Therefore, the condition for virial equilibrium lies roughly within the 1σ range of the virial ratio distribution. The statistics of the virial ratio for different dwarf galaxy samples are given in Table C.1.
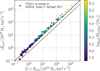 |
Fig. C.1. Relation between the potential and kinetic energy for all TDGCs of sample A. The colorbar presents the stellar mass, Mstellar, of the TDGCs. The black solid lines highlight the condition for virial equilibrium, i.e., where the virial ratio becomes q = 1 (see Eq. (C.1)). All objects above the black dashed line are gravitationally bound (q < 2). |
Virial ratio, q (Eq. (C.1)), for TDGC samples and DMC DGs at redshift z = 0 as resulting from the Subfind algorithm.
C.2. Density distribution, velocity distribution, and rotation curves of TDGCs
In Fig. C.2 we study the internal structure of four massive gas-free TDGCs of sample A which are among the most deviant ones from virial equilibrium (i.e., with q = 0.60−0.70) by fitting their density distributions with a Plummer model and an exponential function. The 3D density profile for a Plummer model (e.g., Heggie & Hut 2003; Kroupa et al. 2008) is given by
 (C.2)
(C.2)
where Mtot is the total mass of the object and aP is the Plummer radius which is related to the half-mass radius, R0.5 total, by
 (C.3)
(C.3)
The exponential function describes the observed dwarf satellite galaxies well (Binggeli et al. 1984) and has the form,
 (C.4)
(C.4)
where ρe, 0 is the central density and rd is the scale radius. Both fitting functions can reasonably describe the density profile of the shown TDGCs, that is, their total masses derived from the fits are comparable to the total masses obtained from the Subfind algorithm. The half-mass radius calculated from the Plummer fit for all the four TDGCs is smaller than the radii given by the Subfind algorithm. The fitting parameters and their uncertainties and a quantitative comparison with the total mass and half-mass radii obtained from the Subfind algorithm are labeled in the panels of Fig. C.2. These demonstrate that even the density distributions of simulated TDGCs which are not fully in virial equilibrium follow a profile which is expected from observed dwarf galaxies.
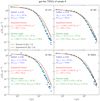 |
Fig. C.2. Radial density distributions of four selected gas-free TDGCs of sample A (IDs 372, 487, 593, and 59553) fitted with a Plummer model (green; Eq. (C.2)) and an exponential function (red; Eq. (C.4)). The radial bins have a width of 100 pc. The identification number, ID, their corresponding virial ratios, q (Eq. (C.1)), their total masses and stellar half-mass radii obtained from the Subfind algorithm, and their fitting parameters are given in the panels. According to the particles identified by the Subfind algorithm, the TDGCs shown here are not fully in virial equilibrium. The rotation curves and 3D velocity dispersion of the TDGCs discussed here are shown in Fig. C.3 and Fig. C.4. |
The internal kinematics of the above discussed gas-free TDGCs are analyzed in Figs. C.3 and C.4 in which their rotation curves and the 3D velocity dispersion (top panels) are plotted. By assuming that the mass distribution of these TDGCs is spherical we can calculate the circularity velocity by
 (C.5)
(C.5)
where G is the gravitational constant and Mtot(<r) is the total mass within the radius r. The rotation curves of TDGCs decline for larger radii because of the absence of dark matter particles. The 3D velocity dispersion for the TDGCs with the ID 372, ID 487, and ID 593 increases with increasing radii up until reaching a maximum value, which could indicate that their stellar mass grew during formation inside-out. In order to address this formation theory, we plot in Figs. C.3 and C.4 (bottom panels) the mean and the standard deviation as error bars of the stellar particle age in dependence of the distance to the center of the TDGC. The age gradient is almost zero across the whole galaxy, which does not confirm an inside-out formation scenario of these TDGCs.
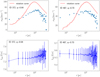 |
Fig. C.3. Rotation curves and radial 3D velocity dispersion distributions (top), and the radial distribution of stellar particle ages (bottom) of gas-free TDGCs of sample A with the ID 372 and ID 487. The radial bins have a width of 100 pc. The error bars in the bottom panels correspond to the standard deviation of the stellar particle age within a radial bin. The identification number, ID, and their corresponding virial ratios, q (Eq. (C.1)), are given in the panels. The radial density distributions of the TDGCs discussed here are shown in Fig. C.2. |
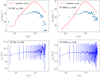 |
Fig. C.4. As in Fig. C.3 but for gas-free TDGCs of sample A with the ID 593 and ID 59553. The radial density distributions of the here discussed TDGCs are shown in Fig. C.2. |
C.3. Mass-weighted σ-clipping (outlier-rejection)
Throughout this study the analysis relies on the Subfind algorithm, which is a position-space subhalo finder (Springel et al. 2001). We apply a mass-weighted σ-clipping scheme in the 6D phase-space as an outlier-rejection method in order to cross-check if the TDGCs identified by the Subfind algorithm are indeed gravitationally bound objects. For simplicity we only analyze TDGCs that are gas-free according to the Subfind algorithm (i.e., 86 out of 97 TDGCs of sample A), such that the σ-clipping procedure is only applied to the stellar particles within the Illustris-1 box14.
The σ-clipping scheme for a single gas-free TDGC which was originally identified by the Subfind algorithm works as follows: In the first step, we load the center and the stellar half-mass radius of the considered TDGC provided by the Subfind algorithm. Secondly, we extract all stellar particles within a sphere centered at the position of the considered TDGCs with a radius of 20 times the stellar half-mass radius. Subsequently, the σ-clipping procedure starts by calculating the stellar center-of-mass position and velocity in the first iteration by
 (C.6)
(C.6)
where N is the number of all selected stellar particles within the sphere, mi is the mass, ri is the position vector, vi is the velocity vector of the ith stellar particle, and M is the mass of all selected stellar particles. Each of the selected stellar particles has to fulfill the following two conditions
 (C.7)
(C.7)
where η is the σ-threshold, and σr and σv are the standard deviations in position and velocity space given by
 (C.8)
(C.8)
whereby σr and σv are set to be zero in the first iteration. The stellar particles which do not fulfill the condition C.7 are rejected and the center-of-mass position and velocity are re-calculated for the accepted stellar particles (see Eq. (C.6), where N and M refer to only the accepted stellar particles). This procedure is iteratively repeated until the algorithm converges such that the following three conditions are fulfilled
 (C.9)
(C.9)
where δ is the convergence threshold and  is the velocity dispersion of the previous iteration. We chose for the following analysis a σ-threshold of η = 2 or η = 3 and a convergence threshold of δ = 0.01.
Finally, the virial ratio is calculated using the stellar particles accepted by the σ-clipping scheme. The kinetic and potential energy are given, respectively, by
 (C.10)
 (C.11)
where N is the number of all accepted stellar particles based on the σ-clipping scheme, G is the gravitational constant, and ϵbaryonic is the softening length, for which we assume for simplicity a fixed value of 710 pc corresponding to the resolution of gravitational dynamics in Illustris-1.
Figure C.5 and Table C.2 compare the virial ratio of gas-free TDGCs of sample A calculated by the Subfind and σ-clipping algorithms. As expected, the percentage of gravitationally bound objects depends on the σ-threshold. Choosing η = 2 in the σ-clipping scheme we find that 92 percent of our gas-free TDGCs of sample A identified by the Subfind algorithm fulfill |Epot| > |Ekin| and are thus also gravitationally bound when they become selected by a 6D phase-space halo finder. Objects that are not gravitationally bound have q > 2. In Fig. C.6 we illustrate for three TDGCs the σ-clipping scheme by plotting selected and accepted stellar particles in a position–velocity diagram and compare them with the particle distribution obtained by the Subfind algorithm. The TDGCs ID 372 (top panels) and ID 2275 (panels in the second row) are examples that are also gravitationally bound objects according to a σ-clipping scheme with η = 2. Despite the unusual appearance in the right panel of ID 2275 the velocity–radius distribution of accepted particles is rather similar to the distribution of the Subfind particles. The σ-clipping algorithm calculates the center-of-mass position and velocity by using the accepted stellar particles resulting in a shift in the velocity-position diagram (see ID 2275 in the left panel in the second row of Fig. C.6). The TDGC ID 53625 is an example which is gravitationally bound according to the Subfind algorithm (q = 0.78), but cannot be identified as a gravitationally bound object by using the σ-clipping scheme as a 6D phase-space halo finder, that is, the virial ratio calculated by all accepted stellar particles is q = 1387 and thus |Ekin| ≫ |Epot|. The Subfind TDGCs which are not gravitationally bound according to the σ-clipping scheme typically have lower stellar masses in the range of 5.6 × 10⁷−1.4 × 10⁸ M⊙ and their positions in the radius–mass diagram are highlighted in Fig. C.7.
We also compare the Subfind algorithm and σ-clipping scheme with a σ-threshold of η = 2 for the density distribution of the TDGCs discussed in Fig. C.2. In Fig. C.8 the density distributions of the TDGCs are fitted with a Plummer model (see Eq. (C.2)) and the fitting parameters are qualitatively compared in the figure panels. The two different halo finders (i.e., 3D position-space and 6D phase-space algorithms) give these TDGCs approximately the same density distributions as those pointed out by the fitting parameters of the Plummer model.
Summarizing, a small number of TDGCs identified with the Subfind algorithm are not confirmed by a σ-clipping scheme as gravitationally self-bound objects. These TDGCs might either not be real or cannot be identified as bound objects given the limitations of the σ-clipping scheme. Therefore, the frequency of Subfind TDGCs is ≈10 percent too high and this does not affect our results significantly.
Virial ratio, q (Eq. (C.1)), for gas-free TDGCs of sample A calculated by the stellar particles identified by the Subfind and σ-clipping algorithms.
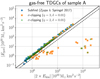 |
Fig. C.5. Relation between the potential and kinetic energy for gas-free TDGCs of sample A calculated by the Subfind and σ-clipping (η = 2, 3; δ = 0.01) algorithms. The black solid line highlights the condition for virial equilibrium, i.e., where the virial ratio becomes q = 1 (see Eq. (C.1)). All objects above the black dashed line are gravitationally bound (q < 2). The kinetic and potential energy for the Subfind algorithm are taken form Zjupa & Springel (2017) and the calculation for the potential energy using particles identified by σ-clipping assumes a fixed softening length in Eq. (C.11). |
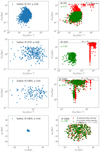 |
Fig. C.6. Top three panels: modulus of the position and velocity vectors with respect to the center-of-mass for stellar particles (see Eq. (C.7)). Blue dots are stellar particles identified by the Subfind algorithm (left panels), red dots are all selected stellar particles within a sphere with radius 20 times the stellar half-mass radius (highlighted by the dashed solid black line; right panels) and centered around the considered Subfind TDGCs, and green dots are all stellar particles which become accepted by the σ-clipping algorithm with η = 2 and δ = 0.01 (right panels). Bottom: projected stellar particle distribution with positions relative to the center-of-mass for ID 53625. For the σ-clipping, the center-of-mass position and velocity change in each iteration and also for the final accepted stellar particles (see text). |
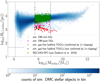 |
Fig. C.7. As in Fig. 12 (top) but for gas-free TDGCs analyzed by a σ-clipping scheme (η = 2, δ = 0.01). Red triangles are gas-free TDGCs confirmed by 2σ-clipping and black crosses are gas-free TDGCs which are according to 2σ-clipping not gravitationally bound objects. |
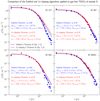 |
Fig. C.8. Radial density distributions of four selected gas-free TDGCs of sample A (IDs 372, 487, 593, and 59553) calculated by the particles identified by the Subfind (blue) and σ-clipping (η = 2 and δ = 0.01; red) algorithms and fitted with a Plummer model (Eq. (C.2)). The radial bins have a width of 100 pc. The identification number, ID, their corresponding virial ratios, q (Eq. (C.1)), and their fitting parameters are given in the panels. The kinetic and potential energy for the Subfind algorithm are taken form Zjupa & Springel (2017) and the calculation for the potential energy using particles identified by σ-clipping assumes a fixed softening length in Eq. (C.11). We note that q is computed solely for the particles selected using Subfind or 2σ-clipping. |
All Tables
Number of DMC DGs for different selection criteria identified at redshift z = 0.
Probability of finding a NGC 1052-DF2-like galaxy in the Illustris-1 simulation at redshift z = 0.
Medians of simulated stellar half-mass radii, R0.5 stellar, for dispersion-dominated (κrot < 0.5) DMC stellar objects, DMC DGs, and TDGCs samples for different stellar mass ranges.
Properties of the discussed and depicted stellar objects identified at redshift z = 0 and shown in Fig. A.1.
Virial ratio, q (Eq. (C.1)), for TDGC samples and DMC DGs at redshift z = 0 as resulting from the Subfind algorithm.
Virial ratio, q (Eq. (C.1)), for gas-free TDGCs of sample A calculated by the stellar particles identified by the Subfind and σ-clipping algorithms.
All Figures
|
Fig. 1. Distribution of the 3D distance-criterion parameter, Dcr (Eq. (1)), for TDGCs of sample A at redshift z = 0. The dashed red and the solid blue lines highlight the median and the mean of the distribution, respectively. |
| In the text | |
|
Fig. 2. Time evolution of the gas distribution weighted by the logarithm of the gas cell mass and with position relative to the subhalo center of host galaxies. The TDGC and DM-poor objects identified at z = 0 are being backtraced by their individual stellar particle IDs and are highlighted in the panels until stellar particles can no longer be found in their subhalo. The lookback time of the corresponding snapshot is given in the upper-right corner of the panels. a) Host galaxy ID 404871 with the TDGC of sample B ID 404882 (red circle), DM-poor substructure ID 404873 (blue square), and the subhalo ID 404879 (green down-pointing triangle) being identified at z = 0 (see also Fig. A.1 and the movie “ID404871.mp4” in the supplementary information). The subhalo ID 404879 has Mstellar = 2.2 × 10⁷ M⊙ and thus does not fulfill our criteria for a DM-poor DG (see Table 2). A close encounter of two galaxies happens at a lookback time of about 1.6 Gyr creating a large extended tidal arm in which these dark matter-lacking subhalos are identified. b) Host galaxy ID 73663 with the TDGCs ID 74010 (DF2-like; red circle) and ID 74810 (green down-pointing triangle) being identified at z = 0 (both of sample A; see also Sect. 3.2 and the movies “ID73663.mp4” and “ID73663_zoom.mp4”). A galaxy merger occurs at a lookback time of around 1.9 Gyr. c) Host galaxy ID 150872 with the TDGCs of sample B ID 151014 (red circle), ID 151271 (blue square), ID 151299 (black up-pointing triangle), ID 151878 (magenta diamond), and ID 151332 (green down-pointing triangle) formed by an interaction around 1.9 Gyr ago (see the movie “ID150872.mp4”). d) Host galaxy ID 138 with the DMF substructures ID 878 (red circle) and ID 1683 (green down-pointing triangle) being identified at z = 0 (see also Fig. A.1 and the movies “ID138.mp4”). These are not TDGs because they form from gas ram-pressure stripped from the host ID 138. Ram-pressure stripping can be observed at a lookback time ≲1 Gyr. |
| In the text | |
|
Fig. 3. Gas (green), stellar (red), and dark matter (black) mass evolution of TDGCs and DM-poor objects shown in Fig. 2 starting from the first time step at which the first stellar particles in their subhalos appeared. Their ID numbers are given in the upper-right corner of the panels and the discussed subhalos of each row belong to the same host galaxy. The subhalo ID 404879 has Mstellar = 2.2 × 10⁷ M⊙, Mgas = 3.0 × 10⁸ M⊙, and Mdm = 6.3 × 10⁶ M⊙ and is thus not included in the main sample of DMC (-poor) DGs (see Table 2). The dashed and long-dashed horizontal lines indicate the initial baryonic (1.26 × 10⁶ M⊙) and dark matter mass (6.26 × 10⁶ M⊙) of a particle. The dark matter content is short lived and is due to individual dark matter particles crossing the objects. |
| In the text | |
|
Fig. 4. Examples of Subfind Starburst 99 (SB99) images of the most massive dispersion- (left; ID 0, κrot = 0.28, Mstellar + gas = 2.9 × 10¹³ M⊙, Mdm = 2.9 × 10¹⁴ M⊙) and most massive rotation-dominated (right; ID 283832, κrot = 0.61, Mstellar + gas = 4.9 × 10¹¹ M⊙, Mdm = 6.7 × 10¹² M⊙) galaxy in the Illustris-1 simulation at redshift z = 0. The image field of view (FoV) is ten times the stellar half-mass radius, R0.5 stellar, of the shown galaxy. Credit: Illustris Galaxy Observatory http://www.illustris-project.org/galaxy_obs/ [25.08.2018]. |
| In the text | |
|
Fig. 5. Degree of the phase-space correlation, σorbit (Eq. (3)), for TDGCs of sample A (red) and sample B (orange) and DMC DGs (green). The histograms have a bin width of Δσorbit = 0.05. |
| In the text | |
|
Fig. 6. Stellar mass, Mstellar, (top) and total mass, Mtotal, (bottom) distributions of TDGCs (sample A) at redshift z = 0. The dashed vertical line illustrates the minimum stellar mass criterion of 5 × 10⁷ M⊙. The histograms have a bin width of log10(ΔMstellar/[M⊙]) = 0.10 and log10(ΔMtotal/[M⊙]) = 0.10. |
| In the text | |
|
Fig. 7. Distribution of the age of the oldest stellar particles within dwarf galaxies identified at redshift z = 0. The histograms have a bin width of Δt = 0.2 Gyr. The statistics of the distributions shown here are listed in Table 6. |
| In the text | |
|
Fig. 8. Distribution of the κrot morphological parameter for DMC DGs (green) and TDGCs (red) with Mstellar > 5 × 10⁷ M⊙ (sample A). DMC DGs and TDGCs are divided into rotation- and dispersion-dominated objects at κrot = 0.5 (dashed black line). The histograms have a bin width of Δκrot = 0.05. |
| In the text | |
|
Fig. 9. Top: total host halo mass, |
| In the text | |
|
Fig. 10. Proper radius containing half of the stellar mass, R0.5 stellar, as a function of the stellar mass, Mstellar, of simulated stellar objects at redshift z = 0. Blue bins are DMC and red dots are DMF stellar objects. The stellar masses and the total half-mass radii of simulated TDGs by Fouquet et al. (2012) are shown as black crosses. A few DMC stellar objects can also be found in the regions of DMF stellar objects. The properties of these DMC stellar objects are studied in Fig. 11. The dashed vertical and horizontal lines indicate the initial baryonic matter mass of a particle (1.26 × 10⁶ M⊙) and the smallest fiducial cell size (48 pc) of the Illustris-1 run, respectively. Subhalos with a stellar half-mass radius below the cell resolution are not shown in the plots. The yellow star shows the position of NGC 1052-DF2 with Mstellar = 2 × 10⁸ M⊙ and a 3D deprojected half-light radius of 2.7 kpc (van Dokkum et al. 2018a). |
| In the text | |
|
Fig. 11. Proper radius containing half of the stellar mass, R0.5 stellar, as a function of the stellar mass, Mstellar, of simulated DMC stellar objects at redshift z = 0. Dark matter-containing stellar objects are separated in dark matter-rich (Mdm/Mbaryonic ≥ 1; blue bins) and dark matter-poor (Mdm/Mbaryonic < 1; purple crosses) types. The yellow star shows the position of NGC 1052-DF2 with Mstellar = 2 × 10⁸ M⊙ and a 3D deprojected half-light radius of 2.7 kpc (van Dokkum et al. 2018a). The dashed vertical and horizontal lines indicate the initial baryonic matter mass of a particle (1.26 × 10⁶ M⊙) and the smallest fiducial cell size (48 pc). Subhalos with a stellar half-mass radius below the cell resolution are not shown in the plots. The histograms are normalized such that the total area is equal to 1.0 and such that they have bin widths of log10(ΔMstellar/[M⊙]) = 0.10 and log10(ΔR0.5 stellar/[pc]) = 0.10. |
| In the text | |
|
Fig. 12. Top: proper radius containing half of the stellar mass, R0.5 stellar, as a function of the stellar mass, Mstellar, of simulated stellar objects at redshift z = 0. Blue bins are DMC stellar objects, green dots are DM-rich DGs (Mdm/Mbaryonic ≥ 1), magenta squares are DM-poor DGs (Mdm/Mbaryonic < 1), and red triangles are TDGCs. The stellar masses and the total half-mass radii of simulated TDGs by Fouquet et al. (2012) are shown as black crosses. Pink circles are simulated TDGCs identified in the EAGLE simulations by Ploeckinger et al. (2018). Bottom: masses and radii of the simulated stellar objects compared with the 3D deprojected half-light radii of observed galaxies. The colors here refer to the same objects as in the top panel, but only dispersion-dominated (κrot < 0.5) TDGCs and DMC DGs are shown. Gray circles are early-type galaxies from faint dwarf spheroidals to giant ellipticals taken from Dabringhausen & Fellhauer (2016). Orange diamonds are ultra compact dwarf galaxies (UCDs) and globular clusters (GCs) taken from Mieske et al. (2008, 2013). The stellar masses of UCDs and GCs are calculated by assuming a constant stellar mass-to-light ratio in the V-band of |
| In the text | |
|
Fig. 13. KS test for all and dispersion-dominated (κrot < 0.5) simulated DMC DGs (green) and TDGCs (red) in the 5 × 10⁷−109 M⊙ stellar mass regime at redshift z = 0. |
| In the text | |
|
Fig. 14. Median, first, and third quartile of simulated stellar half-mass radii, R0.5 stellar, of dispersion-dominated (κrot < 0.5) objects and 3D deprojected half-light radii, R0.5 light, of observed early type galaxies for different stellar mass bins (107−108 M⊙, 108−109 M⊙, 109−1010 M⊙, 1010−1011 M⊙, and 1011−1012 M⊙). Blue right triangles are DM-rich stellar objects, purple crosses are DM-poor stellar objects, green dots are DM-rich DGs, magenta squares are DM-poor DGs, and red triangles are TDGCs (see Table 3). Gray open circles are observed early-type galaxies taken from Dabringhausen & Fellhauer (2016). The yellow star shows the position of NGC 1052-DF2 with Mstellar = 2 × 10⁸ M⊙ and a 3D deprojected half-light radius of 2.7 kpc (van Dokkum et al. 2018a). The medians of simulated and observed galaxies for different mass ranges are listed in Table 7. |
| In the text | |
|
Fig. 15. KS test for observed late-type galaxies (gray) and dispersion-dominated (κrot < 0.5) simulated (red, green) DGs with stellar masses between 5 × 10⁷ M⊙ and 109 M⊙. The thick lines and the displayed da- and Pa-values refer to the real stellar half-mass radius distribution of the Illustris-1 simulation. The thin lines and the db- and Pb-values refer to a distribution in which all radii in the Illustris-1 simulation are divided by two (see text). The observational data are a subset of the catalog from Dabringhausen & Fellhauer (2016) including all galaxies from the Fornax, Hydra, and Centaurus cluster catalog with stellar masses between 5 × 10⁷ M⊙ and 109 M⊙. |
| In the text | |
|
Fig. 16. Time evolution of the co-moving number density of TDGCs, nTDGCs, identified with the same selection criteria as for sample A. The x-axis shows the lookback time in gigayears (i.e., 0 Gyr corresponds to the present time) and redshift z. |
| In the text | |
|
Fig. A.1. Projected stellar luminosity (left panels) and gas density (right panels) of the environment of the host galaxy ID 404871 (top panels) and ID 138 (bottom panels) at redshift z = 0. Top panels: stellar objects (1)–(3) close to ID 404871 (the white circle marks the host galaxy) are explained in the figure legend. Bottom panels: stellar objects (1) and (2) are identified as DMF substructures of the host galaxy ID 138 (the white circle as above). The luminous galaxy in the lower-right corner is a foreground galaxy, which has a 3D separation of 1626 kpc to the galaxy ID 138. Credits: http://www.illustris-project.org/explorer/ [13.08.2018]. |
| In the text | |
|
Fig. B.1. Stellar (top) and gas (bottom) mass-weighted average metallicity, Zstellar and Zgas, respectively, in dependence of the stellar mass, Mstellar, and gas mass, Mgas. The stellar and gas mass-weighted average metallicities, Zstellar and Zgas, are defined by Eq. (B.1). Blue bins are DMC stellar objects, green dots are DM-rich DGs (Mdm/Mbaryonic ≥ 1), magenta squares are DM-poor DGs (Mdm/Mbaryonic < 1), and red triangles are TDGCs of sample A. |
| In the text | |
|
Fig. C.1. Relation between the potential and kinetic energy for all TDGCs of sample A. The colorbar presents the stellar mass, Mstellar, of the TDGCs. The black solid lines highlight the condition for virial equilibrium, i.e., where the virial ratio becomes q = 1 (see Eq. (C.1)). All objects above the black dashed line are gravitationally bound (q < 2). |
| In the text | |
|
Fig. C.2. Radial density distributions of four selected gas-free TDGCs of sample A (IDs 372, 487, 593, and 59553) fitted with a Plummer model (green; Eq. (C.2)) and an exponential function (red; Eq. (C.4)). The radial bins have a width of 100 pc. The identification number, ID, their corresponding virial ratios, q (Eq. (C.1)), their total masses and stellar half-mass radii obtained from the Subfind algorithm, and their fitting parameters are given in the panels. According to the particles identified by the Subfind algorithm, the TDGCs shown here are not fully in virial equilibrium. The rotation curves and 3D velocity dispersion of the TDGCs discussed here are shown in Fig. C.3 and Fig. C.4. |
| In the text | |
|
Fig. C.3. Rotation curves and radial 3D velocity dispersion distributions (top), and the radial distribution of stellar particle ages (bottom) of gas-free TDGCs of sample A with the ID 372 and ID 487. The radial bins have a width of 100 pc. The error bars in the bottom panels correspond to the standard deviation of the stellar particle age within a radial bin. The identification number, ID, and their corresponding virial ratios, q (Eq. (C.1)), are given in the panels. The radial density distributions of the TDGCs discussed here are shown in Fig. C.2. |
| In the text | |
|
Fig. C.4. As in Fig. C.3 but for gas-free TDGCs of sample A with the ID 593 and ID 59553. The radial density distributions of the here discussed TDGCs are shown in Fig. C.2. |
| In the text | |
|
Fig. C.5. Relation between the potential and kinetic energy for gas-free TDGCs of sample A calculated by the Subfind and σ-clipping (η = 2, 3; δ = 0.01) algorithms. The black solid line highlights the condition for virial equilibrium, i.e., where the virial ratio becomes q = 1 (see Eq. (C.1)). All objects above the black dashed line are gravitationally bound (q < 2). The kinetic and potential energy for the Subfind algorithm are taken form Zjupa & Springel (2017) and the calculation for the potential energy using particles identified by σ-clipping assumes a fixed softening length in Eq. (C.11). |
| In the text | |
|
Fig. C.6. Top three panels: modulus of the position and velocity vectors with respect to the center-of-mass for stellar particles (see Eq. (C.7)). Blue dots are stellar particles identified by the Subfind algorithm (left panels), red dots are all selected stellar particles within a sphere with radius 20 times the stellar half-mass radius (highlighted by the dashed solid black line; right panels) and centered around the considered Subfind TDGCs, and green dots are all stellar particles which become accepted by the σ-clipping algorithm with η = 2 and δ = 0.01 (right panels). Bottom: projected stellar particle distribution with positions relative to the center-of-mass for ID 53625. For the σ-clipping, the center-of-mass position and velocity change in each iteration and also for the final accepted stellar particles (see text). |
| In the text | |
|
Fig. C.7. As in Fig. 12 (top) but for gas-free TDGCs analyzed by a σ-clipping scheme (η = 2, δ = 0.01). Red triangles are gas-free TDGCs confirmed by 2σ-clipping and black crosses are gas-free TDGCs which are according to 2σ-clipping not gravitationally bound objects. |
| In the text | |
|
Fig. C.8. Radial density distributions of four selected gas-free TDGCs of sample A (IDs 372, 487, 593, and 59553) calculated by the particles identified by the Subfind (blue) and σ-clipping (η = 2 and δ = 0.01; red) algorithms and fitted with a Plummer model (Eq. (C.2)). The radial bins have a width of 100 pc. The identification number, ID, their corresponding virial ratios, q (Eq. (C.1)), and their fitting parameters are given in the panels. The kinetic and potential energy for the Subfind algorithm are taken form Zjupa & Springel (2017) and the calculation for the potential energy using particles identified by σ-clipping assumes a fixed softening length in Eq. (C.11). We note that q is computed solely for the particles selected using Subfind or 2σ-clipping. |
| In the text | |
Current usage metrics show cumulative count of Article Views (full-text article views including HTML views, PDF and ePub downloads, according to the available data) and Abstracts Views on Vision4Press platform.
Data correspond to usage on the plateform after 2015. The current usage metrics is available 48-96 hours after online publication and is updated daily on week days.
Initial download of the metrics may take a while.