Free Access
Fig. 16.
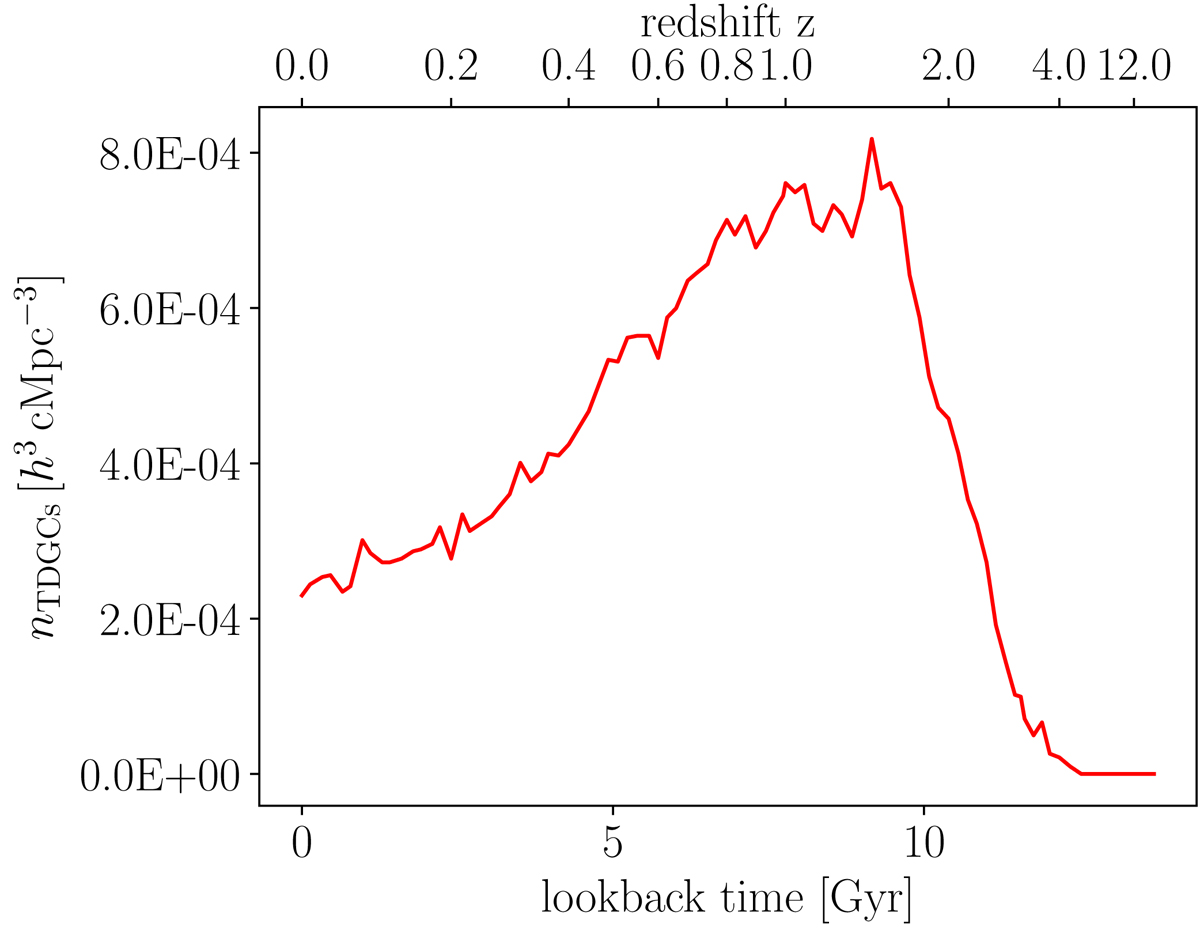
Time evolution of the co-moving number density of TDGCs, nTDGCs, identified with the same selection criteria as for sample A. The x-axis shows the lookback time in gigayears (i.e., 0 Gyr corresponds to the present time) and redshift z.
Current usage metrics show cumulative count of Article Views (full-text article views including HTML views, PDF and ePub downloads, according to the available data) and Abstracts Views on Vision4Press platform.
Data correspond to usage on the plateform after 2015. The current usage metrics is available 48-96 hours after online publication and is updated daily on week days.
Initial download of the metrics may take a while.