Fig. 2.
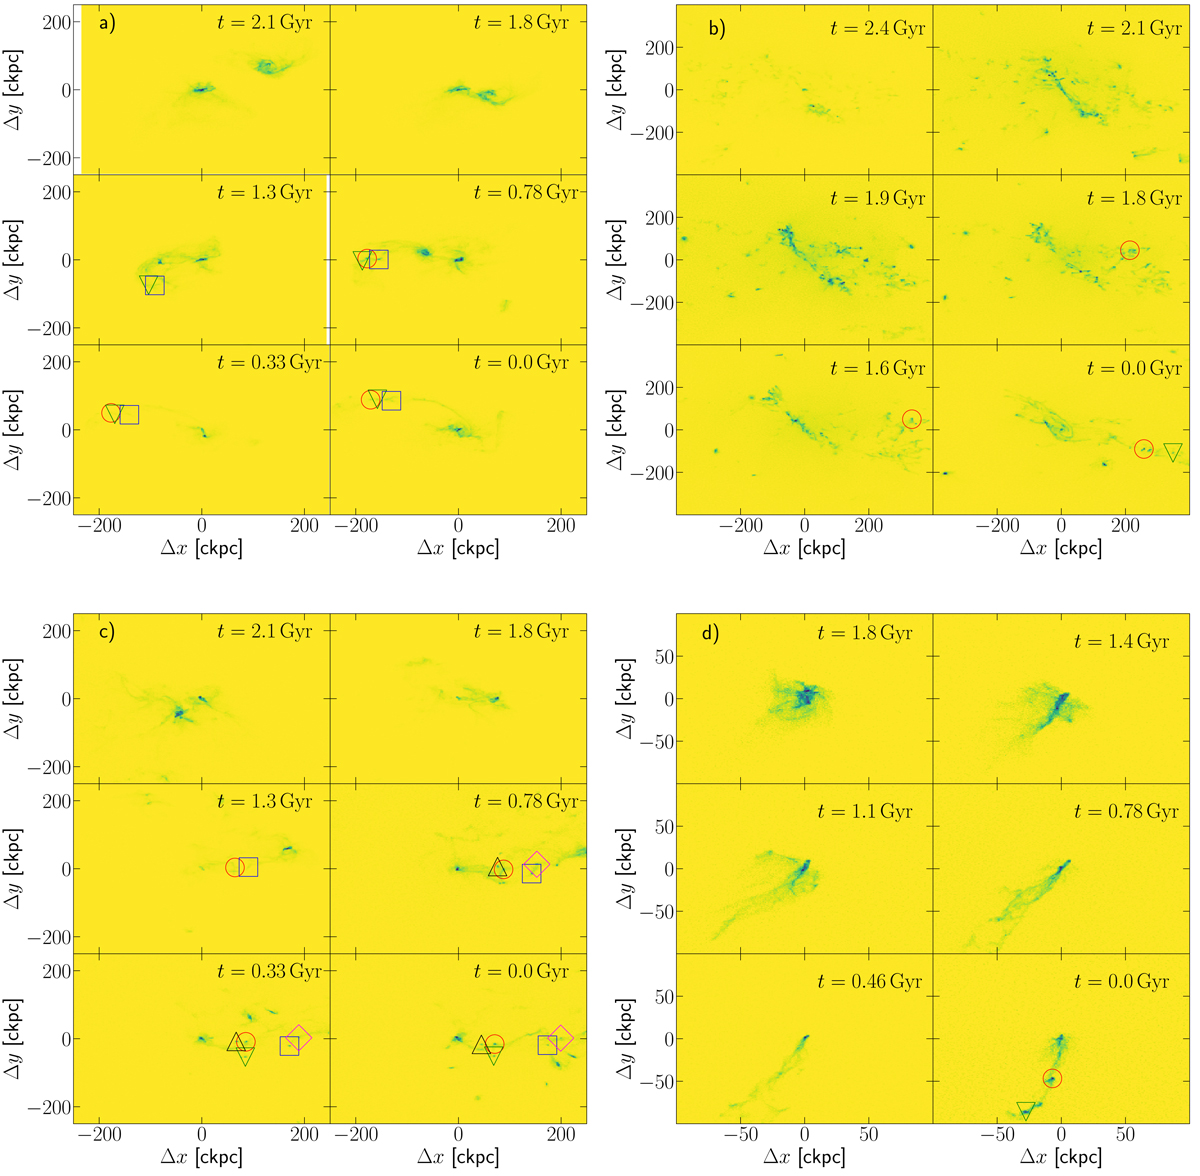
Time evolution of the gas distribution weighted by the logarithm of the gas cell mass and with position relative to the subhalo center of host galaxies. The TDGC and DM-poor objects identified at z = 0 are being backtraced by their individual stellar particle IDs and are highlighted in the panels until stellar particles can no longer be found in their subhalo. The lookback time of the corresponding snapshot is given in the upper-right corner of the panels. a) Host galaxy ID 404871 with the TDGC of sample B ID 404882 (red circle), DM-poor substructure ID 404873 (blue square), and the subhalo ID 404879 (green down-pointing triangle) being identified at z = 0 (see also Fig. A.1 and the movie “ID404871.mp4” in the supplementary information). The subhalo ID 404879 has Mstellar = 2.2 × 10⁷ M⊙ and thus does not fulfill our criteria for a DM-poor DG (see Table 2). A close encounter of two galaxies happens at a lookback time of about 1.6 Gyr creating a large extended tidal arm in which these dark matter-lacking subhalos are identified. b) Host galaxy ID 73663 with the TDGCs ID 74010 (DF2-like; red circle) and ID 74810 (green down-pointing triangle) being identified at z = 0 (both of sample A; see also Sect. 3.2 and the movies “ID73663.mp4” and “ID73663_zoom.mp4”). A galaxy merger occurs at a lookback time of around 1.9 Gyr. c) Host galaxy ID 150872 with the TDGCs of sample B ID 151014 (red circle), ID 151271 (blue square), ID 151299 (black up-pointing triangle), ID 151878 (magenta diamond), and ID 151332 (green down-pointing triangle) formed by an interaction around 1.9 Gyr ago (see the movie “ID150872.mp4”). d) Host galaxy ID 138 with the DMF substructures ID 878 (red circle) and ID 1683 (green down-pointing triangle) being identified at z = 0 (see also Fig. A.1 and the movies “ID138.mp4”). These are not TDGs because they form from gas ram-pressure stripped from the host ID 138. Ram-pressure stripping can be observed at a lookback time ≲1 Gyr.
Current usage metrics show cumulative count of Article Views (full-text article views including HTML views, PDF and ePub downloads, according to the available data) and Abstracts Views on Vision4Press platform.
Data correspond to usage on the plateform after 2015. The current usage metrics is available 48-96 hours after online publication and is updated daily on week days.
Initial download of the metrics may take a while.