Fig. 12.
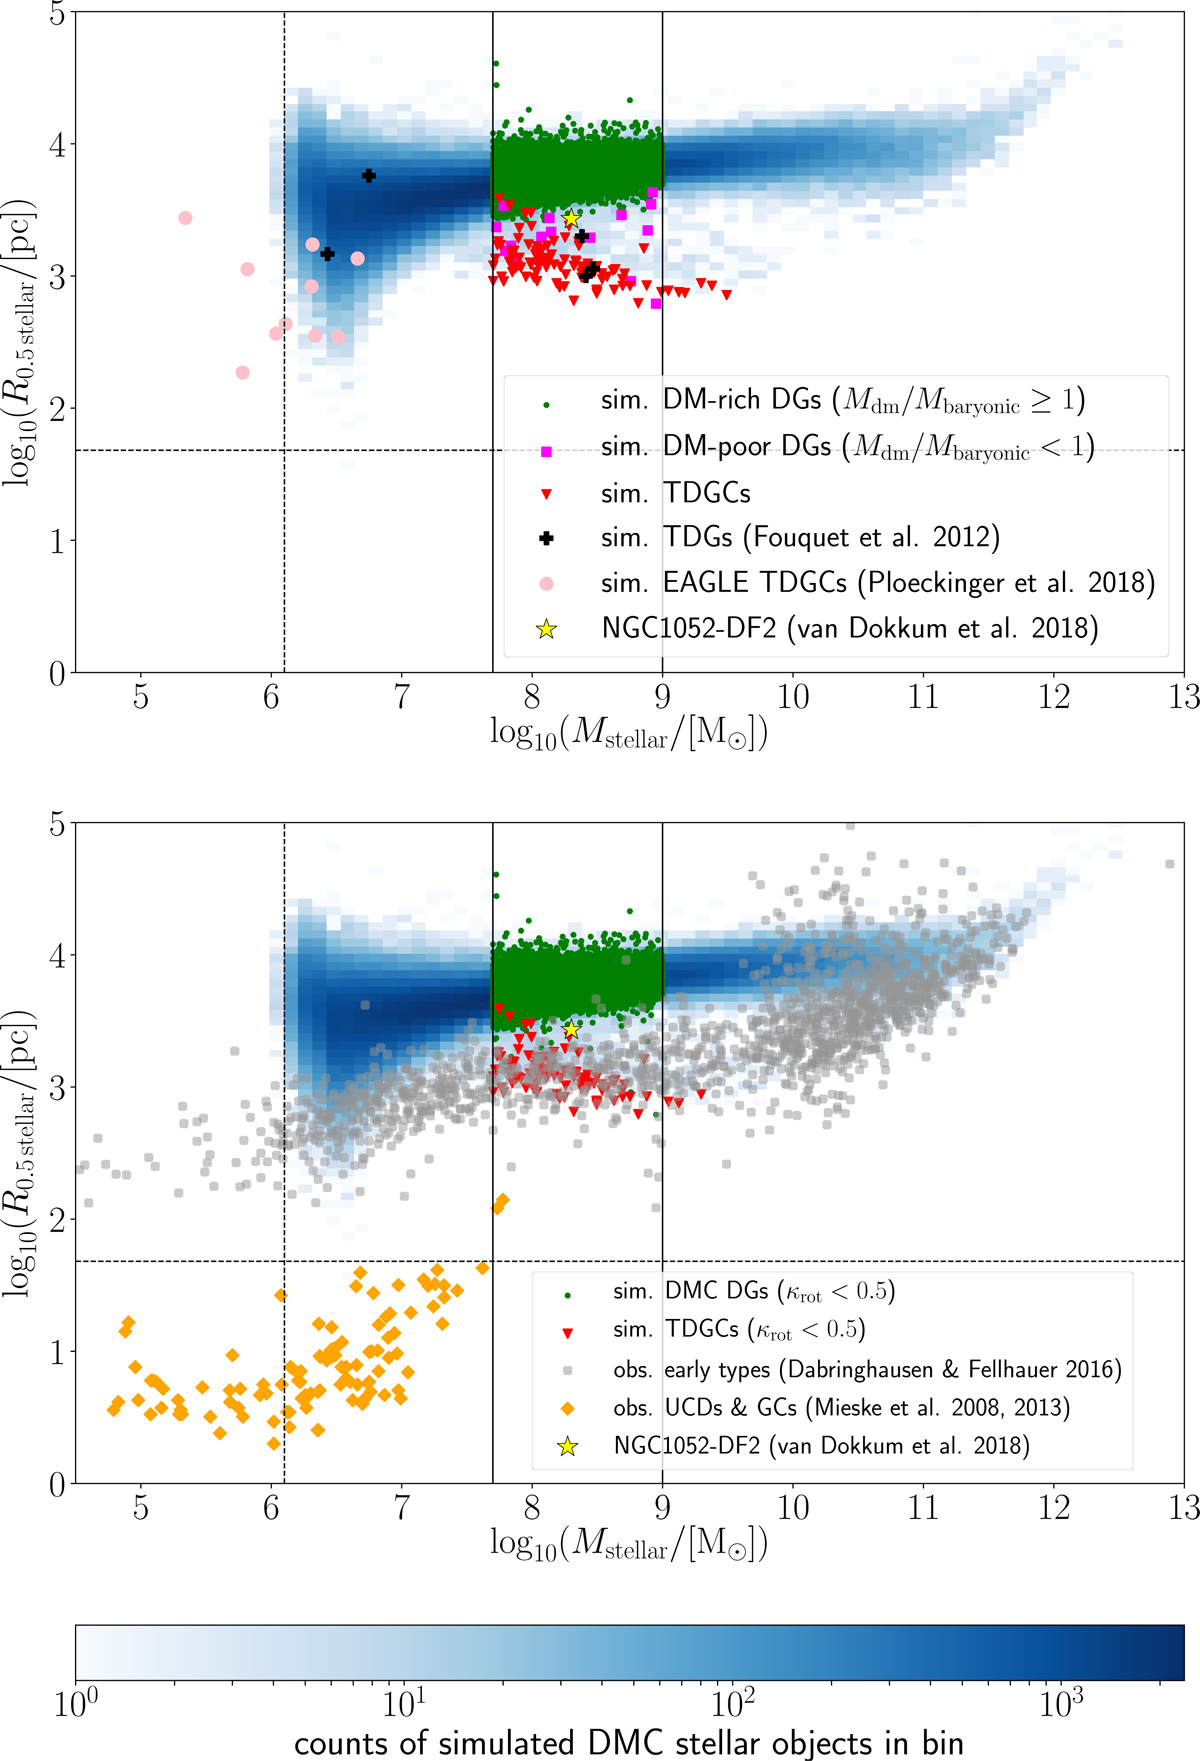
Top: proper radius containing half of the stellar mass, R0.5 stellar, as a function of the stellar mass, Mstellar, of simulated stellar objects at redshift z = 0. Blue bins are DMC stellar objects, green dots are DM-rich DGs (Mdm/Mbaryonic ≥ 1), magenta squares are DM-poor DGs (Mdm/Mbaryonic < 1), and red triangles are TDGCs. The stellar masses and the total half-mass radii of simulated TDGs by Fouquet et al. (2012) are shown as black crosses. Pink circles are simulated TDGCs identified in the EAGLE simulations by Ploeckinger et al. (2018). Bottom: masses and radii of the simulated stellar objects compared with the 3D deprojected half-light radii of observed galaxies. The colors here refer to the same objects as in the top panel, but only dispersion-dominated (κrot < 0.5) TDGCs and DMC DGs are shown. Gray circles are early-type galaxies from faint dwarf spheroidals to giant ellipticals taken from Dabringhausen & Fellhauer (2016). Orange diamonds are ultra compact dwarf galaxies (UCDs) and globular clusters (GCs) taken from Mieske et al. (2008, 2013). The stellar masses of UCDs and GCs are calculated by assuming a constant stellar mass-to-light ratio in the V-band of ![]() . The yellow star shows the position in the radius–mass plane of the ultra-diffuse galaxy NGC 1052-DF2, which has Mstellar = 2 × 10⁸ M⊙ and a 3D deprojected half-light radius of 2.7 kpc (van Dokkum et al. 2018a). The dashed vertical and horizontal lines indicate the initial baryonic matter mass of a particle (1.26 × 10⁶ M⊙) and the smallest fiducial cell size (48 pc). Subhalos with a stellar half-mass radius below the cell resolution are not shown in the plots. The KS-test is applied for dwarf galaxies with stellar masses between 5 × 10⁷ M⊙ and 109 M⊙ marked by the two solid vertical black lines.
. The yellow star shows the position in the radius–mass plane of the ultra-diffuse galaxy NGC 1052-DF2, which has Mstellar = 2 × 10⁸ M⊙ and a 3D deprojected half-light radius of 2.7 kpc (van Dokkum et al. 2018a). The dashed vertical and horizontal lines indicate the initial baryonic matter mass of a particle (1.26 × 10⁶ M⊙) and the smallest fiducial cell size (48 pc). Subhalos with a stellar half-mass radius below the cell resolution are not shown in the plots. The KS-test is applied for dwarf galaxies with stellar masses between 5 × 10⁷ M⊙ and 109 M⊙ marked by the two solid vertical black lines.
Current usage metrics show cumulative count of Article Views (full-text article views including HTML views, PDF and ePub downloads, according to the available data) and Abstracts Views on Vision4Press platform.
Data correspond to usage on the plateform after 2015. The current usage metrics is available 48-96 hours after online publication and is updated daily on week days.
Initial download of the metrics may take a while.