Fig. C.6.
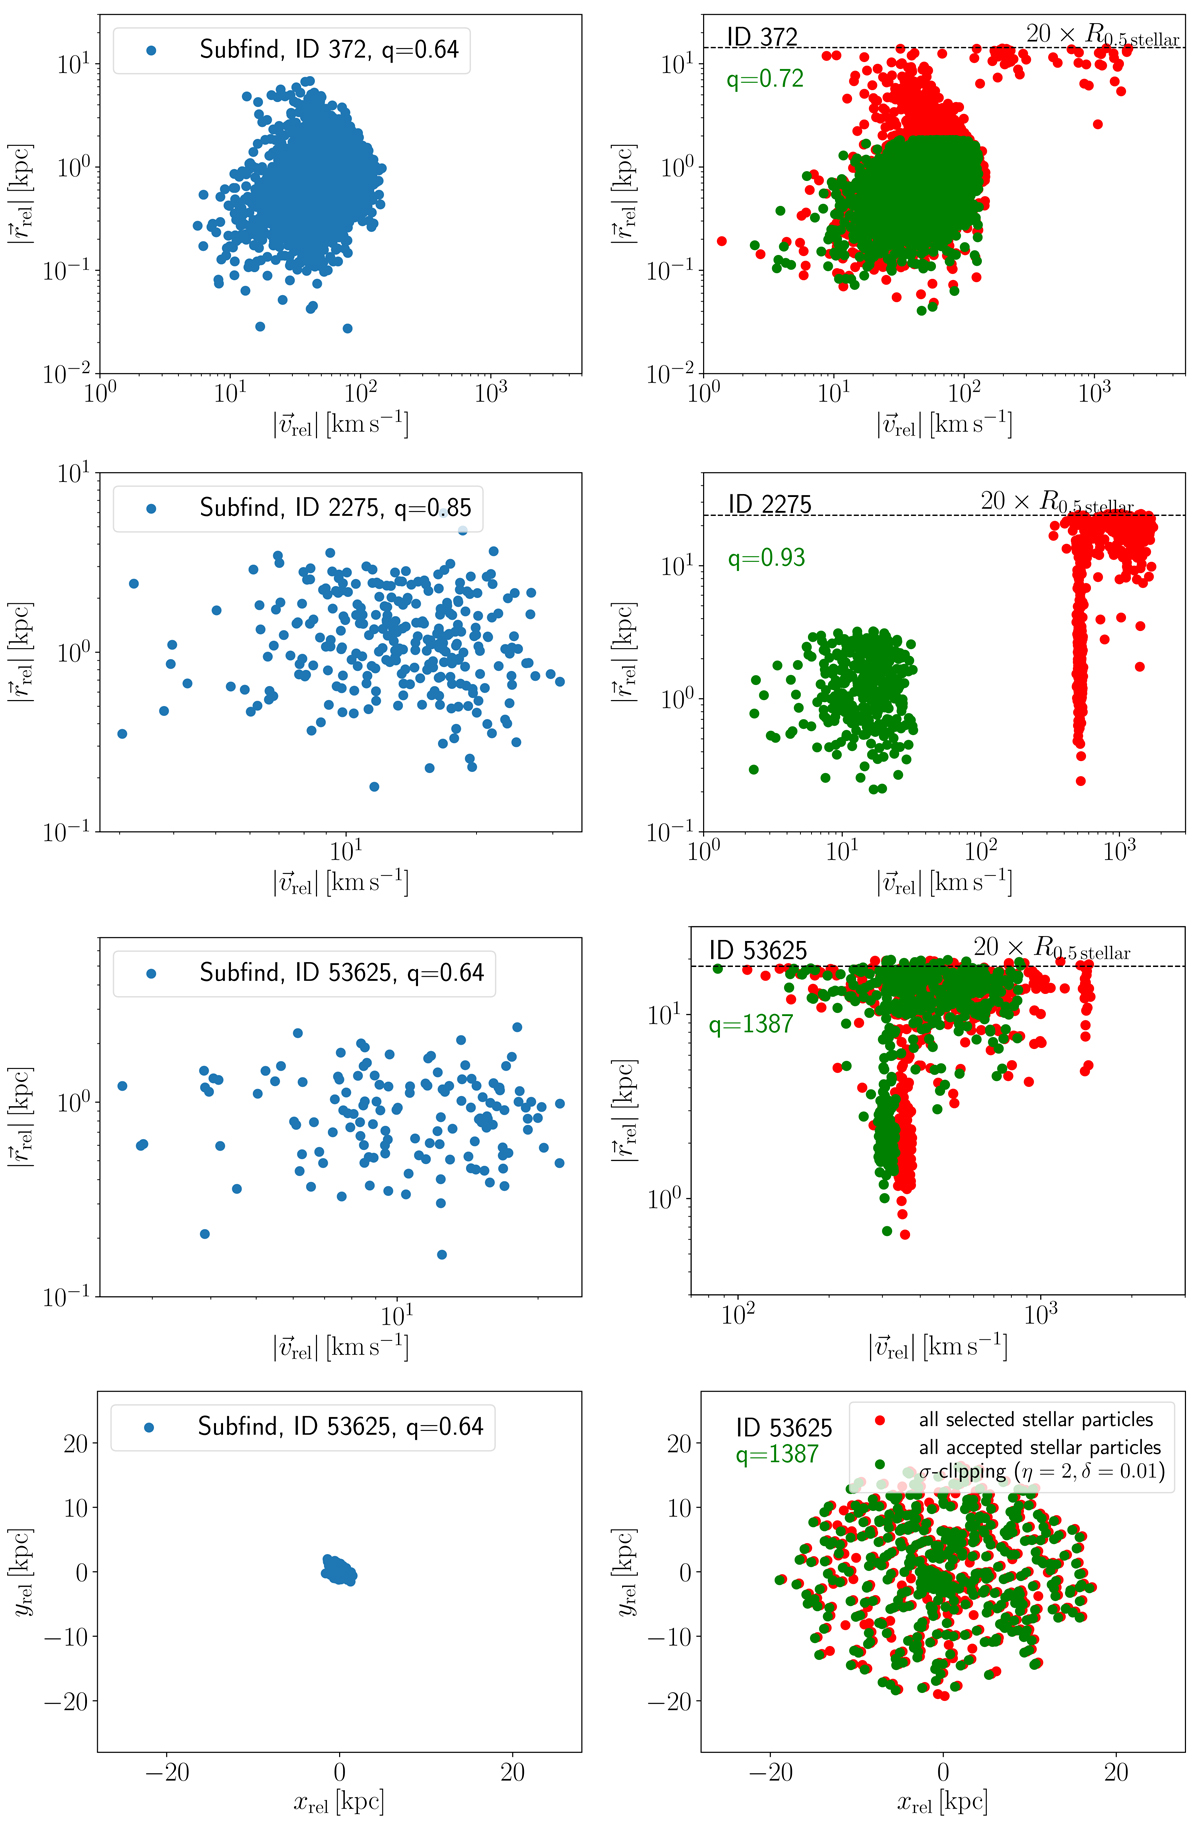
Top three panels: modulus of the position and velocity vectors with respect to the center-of-mass for stellar particles (see Eq. (C.7)). Blue dots are stellar particles identified by the Subfind algorithm (left panels), red dots are all selected stellar particles within a sphere with radius 20 times the stellar half-mass radius (highlighted by the dashed solid black line; right panels) and centered around the considered Subfind TDGCs, and green dots are all stellar particles which become accepted by the σ-clipping algorithm with η = 2 and δ = 0.01 (right panels). Bottom: projected stellar particle distribution with positions relative to the center-of-mass for ID 53625. For the σ-clipping, the center-of-mass position and velocity change in each iteration and also for the final accepted stellar particles (see text).
Current usage metrics show cumulative count of Article Views (full-text article views including HTML views, PDF and ePub downloads, according to the available data) and Abstracts Views on Vision4Press platform.
Data correspond to usage on the plateform after 2015. The current usage metrics is available 48-96 hours after online publication and is updated daily on week days.
Initial download of the metrics may take a while.