Fig. 9.
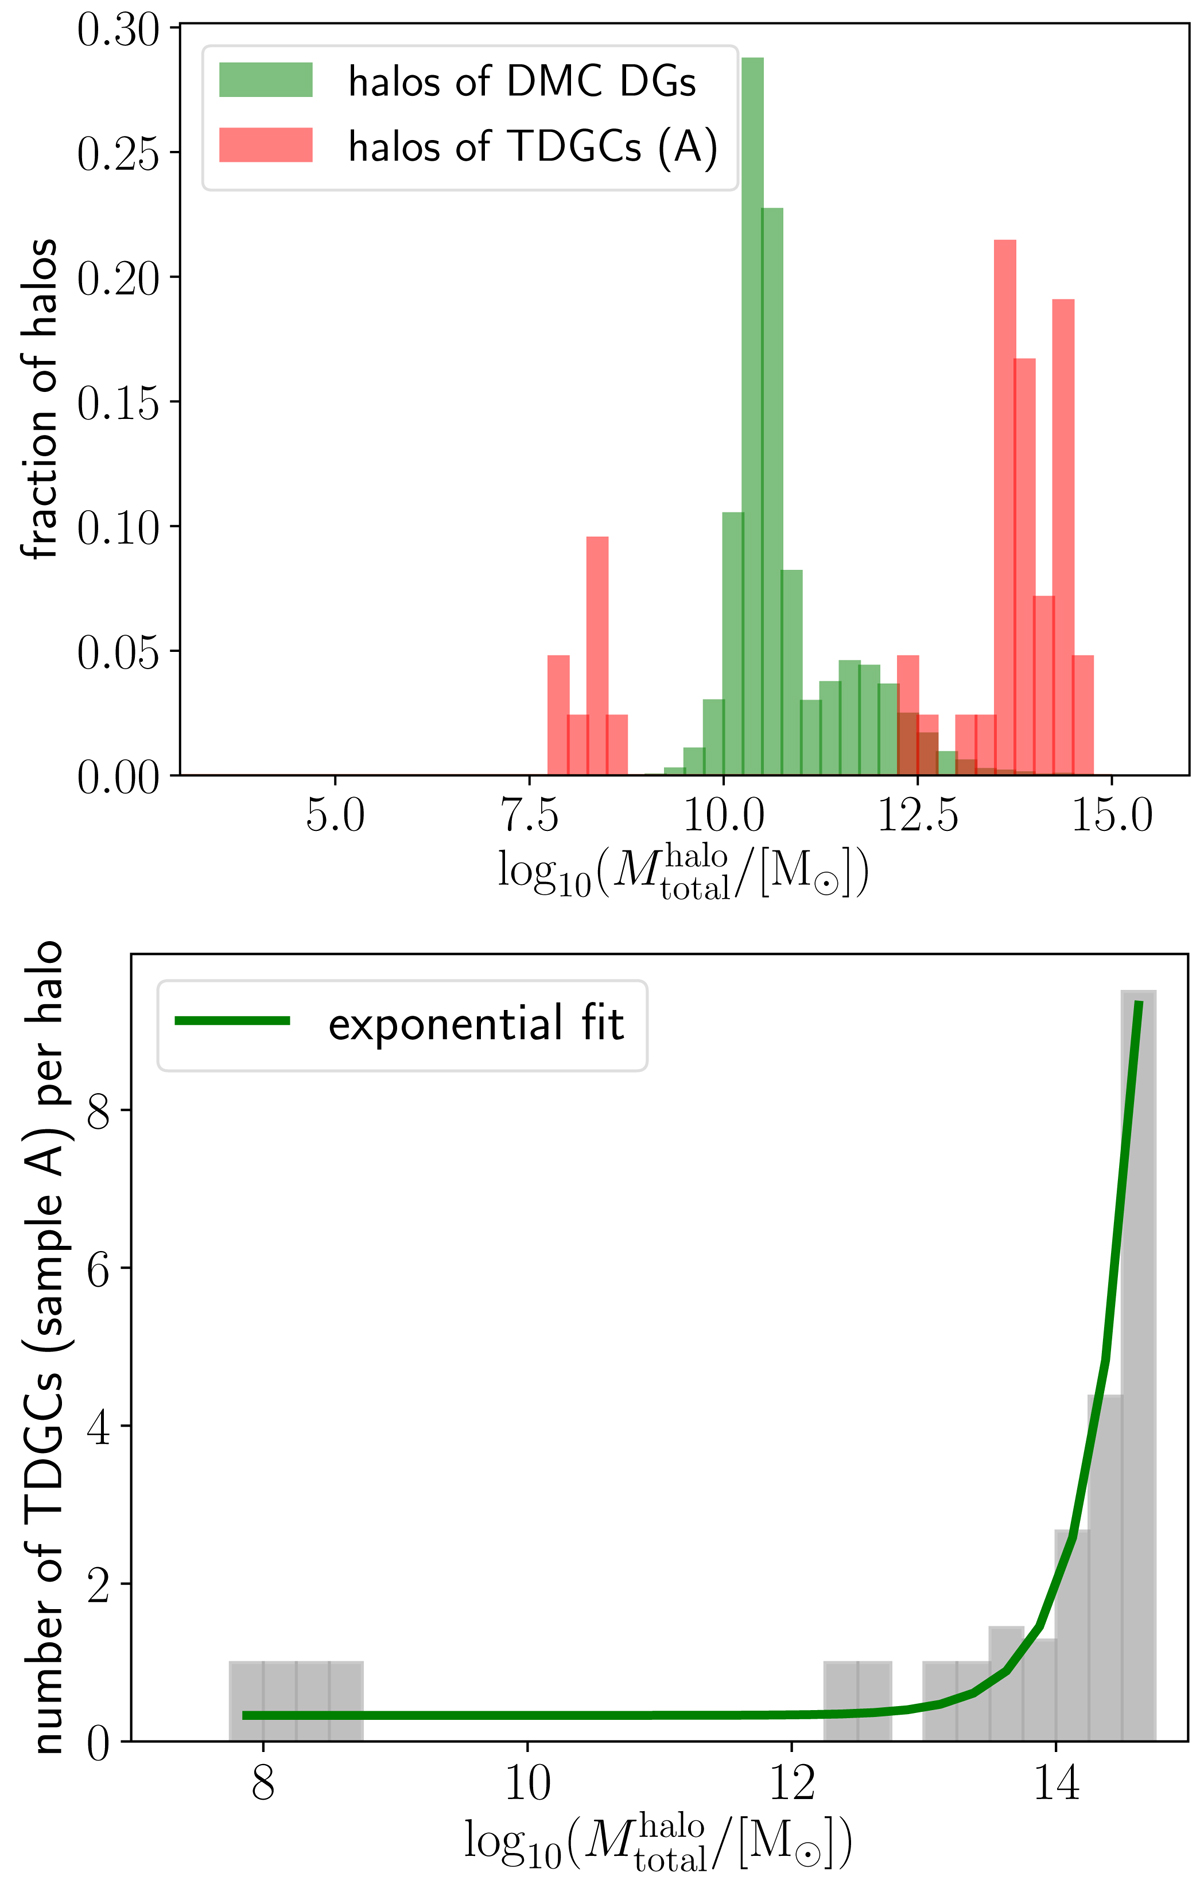
Top: total host halo mass, ![]() , distribution of host halos in which at least one DMC DG (green) is embedded is shown in green and in which at least one TDGC of sample A is embedded is shown in red for redshift z = 0. Bottom: distribution of the number of TDGCs (sample A) per host halo at redshift z = 0. The histogram is fitted with an exponential function (solid green line) given by Eq. (7). The fitting parameters are listed in the text. The histograms have a bin width of
, distribution of host halos in which at least one DMC DG (green) is embedded is shown in green and in which at least one TDGC of sample A is embedded is shown in red for redshift z = 0. Bottom: distribution of the number of TDGCs (sample A) per host halo at redshift z = 0. The histogram is fitted with an exponential function (solid green line) given by Eq. (7). The fitting parameters are listed in the text. The histograms have a bin width of ![]() .
.
Current usage metrics show cumulative count of Article Views (full-text article views including HTML views, PDF and ePub downloads, according to the available data) and Abstracts Views on Vision4Press platform.
Data correspond to usage on the plateform after 2015. The current usage metrics is available 48-96 hours after online publication and is updated daily on week days.
Initial download of the metrics may take a while.