| Issue |
A&A
Volume 624, April 2019
|
|
|---|---|---|
| Article Number | A136 | |
| Number of page(s) | 20 | |
| Section | Atomic, molecular, and nuclear data | |
| DOI | https://doi.org/10.1051/0004-6361/201834691 | |
| Published online | 26 April 2019 | |
Amorphous Mg–Fe silicates from microwave-dried sol–gels
Multi-scale structure, mid-IR spectroscopy and thermal crystallisation
Diamond Light Source, Harwell Science and Innovation Campus, Chilton, Didcot, Oxfordshire OX11 0QX, UK
e-mail: This email address is being protected from spambots. You need JavaScript enabled to view it.
Received:
20
November
2018
Accepted:
12
March
2019
Abstract
Context. Laboratory analogues can provide physical constraints to the interpretation of astronomical observations of cosmic dust but clearly do not experience the same formation conditions. To distinguish between properties intrinsic to the material and properties imprinted by their means of formation requires extensive characterisation.
Aims. Sol–gel methods can produce amorphous silicates with potentially high reproducibility, but often require long drying times (24+ h) at elevated temperatures in air, controlled atmosphere, or vacuum. We investigate the possibility that microwave drying can be used to form amorphous silicate on a timescale of ∼10 min and characterise their structural and spectroscopic properties relative to silicates produced by other drying methods.
Methods. Microwave-dried amorphous MgSiO3, Fe0.1Mg0.9SiO3 and Mg2SiO4 are characterised using X-ray powder diffraction, total X-ray scattering, small angle X-ray scattering and mid-IR FTIR spectroscopy, and compared to samples produced from the same gels but dried in-air and under vacuum. The development of crystalline structure in the microwave-dried silicates via thermal annealing up to 999°C is also investigated using in situ X-ray powder diffraction.
Results. At the inter-atomic level the silicate structures are largely independent of drying method, however larger-scale structured domains, ranging from a ∼few × 10 Å to ∼100’s Å in size, are observed. These are ordered as mass fractals with discernible variation caused by the drying processes. The mid-IR 10 μm band profile is also found to be influenced by the drying process, likely due to the way removal of water and bonded OH influences the distribution of tetrahedral species. However, microwave drying also allows Fe to be easily incorporated into the silicate structure. In situ annealing shows that for amorphous MgSiO3 crystalline forsterite, enstatite and cristobalite are high temperature phases, while for Mg2SiO4 forsterite crystallises at lower temperatures followed by cristobalite at high temperature. For Fe0.1Mg0.9SiO3 the crystallisation temperature is significantly increased and only forsterite is observed. Crystalline SiO2 may be diagnostic of Mg-rich, Fe-poor grain mineralogies. The results are discussed in relation to the different thermal conditions required for dust to crystallise within protoplanetary disk lifetimes.
Conclusions. Sol–gel microwave drying provides a fast and easy method of producing amorphous Mg- and Fe,Mg-silicates of both pyroxene and olivine compositions. Their structure and spectroscopic characteristics although similar to silicates produced using other drying methods, exhibit subtle variations which are particularly manifest spectroscopically in the mid-IR, and structurally over medium- and long-range length scales.
Key words: methods: laboratory: solid state / dust / extinction / circumstellar matter / protoplanetary disks / comets: general / X-rays: general
© S. P. Thompson et al. 2019
 Open Access article, published by EDP Sciences, under the terms of the Creative Commons Attribution License (http://creativecommons.org/licenses/by/4.0), which permits unrestricted use, distribution, and reproduction in any medium, provided the original work is properly cited.
1. Introduction
Grains of cosmic dust play a significant role in the evolution of the material universe and information on their composition and physical state can be derived through a combination of astronomical observations, analysis of recovered materials and laboratory experimentation using analogue materials. This latter approach allows evolving behaviour and properties to be systematically explored, providing both physical insight to grain evolution and constraints to the interpretation of observational data.
The life cycle of dust is a complex interplay between formative, destructive and modifying processes (e.g. condensation and coagulation; sputtering and evaporation; irradiation, shocks and thermal annealing respectively). Observations have established the formation of both amorphous and crystalline silicates in the outflows of evolved stars, while in the interstellar medium (ISM) only amorphous silicates are observed (though ISM dust destruction rates may be faster than stellar production rates such that a secondary grain production mechanism may exist, Jones & Nuth 2011). The observation of crystalline silicates in the regions surrounding young stellar objects and protoplanetary disks therefore suggests the in situ evolution of precursor ISM grains, driven by physical processes within those environments (e.g. annealing, shocks, thermo-chemical reactions, evaporation, condensation and agglomeration). Unfortunately, thermodynamic arguments cannot predict the distribution of elements such as Mg and Fe between amorphous phases and the evolution of amorphous silicates in response to, say, thermal annealing can only be explored via laboratory experiments using analogues. However, the use of analogues also requires extensive laboratory characterisations to differentiate between physical properties intrinsic to the material, and therefore of likely application to cosmic matter, and those properties imparted by the specific method of preparation which, in all likelihood, is quite removed from the means by which cosmic grains form. It should also be self-evident that no single analogue can simulate all of the dust in all of the environments accessible to observation. Simulating cosmic dust by analogues is therefore as much about understanding the analogues themselves – to define their limits of applicability – as it is about understanding cosmic grains.
Day (1974, 1976a,b) first produced amorphous MgSiO3 pyroxene and Mg2SiO4 olivine analogues via inorganic sol–gel reactions (Sabatier 1950):
 (1)
(1)
 (2)
(2)
where sol/gel denote solution and gel. However Eqs. (1) and (2) are misleading as discrete oxides are not directly precipitated, rather, an extended gel network progressively forms by hydrolytic polycondensation. Rapid mixing/stirring of the precursor solutions is important as slow mixing can result in crystalline silicate. A syneresis, or aging, step is often employed, to “rest” the gel to allow condensation to continue and solvent to be expelled while the gel shrinks. For amorphous silicates this can be omitted and water removed by centrifuging after washing the gel to remove dissolved NaCl. Conversion to silicate occurs by drying the gel in air at 80–100°C for ∼15 h. Without washing, crystalline NaCl also forms during drying and is easily identified by the presence of unwanted sharp X-ray diffraction features. Previous compositional analysis (TEM EDS) showed only trace levels of Na and Cl in the washed and dried silicate (Thompson et al. 2016). The structure, thermal evolution and spectroscopic behaviour of amorphous MgSiO3 produced in this way have been reported in Thompson et al. (1996, 2002, 2003, 2007, 2012a, 2013), Thompson & Tang (2001) and Thompson (2008).
Organic sol–gel schemes using soluble metal organic compounds have also been developed. Agladze et al. (1996) produced amorphous and crystalline MgSiO3 and Mg2SiO4 using a procedure described by Burlitch et al. (1991). Tetraethoxysiloxane (TEOS; Si(OC2H5)4) and magnesium methylate (Mg(OCH3)2) precursors were used in a H2O2-assisted reaction under a purified Ar-atmosphere. Solvent (methanol and water) removal was by rotary evaporation at reduced pressure and the remaining powder heated to achieve densification of the silicate framework. Jäger et al. (2003) also used the Burlitch et al. (1991) procedure, noting that the sol–gel method produces hydrogenated materials with properties similar to silicates in AGB stars, where isolated Si–OH or Mg–OH bonds are highly probable since H2O molecules participate in silicate grain formation (Gail & Sedlmayer 1998).
Murata et al. (2007) produced chondritic silicates via an organic procedure whereby magnesium ribbon, iron, aluminium, calcium carbonate, sodium carbonate and nickel powders were weighed in the chondritic ratio and dissolved in nitric acid. TEOS and ethanol were mixed into the solution which was magnetically stirred and ammonia solution added. Gelation occurs by hydrolysis of the TEOS and the solution was aged for two days. The gel was then dried in air, roughly ground and heated at 400°C for 10 h at 1 atm inside a gas-mixing furnace, under the redox condition on the iron-wüstite buffer curve using a H2-CO2 gas mixture to prevent divalent Fe oxidising to trivalent Fe. By using just Mg ribbon and TEOS precursors and drying in air for 20 h at 700°C to evaporate NH4NO3, Murata et al. (2009a,b) also produced amorphous MgSiO3. A similar TEOS-Mg-nitrate sol–gel was also employed by Roskosz et al. (2009, 2011) to produce amorphous MgSiO3 and Mg2SiO4.
Gillot et al. (2011) produced Ca–Mg-silicates using an all nitrite-based sol–gel synthesis. This involved dissolving Mg(NO3)2⋅6H2O and Ca(NO3)2⋅H2O in an aqueous-alcoholic solution, to which TEOS and nitric acid were added. The solution was heated to 65°C under continuous stirring inside a sealed reactor until gelation, after which it was aged at ambient temperature for 15 min before drying at 100°C for 48 h. The resulting solid was ground and purified by heating to 500°C.
The organic procedures outlined above represent sophisticated chemical processes requiring appropriate apparatus, facilities and practical experience due to the hazardous nature the substances involved. However, their complexity also provides for their limitations. The Burlitch et al. (1991) procedure, for example, cannot produce silicate with metal oxide contents greater than 50 Mol% MgO due to precipitation of the salt during the reaction, while Gillot et al. (2009) noted that their procedure is sensitive to the preparation of the precursor compositions and treatment to remove impurities. Furthermore, the more sophisticated a given procedure, the greater the scope for procedural error and unwanted variation, raising concerns over reproducibility and parity between successive syntheses. The inorganic procedure (Eqs. (1) and (2)) however is easy to execute and robust in its outcome, allowing systematic variation and compositional extension. Previously we showed that amorphous CaSiO3 and (MgCa)SiO3 can be produced by substituting CaCl2 for MgCl2 in Eq. (1) and drying the gel under vacuum to prevent reaction with atmospheric CO2 forming CaCO3 (Thompson et al. 2012b; Day et al. 2013). We have also produced amorphous FexMg1 − xSiO3 for x between 0.1 and 1.0 (Thompson et al. 2016) by adding to Eq. (1) Ferrous ammonium sulphate (Fe(II)(NH4)2(SO4)2 in varying ratios to MgCl2. The gel was quickly washed and transferred to a N2-purged vacuum furnace, pumped down to < 10−6 mbar and then heated to ∼80–100°C. However, this required > 24 h to complete, depending on the quantity of gel and the time taken to reach vacuum.
Although lengthy drying times are common to both organic and inorganic procedures, conventional drying by oven or furnace can be subject to a number of problems: non-uniform heating, reaction with ceramic crucibles and container effects influencing, or restricting, gas escape (Sun et al. 2011). The slow cooling rate of furnaces can also lead to the sintering of samples during cooling. Given the widespread availability of microwave sources, microwave drying is a potentially attractive proposition. Microwaves should offer significant advantages in that the electric component of the microwave field interacts with charge carriers in the material giving rise to direct heating, either through dipolar polarization, which is dominant in the liquid phase, or conduction heating, which dominates in solids. Due to this direct interaction, heating is instantaneous and occurs volumetrically, i.e. uniformly throughout the sample (Kitchen et al. 2014). For sol–gel synthesis, this can lead to faster reactions, lower final temperature and improved phase purity, due to the extremely rapid temperature rise, and more uniform heating (Wu et al. 2007). Although short microwave exposure has been used to promote gel condensation in forsterite (Mg2SiO4) and enstatite (MgSiO3) precursor gels (e.g. Ciaravella et al. 2016), as far as we are aware no studies have investigated the use of microwaves for drying sol–gels specifically for the production of amorphous silicates.
In this paper we show that microwave drying can be used to produce amorphous Mg–Fe silicates. We first produce MgSiO3 and compare its physical, structural and spectroscopic properties to two other samples produced from the same gel, but dried using conventional in-air oven and vacuum furnace. We then produce amorphous Mg2SiO4 and Mg0.9Fe0.1SiO3 and investigate their crystallisation by in situ thermal annealing. We consider the results in the context of modelling dust grains in protoplanetary disks.
2. Experimental details
2.1. MgSiO3 sol–gel synthesis and drying procedure
An initial gel was produced from two 0.1 M solutions (18 MΩ cm deionised water) of Na2SiO3 and MgCl2 (Eq. (1)) prepared in stoichiometric ratio to give MgSiO3. The gel was magnetically stirred (5 min) before washing with deionised water and centrifuging at 3300 rpm for 10 min (repeated three times).
Portions of gel, spread onto a watch glass and placed at the centre of a 900 W domestic microwave oven (Prestige GS25), were heated for one minute on full power, after which the door was opened and the gel inspected. If it appeared wet it was placed back in the oven and heated again for a further minute. This was repeated until a dry powder was obtained. With each successive exposure the gel successively fragments (Fig. 1) until a dried powder is obtained, comprising irregular fragments of varying size from a ∼few μm to ∼100 μm (Fig. 2). Total drying time was ∼6–8 min depending on the amount of gel. Although the temperatures achieved within the drying gel during each heating burst are unknown, the “heat and inspect” approach minimizes the total thermal exposure of the final dried product. The characterisation measurements presented below confirm crystallisation temperatures are not reached using this approach. Portions of gel were also dried at ∼80°C for 24 h using both a conventional in-air drying oven and vacuum furnace.
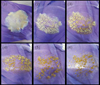 |
Fig. 1. Successive steps during microwave drying of sol–gel: (1) the as-prepared gel, (2)–(6) after successive microwave exposures (900 W) of 1 min duration. Images shown are for Mg0.9Fe0.1SiO3, light brown colour of the dried product being due to Fe content. |
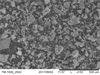 |
Fig. 2. SEM micrograph (Hitachi TM1000) of amorphous MgSiO3 produced by microwave drying of sol gel. |
2.2. Characterisation measurements
2.2.1. Wide angle X-ray scattering (WAXS): powder diffraction, in situ thermal processing and total scattering
Dried samples were loaded into 0.7 mm internal diameter quartz capillaries and mounted on the sample stage of the 3-circle diffractometer (Fig. 3A) on beamline I11 at Diamond Light Source (Thompson et al. 2009). Synchrotron X-ray powder diffraction (SXPD) patterns were collected using a position sensitive detector (PSD; Thompson et al. 2011). This has 18 pixelated Si-strip detectors tiled around a 90° arc in 2θ. To compensate for the small gaps between modules, each dataset comprises two exposures offset by 0.25° in 2θ and automatically merged by the beamline data acquisition system.
 |
Fig. 3. Wide and small angle X-ray scattering facilities at diamond light source: panel A: beamline I11 3-circle powder diffractometer, showing the 90°-arc position sensitive detector used for the present work; panel B: beamline I22 small angle scattering instrument shown configured with the 10 m camera length used for the present work. |
In situ thermal annealing was also monitored by SXPD. A Cyberstar hot air blower (FMB Oxford), aligned with the X-ray beam and located beneath the capillary, was programmed to heat from 200 to 995°C in steps of 5°C with an at-temperature stability of ± < 0.5°C above 250°C (Argoud & Capponi 1984) and ramp rate of 12°C min−1 between steps. At each step, the temperature was maintained for 1 min to allow the sample to equilibrate, after which an SXPD pattern was automatically collected, with a total X-ray exposure time of 2 s per merged data set. Once maximum temperature was reached, the hot air blower was withdrawn (motorised stage) and the sample left to cool and room temperature SXPD patterns collected. Crystalline phases were identified by search-match (Crystallographica), of the PDF-4+ database (International Center for Diffraction Data). All SXPD data were collected at an X-ray energy of 15 keV, calibrated against NIST SRM640c Si reference powder.
The I11 PSD was also used to perform total X-ray scattering (TXS) measurements, which are particularly suited to amorphous/nano-scale materials as long-range structure is not a prerequisite (see Appendix A.1). Also known as the pair distribution function method, TXS involves collecting scattered signal out to high magnitude values of the X-ray scattering vector, q(=4πλ−1sinθ, where λ is the X-ray wavelength and θ the scattering angle), in order to resolve atomic distances by Fourier inversion. The need to measure to high q and the weakness of the scattered signal there necessarily requires high energy X-rays and longer exposure times. For X-ray energy E the maximum accessible q is qmax = 4πE/hc Å−1. In practice qmax is limited by the instrument (e.g. maximum detector angle limited by beam pipe, detector body etc.), as is the minimum, qmin, below which data cannot be collected (e.g. backstop arrangements). For TXS on I11, 25 keV X-rays were used (source limited). The PSD was scanned from 2° to 80° 2θ in steps of 0.25°, with 2 s exposures per step, giving 313 exposures, which were summed to give a high signal to noise dataset covering 2° to 170° 2θ with qmax = 25 Å−1.
2.2.2. Small angle X-ray scattering (SAXS)
SAXS originates from the differences in electron contrast caused by the large-scale arrangement of objects well above the inter-atomic level, providing information on features such as aggregates, their constituent units and how they are organised (see Appendix A.2). Figure 3B shows the layout of Diamond SAXS beamline I22. Scattered X-rays pass through an evacuated flight tube to a Pilatus P3-2M silicon hybrid pixel area detector 10 m downstream (this work) of the sample position. Exposure times for samples loaded in 1 mm diameter polycarbonate capillaries were typically 1–5 s (12.4 keV X-rays), with empty capillary and background signals automatically subtracted from each measurement. Data reduction was via the DAWN software suite (Basham et al. 2015). A second, closer-in, detector recorded the WAXS signal which, being medium-resolution, was used only to confirm sample integrity.
2.2.3. Infrared spectroscopy
Mid-IR spectra were collected using a Bruker Vertex 70 FT-IR spectrometer equipped with a Harrick diamond crystal attenuated total reflectance (ATR) accessory.
3. Results
3.1. Comparative measurements
3.1.1. Relationship between gel and silicate
Figure 4 shows the SAXS data for the MgSiO3 gel presented according to the “standard” plots (see Appendix A.2). Linear fits to the regions labelled Gn, Pn and Zn give the lengths and dimensions listed in the first row of Table 1, revealing a number of characteristic lengths, depending on the range in q that each plot gives emphasis to. These are mostly biased towards short distances (high q values) and the smallest discernible sizes are 6–10 Å (Guinier and Porod plots) and likely constitute the larger 40 and 68 Å radii objects (Porod and Zimm plots). The absence of a linear region at low q in the Guinier plot, coupled to the strong increase in scattering intensity at low q, indicates the majority of the SAXS scatter originates from a distribution of larger-scale features (see below), while a fractal dimension of ∼1.3 is consistent with gel growth by diffusion-limited cluster-cluster aggregation (Brinker & Scherrer 1990) and within the Kakihana (1996) classification scheme identifies the gel as colloidal.
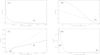 |
Fig. 4. Measured SAXS data (solid line) for the MgSiO3 precursor gel phase presented in standard SAXS plots (see Appendix A.2). Panel A: Guinier plot; panel B: Porod plot; panel C: Zimm plot and panel D: Kratky plot (where the positions of a broad and a narrow feature are labelled K1 and K2 respectively). Dashed lines show fits to linear regions (labelled G1, P1, Z1 and Z2) in the Guinier, Porod and Zimm plots and from which various lengths and dimensions can be derived (see Appendix A.2 and text in Sect. 3.1.1.) |
Lengths and dimensions derived from the standard SAXS plots for the precursor gel and MgSiO3 silicate obtained by drying the precursor gel by microwave, in air and in vacuum.
Figure 5A shows a Monte Carlo fit (McSAS, Bressler et al. 2015) to the SAXS obtained by refining a size distribution (Fig. 5B) of spherical particles. The distribution peaks between ∼250 and 300 Å (graphical output is in nm), with a shoulder in the region of ∼700 Å. However, the fitting method relies on volume weighted signal strength and the reduction in SAXS intensity at high q means that smaller structures are not major (numerical) contributors to the recorded intensity. The fitting algorithm is consequently biased towards larger structures, leading to the increase in the minimum visibility limit shown in the figure for small particles (Bressler et al. 2015 and references therein) and is therefore a limit of visibility by this method of analysis rather than on the presence of smaller scatters, information for which must be derived by other means (e.g. the standard plots).
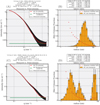 |
Fig. 5. Panel A: Monte Carlo fit to measured SAXS for the MgSiO3 precursor gel assuming spherical component “particles” produced by refining the particle size distribution (panel B). Panels C and D: fit and refined size distribution obtained for microwave-dried MgSiO3. Radius units are shown in nm. |
The results of repeating these analyses for the microwave-dried silicate (Figs. 5C and D and 6) are given in the second row of Table 1. Like the gel, the fractal dimensions of the Porod regions indicates mass fractal structures, albeit somewhat denser. However, the weakness in the strength of the transition “knees” between them indicates an absence of significant electron contrast and indicates similar internal constituents. The observation of multiple Porod regions may be related to the presence of different tetrahedral species. The radius of a sphere formed by rotating a simple dimer (two tetrahedra sharing a single O atom) will approximate to the O–O distance. In crystalline MgSiO3 (enstatite) this ranges from ∼2.6 to 3 Å and is consistent with Rg ∼ 2.8 − 3.3 Å obtained from the Guinier and Zimm plots. Thus, by extension, we attribute the other monomer sizes to either radii of gyration of other, more complicated and therefore larger, tetrahedral species (e.g. a chain of five tetrahedra would have Rg ∼ 6.5 − 7.5 Å, encompassing the P1 radius ∼7 Å), or at the largest scales to structures whose monomers could themselves be aggregates of smaller monomers.
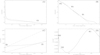 |
Fig. 6. Standard SAXS plots (solid line) obtained for microwave-dried MgSiO3. Panel A: Guinier plot, panel B: Porod plot, panel C: Zimm plot and panel D: Kratky plot. Label convention for the linear and feature regions as per Fig. 4. |
Figures 5C and D show the Monte Carlo fit for the microwave-dried silicate. Below ∼200 Å the size distribution is bimodal, peaking at 30 Å (cf. P1 aggregate ∼36 Å, Z2 Rg ∼ 32 Å) and 100 Å (cf. P3 monomer ∼96 Å). The minimum visibility cut-off is at ∼25 Å (c.f. P2 monomer ∼23 Å). The fit also revealed a third, much larger, particle distribution from ∼300 Å to 1000 Å, peaking at 600–700 Å.
Figure 7 shows the standard plots for air- and vacuum-dried MgSiO3 and the lengths and properties derived from these are also given in Table 1, while Monte Carlo fits are shown in Fig. 8. The air-dried sample shows a similar tri-modal size distribution to the microwave-dried silicate, with the smallest sizes peaking at ∼25 Å (cf. P1 aggregate ∼32 Å, P2 monomer ∼30 Å, Z1 Rg ∼ 38 Å), the next at ∼100 Å which is much weaker relative to the 25 Å distribution than in the microwave-dried case. The third component is at ∼1000 Å but is subject to large error bars which may be due to deviation away from the spherical symmetry assumed in the model at the largest scales and/or the presence of structures beyond the experimental range. The vacuum-dried silicate on the other hand shows a broad asymmetric distribution peaking just short of ∼150 Å (cf. P2 aggregate ∼170 Å) and a larger distribution peaking at ∼700 Å. Given the dependence of SAXS on the geometry of the scatterers, it may be possible to use TEM to provide geometric constraints to these analyses.
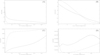 |
Fig. 7. Standard SAXS plots for air-dried (solid line) and vacuum-dried (dashed line) MgSiO3. Panel A: Guinier plot, panel B: Porod plot, panel C: Zimm plot and panel D: Kratky plot. Fit lines for the various linear portions not shown for clarity of comparison between air- and vacuum-dried data. |
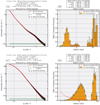 |
Fig. 8. Panel A: Monte Carlo fit to SAXS signal for MgSiO3 dried in air using spherical particle model and panel B: refined particle size distribution; panel C: fit to vacuum-dried MgSiO3 SAXS and refined particle size distribution (panel D). Radius units are shown in nm. |
3.1.2. Silicates: atomic level structure
Figure 10A shows SXPD patterns for the dried silicates. Above ∼7° 2θ all three appear near-identical in terms of the number and position of features. The absence of sharp features confirms the absence of crystallinity, their broad nature being typical of nano-scale, or nano-structured, materials. However, below ∼7° 2θ there is feature at ∼3.5° 2θ in the pattern for the microwave-dried sample that is only present as a slight shoulder to the steep background rise in the air- and vacuum-dried patterns. Using the Bragg equation we obtain a real-space distance of ∼13.5 Å for this feature. Orthorhombic enstatite has typical unit cell of 18.2 × 8.8 × 5.2 Å, the average of the two longest cell lengths is 13.5 Å. In addition, in Fig. 6B there is a large hump above the first Porod region P1 (lnq > −1) and occupies the overlap region between SAXS and WAXS. It’s position (determined from the first derivative of the log–log SAXS curve) corresponds to a Bragg-like lattice d-spacing of ∼17 Å, close to the longest length of the orthorhombic cell. This feature is not visible in Fig. 10A as it’s low scattering angle (2θ ∼ 2.6°) is shadowed by the I11 beamstop. It seems likely therefore that the drying process results in the formation of pseudo, or proto, unit cell-like structures.
In previous TXS studies of air- and vacuum-dried MgSiO3 and MgFeSiO3 (Thompson et al. 2013, 2016) we identified a coherent scattering domain (CSD) size of ∼30–40 Å, which is a radial length beyond which no pairwise atom-to-atom structural correlations exist and represents the extent of structural ordering. Figure 9 shows pair distribution functions obtained from the Fourier inversion (Appendix A.1) of the I11 TXS measurements for the air-, vacuum- and microwave-dried silicates. The CSD sizes are ∼55 Å, ∼35 Å and ∼48 Å respectively. Within the CSDs all three silicates show near-identical structures. It is interesting to note that the CSDs, which are based on the limits in the length over which structural correlations can be discerned at the atomic level, are similar to some of the lengths obtained from SAXS (e.g. P1, P2 and Z2), which are based only on the distances over which differences in electron contrast can be discerned.
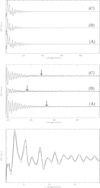 |
Fig. 9. Top: measured pair distribution functions out to 100 Å for MgSiO3 dried (A) in air, (B) in vacuum, (C) in microwave oven. Middle: pair distribution functions shown from 20 Å. Arrows indicate real-space length where the pair distribution amplitude goes to zero, marking size limit of coherent scattering domain for each silicate. Bottom: pair distribution functions for each silicate in the 1–20 Å range shown superimposed to show closely similar atomic structures. |
3.1.3. Silicates: mid-IR spectroscopy
Figure 10B shows FTIR spectra for the three dried silicates showing the characteristic 10 μm band due to Si-O stretch modes, a steep rise towards the 20 μm Si-O-Si bending mode band via a broad feature at ∼16 μm, plus two features near 6 and 7 μm and the characteristic hydration band at ∼3 μm. The rise in absorbance towards 20 μm is enhanced by the well-known wavelength-dependent increase in the penetration depth into the sample at longer wavelengths of the evanescent wave travelling along the ATR crystal, such that for silicates the 20 μm band appears stronger (e.g. Chemtob et al. 2010). The spectra have been normalised to the maximum intensity of the 10 μm band to account for different signal strengths due to varying sample volume in the ATR method.
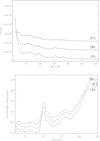 |
Fig. 10. Top: synchrotron X-ray powder diffraction patterns for as-dried MgSiO3 silicates dried (A) in air, (B) in vacuum and (C) in microwave (patterns shown offset vertically for clarity). Bottom: corresponding FTIR spectra for the dried silicates: |
The ∼7 μm band (see also Fig. 12) is composed of two overlapping components and is related to the presence of Mg. In vacuum-dried FexMg1 − xSiO3 this feature weakens, and disappears for compositions with x > ∼0.4 (Fig. 1, Thompson et al. 2016). The broad feature at ∼16 μm was previously attributed (Thompson et al. 2002) to Si-O stretch mode overtones which occur in crystalline olivine and pyroxene between 13 and 15 μm (Jäger et al. 1998), but could also contain contributions from Si-O-Si bending modes which occur from ∼15 μm. The feature also exhibits thermal and compositional dependencies. Ex situ annealing of amorphous MgSiO3 (air-dried over a hot plate at 100–150°C) showed the feature at 600°C becoming asymmetric and peaking at a lower wavelength, with finer structure becoming visible at 660°C (Thompson et al. 2002). Another ex situ experiment with amorphous MgSiO3 (air-dried in an oven at 75°C) showed the 16 μm band peak shifting towards 15 μm and weakening with increasing temperature, disappearing completely by 600°C (Thompson et al. 2012a,b). For amorphous MgxCa1 − xSiO3 (vacuum-dried at 50–80°C) a 16 μm feature is only seen for x > 0.2 (Day et al. 2013); while for MgxFe1 − xSiO3 (Vacuum-dried at 50°C) the initial feature observed at ∼16 μm for all x, reduces in strength after ex situ annealing under vacuum at 450°C (Thompson et al. 2016). For amorphous Mg2SiO4 (See Fig. 14 below) the feature appears weaker.
In all three MgSiO3 silicates, the 10 μm band shows a strong ∼11.5 μm shoulder, while the position of peak intensity shows minor variation: air 10.13 μm, vacuum 10.19 μm and microwave 10.16 μm. The peak position of the microwave-dried silicate is intermediate of the air- and vacuum-dried samples suggesting a possible systematic bias in the relative distribution of tetrahedral species with differing numbers of non-bridging oxygen atoms per tetrahedron (NBO/T). A linear background was subtracted between 8.5 and 12.8 μm and the band fitted using 5 pseudo-Voigt functions (Stancik & Brauns 2008), whose initial positions were set to the average band positions listed in Table 2. The decompositions are shown in Fig. 11 with band positions listed in Table 3. The relative proportion, n, of each of the NBO/T can be estimated from the area, A, of the band components since n = σA, where σ is the IR cross section of the corresponding Si–O stretch (Mysen et al. 1982) and, expressed as percentages, are also listed in Table 3 for each component. For all three drying methods the majority MgSiO3 species is SiO3, comprising ∼45–48%, with Si2O5 and Si2O7 contributing approximately 20 to 26% and SiO4 constituting ∼10%. SiO2 only appears to be present in any significant quantity in the air-dried silicate.
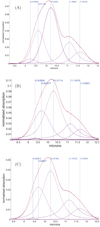 |
Fig. 11. Decomposition of the 10 μm band for MgSiO3 dried in air (panel A), in vacuum (panel B) and in microwave (panel C). |
Silicate Si–O vibrational wavelengths.
3.1.4. Hydration state and water removal
Figure 12 shows the IR spectra for the silicates in the region of the hydration bands and consists of a band at ∼6.15 μm due to the H–O–H bending mode of coordinated and/or adsorbed water (Augsberger et al. 1998) and a broad asymmetric hump peaking at ∼3 μm. Efimov et al. (2003) identified eight bands in the spectral envelope located between 4.08 and 2.70 μm of silicate glasses: four due to interstitial H2O and four to SiO–H stretching modes in differing structural environments,
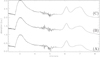 |
Fig. 12. IR spectra in the region of the hydration bands for MgSiO3 dried in air (A), in vacuum (B) and by microwave (C). |
-
H2O: 3.44, 3.38, 3.13, 2.95 μm
-
SiO–H: 3.93, 3.64, 2.84, 2.78 μm.
Figure 13 shows the results of decomposing the 3 μm band using three Gaussian functions, the minimum number required to give a reasonable fit (χ2 ∼ 0.996). With reference to the Efimov et al. (2003) assignments above, we attribute the three bands to two water bands and one OH band:
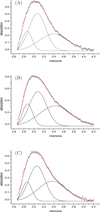 |
Fig. 13. Decomposition of the 3 μm hydration band for MgSiO3 dried in air (panel A), in vacuum (panel B), by microwave (panel C). |
-
H2O: 3.07air, 3.06microwave, 3.08vacuum
-
H2O: 3.40air, 3.37microwave, 3.42vacuum
-
SiO–H: 2.86air, 2.86microwave, 2.87vacuum.
The standard fitting errors for the 3.0, 3.4 and 2.7 μm band positions were ±0.01, 0.05 and 0.004 respectively. None of the drying methods removed all the free water. However, the relative strength of the 3 and 6 μm peak intensities are 1.68, 1.19 and 1.15 for the air-, vacuum- and microwave-dried silicates respectively, suggesting different levels of water removal. Previously, for vacuum-dried MgFeSiO3, annealing at 450°C reduced the strength of the 3 μm band by ∼30% with similar behaviour for the 6 μm band (Thompson et al. 2016). Doubling the annealing time did not produce any further change in the 3 μm band. Drying at higher temperatures (e.g. higher microwave power) could potentially remove more, or all, H2O and bonded OH but runs the risk of inducing crystallisation. Some level of persistent hydration appears to be an intrinsic feature of silicates formed by drying sol–gels. To assess the efficiency of the drying methods, samples were weighed before and after drying and the percentage mass-loss calculated: air 90.23%, vacuum 92.97%, microwave 91.12%. Although these are all comparable at 90–93%, vacuum-drying removed the most, while air-drying, at the temperatures used, removed the least. This trend was confirmed by other gel compositions (next section) as shown in Table 4.
Percentage mass loss from initial gel per drying method.
3.2. Extension to MgFeSiO3 and Mg2SiO4
The inclusion of Fe via sol–gel can be problematic as, during drying, Fe can form separate oxide phases rather than incorporating into the silicate. These oxides could then act as nucleation centres (Murata et al. 2007) for crystal growth during annealing, such that true Fe-bearing silicate behaviour is not observed. To overcome this, vacuum-drying was previously employed (Thompson et al. 2016). However, Fe can be incorporated via microwave-drying as shown in Fig. 14 and by comparison to Fig. 10 for MgSiO3. Figure 14 also shows microwave-drying can produce amorphous Mg2SiO4 from Eq. (2). The latter required a few minutes longer to dry than the enstatite composition, but as Table 4 shows, the level of mass loss in both is comparable. The SXPD patterns for both Mg0.9Fe0.1SiO3 and Mg2SiO4 appear very similar to the microwave-dried pattern for of MgSiO3.
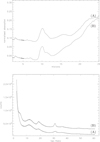 |
Fig. 14. Mid-IR FTIR spectra (top) and SXPD patterns (bottom) for (A) Mg0.9Fe0.1SiO3 and (B) Mg2SiO4 produced by microwave drying. |
The Mg2SiO4 pattern shows a distinct low angle feature similar to the one present at 3.5° 2θ in the microwave-dried MgSiO3 pattern. However the Mg2SiO4 feature occurs at ∼6° 2θ(≈0.79 Å−1) and corresponds to a real-space distance of 7.8 Å, which is close to the average dimension of ∼7 Å for the orthorhombic unit cell (∼4.7 × 10.2 × 6 Å) of crystalline forsterite (Mg2SiO4). A low angle feature is not present in the steep small angle rise in Mg0.9Fe0.1SiO3, suggesting the Fe-bearing silicate is less structured.
Decompositions of the 10 μm band for Mg0.9Fe0.1SiO3 and Mg2SiO4 are shown in Fig. 15, with the band positions and relative proportions listed in Table 3. The percentages for Mg0.9Fe0.1SiO3 appear similar to those of MgSiO3, but for Mg2SiO4 the NBO/T distribution is flatter, with each NBO/T species contributing in the region of 20%, including SiO2 (see discussion in Sect. 4.1).
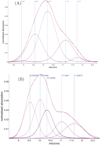 |
Fig. 15. Decomposition of the 10 μm band for microwave-dried Mg0.9Fe0.1SiO3 (panel A) and Mg2SiO4 (panel B). |
3.3. Thermal evolution of MgSiO3, Mg0.9Fe0.9SiO3 and Mg2SiO4
Figures 16A–18A show in situ SXPD for the microwave-dried silicates during annealing, while Figs. 16B–18B show those patterns where crystallisation first begins. For MgSiO3 (Fig. 16B) weak features form at 705°C and increase in strength and number with temperature. The initial features however are too few and too weak for definitive phase identification via pattern matching, or direct fitting by candidate phases. Instead the pattern at 995°C (Fig. 16C) was fitted by Pawley whole-pattern profile refinement (Topas powder diffraction analysis software, Bruker) using phases identified by search-match in the post-annealing room temperature scan with lattice parameters taken from the ICDD PDF-4+ database. To account for both the crystalline phases and the significant amount of non-crystalline material still present (broad background features) at 995°C, at least two phases for each of the main compositions (forsterite and enstatite) were included, one that contributed to the background features and one, or more (i.e. with slightly different lattice parameters), to fit the narrow Bragg peaks. The fits thus obtained for all three silicates at 995°C are shown in Fig. 19 and refined cell parameters listed in Table 5. Characteristic peaks for each crystalline phase were then identified and traced back through each of the preceding datasets to the temperature at which they first appear and is represented schematically in Fig. 20. The inclusion of Fe has a dramatic effect on the thermal evolution, raising the crystallisation temperature up to 900°C. In contrast, for Mg2SiO4 crystallisation starts at a much lower temperature of 495°C, but is joined by cristobalite (SiO2) at 905°C. From the contribution of each model phase to the overall fit, it is possible to determine the relative proportions between amorphous and crystalline phases and between individual crystalline phases. These are listed in Table 5 and show MgSiO3 and Mg2SiO4 silicates remain, respectively, ∼58 and ∼43% amorphous at high temperatures.
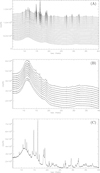 |
Fig. 16. SXPD patterns for in situ annealed MgSiO3. Panel A: temperature dependent crystallisation (patterns offset in y-direction). Bottom pattern is at 455°C (lower temperature scans omitted), top pattern is for 995°C, temperature step between displayed scans is 20°C. Panel B: diffraction patterns at the point where crystalline structure is first detected. Bottom pattern is at 705°C, top is 755°C, temperature step between displayed scans is 5°C. Panel C: SXPD scan at maximum annealing temperature 995°C showing multiple crystalline diffraction features. |
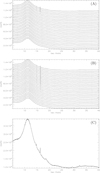 |
Fig. 17. SXPD patterns for in situ annealed Mg0.9Fe0.1SiO3. Panel A. temperature dependent crystallisation (patterns offset in y-direction). Bottom pattern is at 455°C, top pattern is 995°C, temperature step between displayed scans is 20°C. Panel B: SXPD patterns at the point where crystalline structure is first detected, bottom pattern is at 850°C, top is 995°C, temperature step between displayed scans is 5°C. Panel C: SXPD scan at maximum annealing temperature 995°C showing limited crystalline diffraction. |
SXPD refinement results (lattice parameters) for microwave-dried silicates at 995°C, with percentage contribution of each phase to the crystalline component of the fit and overall percentage contribution of these to the measured SXPD pattern (degree of crystallinity).
4. Discussion
4.1. Thermal annealing: comparison with previous results
We have previously reported on a number of studies involving the annealing of sol–gel produced silicates, focussing mostly on air-dried MgSiO3. Much of this involved ex situ annealing, typically employing coarse temperature steps with annealing times per step ranging from ∼few hours to a ∼few tens of hours. Even though the time spent at maximum annealing temperature can be well defined, the long cool-down times of ex situ furnaces often means that, as the maximum required temperature increases, samples also spend increasingly extended periods at significantly high temperatures, during which time structural evolution continues.
In Thompson et al. (2012a,b, 2013) crystalline SXPD features were first observed in air-dried amorphous MgSiO3 annealed ex situ at 600°C. However, the samples had been annealed for 17.5 h (tube furnace, ∼2–3 h cool down) with a 50°C temperature step. Earlier, ex situ annealing (vacuum furnace, 24 h cool down) had been used to investigate the formation of structure in the 10 and 20 μm mid-IR bands as a function of short (2–4 h) and long (20–24 h) annealing times (Thompson et al. 2002). In both cases fine structure was discernible at 600°C. However, the annealing parameters were poorly constrained – despite the fast heating ramp rate (∼23°C min−1), cooling was unassisted and very slow, with the annealing time being defined as time spent above 85% of the target temperature. Thus, even for “short” annealing the sample typically spent ∼0.4 h at maximum temperature, ∼1.5 h above 600°C and ∼4.2 h above 347°C, returning to room temperature after ∼24 h. In the present work, the 12°C min−1 ramp rate and 1 min in situ equilibration time at each 5°C temperature step means that by the time crystallisation is observed in MgSiO3 at 730°C the sample has spent only ∼33 min above 600°C. A fast ramp was also used in Thompson & Tang (2001) where in situ annealing at 727°C (RF induction furnace) was used to study the evolution of crystallinity in air-dried amorphous MgSiO3. To reach the target temperature quickly the furnace was ramped in ∼200°C steps over ∼5 min, giving an effective ramp rate of ∼145°C min−1. The sample would have spent < 1 min above 600°C and was still predominantly amorphous on reaching target temperature.
In Thompson et al. (1996) the ex situ annealing at 500°C and 900°C of air-dried MgSiO3, Mg2SiO4, (Mg,Fe)2SiO4 and Fe2SiO4 were reported. However, neither the total annealing time nor ramp rate were recorded. The samples also differed in that their gels had been dried at 100–150°C over a hot plate. For MgSiO3 annealed at 900°C extensive crystallisation had occurred, while at 500°C only two weak diffraction features were observed. For Mg2SiO4 crystalline features were only observed at 900°C. In the present work, crystallisation in Mg2SiO4 is observed at 495°C and should, in principle, be visible in the 1996 500°C data. However Fig. 18B shows the first-formed crystalline diffraction features are exceedingly weak, such that the low-noise, low-background and high sensitivity of the modern detector over the earlier beamline instrument, coupled to the uncertainty around the original annealing, means that any beginnings of crystallisation at 500°C likely went undetected in the earlier measurements.
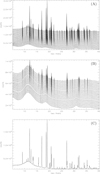 |
Fig. 18. SXPD patterns for in situ annealed Mg2SiO4. Panel A: temperature dependent crystallisation (patterns offset in y-direction). Bottom pattern is at 455°C (lower temperature scans omitted), top pattern is for 995°C, temperature step between displayed scans is 20°C. Panel B: SXPD patterns at the point where crystalline structure is first detected. Bottom pattern is at 464°C, top is 584°C, temperature step between displayed patterns is 5°C. The two weak peaks at ∼16.5 and ∼23.6° 2θ are from residual NaCl. Panel C: SXPD pattern at maximum annealing temperature 995°C showing multiple crystalline diffraction features. |
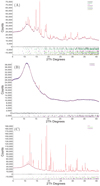 |
Fig. 19. Pawley whole pattern profile refinement fits to SXPD scans at maximum in situ annealing temperature (995°C). Panel A: MgSiO3, panel B: Mg0.9Fe0.1SiO3 and panel C: Mg2SiO4. |
For the two 1996 Fe-bearing samples, both showed near-identical 900°C SXPD patterns, meaning the same phase had crystallised in both. Fe2SiO4 also showed very similar patterns for both the as-dried and 500°C samples, while the (Mg,Fe)2SiO4 as-dried pattern appeared similar to the 500 °C Fe2SiO4 pattern. Since the gels were air-dried, a significant fraction of the Fe atoms would have oxidised rather than incorporate into the silicate. The observed crystallisation was therefore likely due either to the oxides acting as pre-existing nucleation sites for silicate crystal growth (Murata et al. 2007, see Sect. 4.3) or, to the direct growth of a separate oxide phase.
Hallenbeck et al. (1998) however found the IR spectra of annealed amorphous Fe-silicate smokes evolved much more slowly than the spectra of amorphous Mg-silicates, demonstrating crystalline Mg-silicates formed more readily than crystalline Fe-silicates. One indicator was the temperature required to observe noticeable changes in the spectrum of an amorphous smoke annealed in vacuum for two days. Amorphous Mg-silicate smokes changed significantly when annealed at 1000 K, while amorphous Fe-silicates showed no signs of change on this timescale, unless the annealing temperature was 250–300 K higher. Although they initially reported that mixed Fe/Mg-silicate smokes annealed on roughly the same timescale as pure Mg-silicates, they later found these smokes to be mixtures of individual Fe- and Mg-silicate grains, with spectral changes only occurring in the Mg-silicates. The Fe-silicates remained essentially inert for low temperature annealing (Nuth et al. 2000). The microwave-dried Mg0.9Fe0.1SiO3 silicate exhibits a similar behaviour to the original Hallenbeck et al. (1998) observation, developing crystalline features ∼160°C higher than the pure MgSiO3 silicate.
4.2. Thermal annealing: crystallisation activation energies
The time required for crystallisation at a given temperature can be accessed via the Boltzmann factor, exp(−Ea/kT), which expresses the probability of a given energy state Ea. The frequency with which an atom leaves a given site within a structure is therefore νexp(−Ea/kT) and the time spent occupying the site will be
 (3)
(3)
The frequency of vibration, ν, of the atom or ion within the site is taken to be ν = 2 × 10¹³ s−1 and is the mean vibrational frequency of the silicate lattice between the Si–O stretch and Si–O–Si bend modes (Lenzuni et al. 1995; Gail & Sedlmayer 1998). Thus, to initiate a change of structure at a given temperature requires an activation energy of Ea/k to be applied for time τc. The time and temperature at which crystalline features first form in the SXPD data can be used to determine Ea/k using Eq. (3), from which we can derive the annealing time to crystallisation required at any temperature. Figure 21 shows τc(T) for each crystalline species identified in Fig. 20, with the SXPD derived Ea/k also shown.
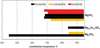 |
Fig. 20. Schematic showing temperatures at which features for the crystalline phases appear in the in situ SXPD data for the microwave-dried silicates. |
Fabian et al. (2000) reported Ea/k ∼ 39 100 K for forsterite, 40 100 K to 42 300 K for enstatite and 49 000 K for SiO2 (quartz). The spread for enstatite could reflect structural/compositional differences due to production: Fabian et al. considered samples produced as smokes and glass, while Brucato et al. (1999) obtained Ea/k = 47 300 K for samples produced by laser ablation of natural enstatite. Jäger et al. (2003) found Ea/k ranged from 26 600 to 31 700 K for sol–gel silicates with compositions ranging from MgSiO3 to Mg2.6SiO4.6, which they attributed to variation in the excess/isolated Si-OH content. The SXPD-derived Ea/k are consistent with the previously published values but also clearly vary with bulk composition.
4.3. Thermal annealing: structural and physical factors
Murata et al. (2007) described three crystallisation scenarios for amorphous silicates annealed at constant temperature: Type-A, in which crystallisation proceeds by diffusion-controlled growth from pre-existing nuclei; Type-B, where crystallisation occurs as a combination of Type-A growth and by the formation of new nucleation centres followed by diffusion-controlled crystal growth around these; while Type-C crystallisation occurs via nucleation followed by diffusion-controlled growth. Type-A should provide the fastest crystallisation process and Type-C the slowest. However, Type-B can also stall if the diffusion-controlled growth becomes exhausted before fresh nucleation occurs. For the sol–gel silicates we have shown the presence of pre-crystalline structures and ordering, ranging from the short- and medium-ranges (TXS and SXPD data) right out to large-scale variations and clusters (SAXS data), while deconvolution of the mid-IR 10 μm band shows a distribution of tetrahedral species with varying numbers of bridging/non-bridging oxygen atoms. Since the latter depends on the distribution of network modifying atoms (i.e. Mg, Fe) it is likely that these are ordered into regions rich in one or other tetrahedral species and likely correspond, at least in part, to the variations we see in electron contrast that give rise to the measured variations in the X-ray scattering strength. These pre-existing structures likely play a role in determining the course of crystallisation, with some providing centres for crystal growth and others resisting structural development. For example, forsterite is a nesosilicate consisting of unconnected tetrahedra (i.e. 4 non-bridging oxygen atoms). An amorphous domain comprising these unconnected tetraheda must be chemically ordered (charge balanced) such that the Mg atoms are evenly distributed in order to maintain the unconnectedness of the tetrahedra within the domain confines. Crystallisation of forsterite from this is therefore relatively easy and will likely mostly involve rotational orientation of the tetrahedra, with limited translation or diffusion, such that forsterite is the first crystalline phase observed. Regions rich in other connectivities, however, will present restricted diffusion pathways, require movement of larger structural units and possibly intertetrahedral bond breaking before crystallisation can progress within those domains.
We have previously argued that sol–gel silicates are best represented by a domain-structured model whereby regions, ordered at the nano-scale, are interconnected by a random network (Thompson et al. 2012a,b, 2013, 2016 and references therein). Furthermore, we have found that annealing at temperatures below crystallisation induces significant changes both structurally and spectroscopically (i.e. in the relative distribution of tetrahedral species). Specifically, at about 450–500°C the silicate network undergoes a release of built-up strain (Thompson et al. 2012a,b), which we attribute to the formation of non-bridging oxygen hole centres (Thompson et al. 2013), caused by the loss of OH from the non-bridging oxygens, which allow new network connections to be made between neighbouring tetrahedra. This, however, is an amorphizing process, evidenced by a marked reduction in the coherent scattering domain size measured by TXS (Thompson et al. 2013, 2016 and Fig. 9 this paper), rather than the formation of long-range periodic (i.e. crystalline) structure. Thus it may be that prolonged annealing at lower temperatures may exert an influence on the subsequent crystallisation behaviour not reflected in either Eq. (3) or the Murata et al. (2007) description of nucleation and growth. However, it may be equally plausible that these effects are supressed by the use of a fast ramp rate whereby more energetic temperatures are quickly reached, and where the preserved structural domains could act as nucleation sites at higher temperatures (Wooden et al. 2005). This can be resolved by further experimental investigation.
4.4. Application to protoplanetary dust
The temperature distribution of dust in protoplanetary disks is a complex function of radiation field, disk geometry and the dust opacity and volume density. However, there are three observational regimes that in general relate to different physical regions within a disk (Waters 2015):
-
Hot dust: 1–10 μm emission by dust in the inner disk 1–3 AU from the star at temperatures > ∼ 500 K (∼230°C). Inner dust-free cavity caused by grain evaporation (∼1500 K, ∼1230°C).
-
Warm dust: 10–100 μm emission from dust at 100–500 K (∼ − 170 − 230°C) within the disk surface layers 3–5 AU to ∼few × 10 AU from the star.
-
Cold dust: sub-mm - mm emission from mid-plane dust < 50 K (< ∼ −220°C) and > few × 10 AU from the star.
The wavelength ranges for hot and warm dust contain many diagnostic vibrational resonances, such that disk mineralogy can be probed. Observations of Herbig Ae/Be disks show the inner disks are highly crystalline, up to 100% (van Boekel et al. 2004). Early disk models predicted forsterite as the dominant crystalline dust in the innermost, highest temperature, regions with enstatite dominating at lower temperatures, having converted from forsterite (Gail 2004). However, disks around T Tauri stars (Bouwman et al. 2008), Herbig Ae/Be stars (Juhász et al. 2010) and in the young Serpens cluster (Oliveira et al. 2011) show the opposite trend: enstatite is more concentrated in the inner disk, while forsterite dominates the colder, outer regions. For microwave-dried amorphous MgSiO3, enstatite and forsterite form at similar temperatures (Fig. 20), followed by cristobalite; while for amorphous Mg2SiO4, forsterite is very much a lower-temperature phase, crystallising some ∼200°C earlier. However, the forsterite crystallisation temperature is dramatically increased if Fe is incorporated into the pyroxene structure. Figure 20 suggests (assuming crystallisation is thermally driven, see below) that different silicate compositions will require different conditions, i.e. different regions of the disk, in which to crystallise.
Grains orbiting within a disk experience a slow increase in temperature over many orbits, spending many years at high temperature, resulting in crystallisation. The temperature ramp rate in our experiments is many orders of magnitude faster than that likely to be experienced by grains within a disk, such that the laboratory measured crystallisation temperatures will be higher.
Notwithstanding the points raised in Sect. 4.3 we can use the Ea/k derived in Sect. 4.2 to estimate limiting in-disk temperatures needed to crystallize grains by thermal annealing within the lifetime, τD, of a protoplanetary disk. Observations of clusters with different ages show τD of 1–10 Myr (Strom et al. 1989; Haisch et al. 2001; Rosotti et al. 2015) with a typical lifetime of τD∼2–3 Myr (Mamajek 2009; Williams & Cieza 2011); while calculations suggest τD = 1 − 15 Myr and typical lifetimes of ∼1–3 Myr (Li & Xiao 2016). The calculations also suggest few disks have τD > 10 Myr, while ∼30% have τD < 1 Myr. Disk lifetimes and Ea/k thus constrain the minimum temperature conditions under which amorphous silicate grains can crystallise, requiring τc ≤ τD. Assuming a typical τD of 3 Myr and the Ea/k from Fig. 21, the formation of crystalline forsterite from grains with Mg2SiO4 compositions requires ∼205°C (478 K), while the formation of forsterite from grains with pyroxene MgSiO3 stoichiometry requires ∼365°C (638 K). For pyroxene grains containing Fe, the minimum exposure temperature for forsterite formation is ∼460°C (733 K). The minimum temperature for crystalline enstatite from MgSiO3 grains is ∼365°C (638 K), while cristobalite requires 390°C (663 K) for grains with MgSiO3 composition and 465°C (738 K) for grains with Mg2SiO4 composition. These values will be higher or lower for shorter- or longer-lived disks. However, for a typical protoplanetary disk they do suggest spectral features attributable to forsterite could have three separate sources: warm Mg2SiO4 dust, hot MgSiO3 dust and very hot MgFeSiO3 dust, noting that once crystallised Mg2SiO4 also survives to high temperatures.
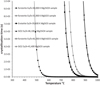 |
Fig. 21. Crystallisation time as a function of temperature for the phases observed in the annealed microwave-dried amorphous silicates, calculated using the activation energies for each phase determined from the SXPD data. |
However the results above are somewhat limited. Clearly there is a difference between MgSiO3 and Mg0.9Fe0.1SiO3, but we have not explored how Fex with x < 0.1 specifically affects Ea/k. Neither have we considered (Mg,Fe)2SiO4. Olivine ((Mg,Fe)2SiO4) has far-IR resonances at ∼20, 49 and 69 μm. The 69 μm band is insensitive to particle shape and matrix effects (Koike et al. 2006), but at fixed temperature its position is dependent on Fe content (Molster et al. 2002; Koike et al. 2003) and for a fixed composition exhibits some temperature dependency below ∼300 K (Koike et al. 2006; Suto et al. 2006). Observations of this feature for 32 protoplanetary disks (Sturm et al. 2013) suggest an Fe content upper limit of ∼2% (with only one source having a higher limit of 4%). Grain temperatures were typically 100–200 K which, based on the results here, suggests grains either crystallised closer-in and were transported out, or a different crystallisation process is in action. Sturm et al. (2013) found the grains causing the 69 μm feature likely orbited within narrow, well defined, rings and therefore ruled out radial mixing as this would produce more radially extended distributions (Gail 2001). The absence of other crystalline phases in lower temperature regions may also argue against radial mixing (Juhász et al. 2010) and is supported by our finding of forsterite being a low temperature crystallite of amorphous Mg2SiO4 grains.
Alternative in situ heating mechanisms could include the presence of a massive planet opening a gap in the disk, which would produce shock waves via tidal interaction (Lin & Papaloizou 1980; Bouwman et al. 2003; Boss & Durisen 2005), or by shock waves arising from either the bow shock of a planetesimal (Miura et al. 2010), or disk instabilities (Harker & Desch 2002). Shock annealing occurs via thermal exchange with the hot, shocked gas and by absorption of thermal radiation emitted by other grains. Immediately after a shock passes, the gas is slowed in < 1 ms, but dust grains are only slowed by frictional drag, which heats grains for a period of time lasting seconds to minutes (depending on gas density, particle size, and the emissivity of the grain material). On this timescale, the direct SXPD measured crystallisation temperatures are probably quite representative and the presence of forsterite as the only crystalline phase among the colder dust population seems reasonable as its lower Ea/k would likely place less stringent requirements on the local gas density for crystallisation to occur by frictional heating. Shock annealing also favours the crystallisation of pure Mg-silicates since, for grains of similar sizes, Fe-silicates should remain cooler due to differences in grain density and heat capacity; while the greater emissivity of Fe-silicates should result in lower peak temperatures in optically thin regions, such that all but the smallest Fe-silicate grains remain amorphous (Nuth & Johnson 2006).
Alternatively, Molster et al. (1999) suggested a low-temperature process whereby a crystallisation front, driven by the release of latent heat of crystallisation, traverses the entire volume of a dust grain. Rietmeijer & Nuth (2013) noted that once the nucleation seed has formed, the crystallisation front travels at the speed of sound and grains even as large as 1 mm could be near-instantaneously transformed. We might speculate that a multi-scale amorphous domain structure could play a limiting role in such a process, potentially capable of assisting or hindering, depending on the energetics required to effect structural change within a given domain. Rietmeijer & Nuth (2013) suggest grains of amorphous olivine crystallised in this way should contain numerous silica inclusions.
The formation of cristobalite in the annealing experiments is also noteworthy in the current context. Silica is present at 2–20% levels in the cool components of T Tauri stars (Bouwman et al. 2001; Honda et al. 2003; van Boekel et al. 2005; Lisse et al. 2009; Sargent et al. 2009; Juhász et al. 2010), but is almost totally absent from carbonaceous chondrite meteorites. Tridymite and cristobalite have however been found in STARDUST samples from comet 81 P/Wild (Zolensky et al. 2006; Matrajt et al. 2008; Joswiak et al. 2012; Stodolna et al. 2012; Roskosz & Leroux 2015). In particular, Roskosz & Leroux (2015) found cristobalite in association with olivine in 5 out of 25 samples, which they suggest originated from a low-temperature solid–solid transformation of an amorphous precursor, rather than direct condensation and partial melting. They argue crystalline SiO2 is preferentially preserved in the cometary samples (over meteorites) due to not having undergone significant thermal aqueous alteration. The cometary occurrences suggest a possible bridge between the mineralogies of protoplanetary disks and the early solar system (Roskosz & Leroux 2015). Since we do not observe cristobalite forming in the Mg0.9Fe0.1SiO3 sample, the data presented here suggests cristobalite could be a high temperature phase associated with, and diagnostic of, Mg-rich-Fe-poor mineralogies. The lower SiO2 crystallisation temperature for amorphous Mg2SiO4 can be attributed to its higher percentage initial presence in that silicate, while for amorphous MgSiO3 its formation at higher temperature is the byproduct of forsterite/enstatite crystallisation (Thompson & Tang 2001).
5. Conclusions
Microwave drying offers a quick and straightforward method of producing amorphous silicates, capable of incorporating the astrophysically significant element Fe, which, until now, either formed oxides if dried in air, or required access to more complex facilities. Drying times of a few minutes are achievable using low-cost domestic equipment. The drying methods investigated in this paper all produce amorphous silicates containing domains 30–60 Å in size. Slow in-air drying tends to yield the largest average domain sizes, while vacuum drying, although similarly slow, yields the smallest. Microwave drying produces domains intermediate of these two. At much larger scales, all three methods yield silicates where variations in electron contrast due to variation in physical structure are ordered as mass fractal aggregates. However, the size distributions of both the aggregate forming monomers and the aggregates themselves are strongly influenced by drying method, most likely relating to the process by which water is removed from the gel during drying. Air- and microwave-dried silicates show the greatest similarity at this scale.
These physical differences carry over to their mid-IR spectroscopic behaviour, with microwave-dried silicates appearing intermediary of air- and vacuum-dried silicates in terms of the relative distribution of bridging and non-bridging oxygen’s, and their contributions to the 10 μm band profile. As such, the findings of this study highlight the variation in spectroscopic behaviour that can occur, for a given fixed composition, depending on how the silicate is formed. However, this may prove to be useful as deliberate variation of drying conditions could allow for the production of a range of same-composition silicates with differing physical and optical properties. In this respect there may be other parameters in the sol–gel process that can be systematically varied to further tune the final silicate. In this paper we have examined only the final drying step and additional control might be achieved by considering other steps in the sol–gel process. We are currently investigating the effect of gel ageing on the structure of the dried silicates; while it may also be possible to vary molar concentrations in the precursor solutions to enhance the relationship between hydrolysis and condensation.
We have also performed in situ annealing experiments on three microwave-dried amorphous silicates: Mg2SiO4, MgSiO3 and (Mg,Fe)SiO3 with 10% Fe. Of these, we found that the Mg2SiO4 crystallised to forsterite at the lowest temperature and the (Mg,Fe)SiO3 to forsterite at the highest. Between these, the MgSiO3 crystallised to multiple forsterite and enstatite phases. We also observed the formation of cristobalite at high temperature in the two Fe-free silicates. We discussed these findings in relation to the formation of crystalline grains in protoplanetary disks and derived values for the crystallisation activation energies, which we used to constrain the minimum in-disk temperatures grains must experience in order to crystallise within the 3 Myr lifetime of a typical disk. The necessary temperatures for crystallisation by thermal annealing by the central star would require grains to have experienced the innermost hot region 1–3 AU from the star. However, observed disk structures suggest grains occupying the cooler warm dust regions typically 3–5 AU from the star probably crystallised in situ, requiring a different crystallisation mechanism such as shock-wave heating. Amorphous Mg2SiO4 is found to have the lowest activation energy and may be the source of crystalline forsterite in such regions.
Acknowledgments
This work was supported by Diamond Light Source via beamtime award SM15125 and financial support for AH.
References
- Agladze, N. I., Sievers, A. J., Jones, S. A., Nurlitch, J. M., & Beckworth, S. V. W. 1996, ApJ, 462, 1026 [NASA ADS] [CrossRef] [Google Scholar]
- Aguiar, H., Serra, J., González, P., & León, B. 2009, J. Non-Cryst. Solids, 355, 475 [NASA ADS] [CrossRef] [Google Scholar]
- Argoud, R., & Capponi, J. J. 1984, J. Appl. Cryst., 17, 420 [CrossRef] [Google Scholar]
- Augsberger, M. S., Strasser, E., Perino, E., et al. 1998, J. Phys. Chem. Solids, 59, 175 [NASA ADS] [CrossRef] [Google Scholar]
- Basham, M., Filik, J., & Wharmby, M. T. 2015, J. Synchrotron Radiat., 22, 853 [CrossRef] [Google Scholar]
- Boss, A. P., & Durisen, R. H. 2005, ApJ, 621, L137 [NASA ADS] [CrossRef] [Google Scholar]
- Bouwman, J., Meeus, G., de Koter, A., et al. 2001, A&A, 375, 950 [NASA ADS] [CrossRef] [EDP Sciences] [Google Scholar]
- Bouwman, J., de Koter, A., Dominik, C., & Waters, L. B. F. M. 2003, A&A, 401, 577 [NASA ADS] [CrossRef] [EDP Sciences] [Google Scholar]
- Bouwman, J., Henning, T., Hillenbrand, L. A., et al. 2008, ApJ, 683, 479 [NASA ADS] [CrossRef] [Google Scholar]
- Burlitch, J. M., Beeman, M. L., Riley, B., & Kohlstedt, D. L. 1991, Chem. Mater., 3, 692 [CrossRef] [Google Scholar]
- Brawer, S. A., & White, W. W. 1975, J. Chem. Phys., 63, 2421 [NASA ADS] [CrossRef] [Google Scholar]
- Bressler, I., Pauw, B. R., & Thünemann, A. F. 2015, J. Appl. Cryst., 48, 962 [CrossRef] [Google Scholar]
- Brinker, C. J., & Scherrer, G. W. 1990, Sol-Gel Science: the Physics and Chemistry of Sol-Gel Processing (New York: Academic Press) [Google Scholar]
- Brucato, J. R., Colangeli, L., Mennella, V., Palumbo, P., & Bussoletti, E. 1999, A&A, 348, 1012 [NASA ADS] [Google Scholar]
- Chemtob, S. M., Glotch, T. D., & Rossman, G. R. 2010, Proc. 41st Lunar Planet. Sci. Conf., 2198 [Google Scholar]
- Ciaravella, A., Cecchi-Pestellini, C., Chen, Y.-J., et al. 2016, ApJ, 828, 29 [NASA ADS] [CrossRef] [Google Scholar]
- Day, K. L. 1974, ApJ, 192, L15 [NASA ADS] [CrossRef] [Google Scholar]
- Day, K. L. 1976a, ApJ, 210, 614 [NASA ADS] [CrossRef] [Google Scholar]
- Day, K. L. 1976b, Icarus, 27, 561 [NASA ADS] [CrossRef] [Google Scholar]
- Day, S. J., Thompson, S. P., Parker, J. E., & Evans, A. 2013, A&A, 553, A68 [NASA ADS] [CrossRef] [EDP Sciences] [Google Scholar]
- Efimov, A. M., Pogareva, V. G., & Shashkin, A. V. 2003, J. Non-Cryst. Solids, 332, 93 [NASA ADS] [CrossRef] [Google Scholar]
- Fabian, D., Jäger, C., Henning, Th., Dorschner, J., & Mutschke, H. 2000, A&A, 364, 282 [NASA ADS] [Google Scholar]
- Gail, H.-P. 2001, A&A, 378, 192 [NASA ADS] [CrossRef] [EDP Sciences] [Google Scholar]
- Gail, H.-P. 2004, A&A, 413, 571 [NASA ADS] [CrossRef] [EDP Sciences] [Google Scholar]
- Gail, H. P., & Sedlmayer, E. 1998, in The Molecular Astrophysics of Stars and Galaxies, eds. T. W. Hartquist, & D. A. Williams (Oxford: Clarendon Press), 285 [Google Scholar]
- Gillot, J., Roskosz, R., Depecker, C., Roussel, P., & Leroux, H. 2009, Planet. Conf. Ser., 1755 [Google Scholar]
- Gillot, J., Roskosz, R., Leroux, H., & Depecker, C. 2011, J. Non-Cryst. Sol., 357, 3461 [NASA ADS] [CrossRef] [Google Scholar]
- Guinier, A., Fournet, G., Walker, C. B., & Yudowitch, K. L. 1955, Small-Angle Scattering of X-rays (New York: John Wiley) [Google Scholar]
- Haisch, Jr., K. E., Lada, E. A., & Lada, C. J. 2001, ApJ, 553, L153 [NASA ADS] [CrossRef] [Google Scholar]
- Harker, D. E., & Desch, S. J. 2002, ApJ, 565, L109 [NASA ADS] [CrossRef] [Google Scholar]
- Hallenbeck, S. L., Nuth, J. A., & Daukantas, P. L. 1998, Icarus, 131, 198 [NASA ADS] [CrossRef] [Google Scholar]
- Honda, M., Kataza, H., Okamoto, Y. K., et al. 2003, ApJ, 585, L59 [NASA ADS] [CrossRef] [Google Scholar]
- Jäger, C., Molster, F. J., Dorschner, J., et al. 1998, A&A, 339, 904 [NASA ADS] [Google Scholar]
- Jäger, C., Dorschner, J., Mutschke, H., Posch, Th., & Henning, Th. 2003, A&A, 408, 193 [NASA ADS] [CrossRef] [EDP Sciences] [Google Scholar]
- Jones, A. P., & Nuth, III., J. A. 2011, A&A, 530, A44 [NASA ADS] [CrossRef] [EDP Sciences] [Google Scholar]
- Joswiak, D. J., Brownlee, D. E., Matrajt, G., et al. 2012, MAPS, 47, 471 [NASA ADS] [CrossRef] [Google Scholar]
- Juhász, A., Bouwman, J., Henning, Th., et al. 2010, ApJ, 721, 431 [NASA ADS] [CrossRef] [Google Scholar]
- Kakihana, M. 1996, J. Sol-Gel Sci. Technol., 6, 7 [CrossRef] [Google Scholar]
- Kitchen, H. J., Vallance, S. R., Kennedy, J. L., et al. 2014, Chem. Rev., 114, 1170 [CrossRef] [PubMed] [Google Scholar]
- Koike, C., Chihara, H., Tsuchiyama, A., et al. 2003, A&A, 399, 1101 [NASA ADS] [CrossRef] [EDP Sciences] [Google Scholar]
- Koike, C., Mutschke, H., Suto, H., et al. 2006, A&A, 449, 583 [NASA ADS] [CrossRef] [EDP Sciences] [Google Scholar]
- Kusabiraki, K. 1987, J. Non-Cryst. Sol., 95, 411 [NASA ADS] [CrossRef] [Google Scholar]
- Kusabiraki, K., & Shiraishi, Y. 1981, J. Non-Cryst. Solids, 44, 365 [NASA ADS] [CrossRef] [Google Scholar]
- Lenzuni, P., Gail, H. P., & Henning, Th. 1995, ApJ, 447, 848 [NASA ADS] [CrossRef] [Google Scholar]
- Mamajek, E. E. 2009, in Exoplanets and Disks: their Formation and Diversity, eds. T. Usuda, & Ishii (Melville, NY: AIP), AIP Conf. Ser., 1158, 3 [NASA ADS] [CrossRef] [Google Scholar]
- Li, M., & Xiao, L. 2016, ApJ, 820, 36 [NASA ADS] [CrossRef] [Google Scholar]
- Lin, D. N. C., & Papaloizou, J. 1980, MNRAS, 191, 37 [NASA ADS] [Google Scholar]
- Lindner, P., & Zemb, T. 1991, Neutron X-ray and Light Scattering (Amsterdam: Elsevier) [Google Scholar]
- Lisse, C. M., Chen, C. H., Wyatt, M. C., et al. 2009, A&A, 701, 2019 [Google Scholar]
- Matrajt, G., Ito, M., Wirick, S., et al. 2008, Meteor. Planet. Sci., 43, 315 [NASA ADS] [CrossRef] [Google Scholar]
- Miura, H., Tanaka, K. K., Yamamoto, T., et al. 2010, ApJ, 719, 642 [NASA ADS] [CrossRef] [Google Scholar]
- Molster, F. J., Yamamura, I. M., Waters, L. B. F. M., et al. 1999, Nature, 401, 563 [NASA ADS] [CrossRef] [Google Scholar]
- Molster, F. J., Waters, L. B. F. M., & Tielens, A. G. G. M. 2002, A&A, 382, 241 [NASA ADS] [CrossRef] [EDP Sciences] [Google Scholar]
- Murata, K., Chihara, H., Tsuchiyama, A., Koike, C., & Takakura, T. 2007, ApJ, 668, 285 [NASA ADS] [CrossRef] [Google Scholar]
- Murata, K., Chihara, H., Koike, C., et al. 2009a, ApJ, 697, 836 [NASA ADS] [CrossRef] [Google Scholar]
- Murata, K., Chihara, H., Koike, C., et al. 2009b, ApJ, 698, 1903 [NASA ADS] [CrossRef] [Google Scholar]
- Mysen, B. O., Finger, L. W., Virgo, D., & Seifert, F. A. 1982, Am. Mineral., 67, 686 [NASA ADS] [Google Scholar]
- Nuth, J. A., & Johnson, N. A. 2006, Icarus, 180, 243 [NASA ADS] [CrossRef] [Google Scholar]
- Nuth, J. A., Hallenbeck, S. L., & Rietmeijer, F. M. 2000, J. Geophys. Res., 105, 10387 [NASA ADS] [CrossRef] [Google Scholar]
- Oliveira, I., Olofsson, J., Pontoppidan, K. M., et al. 2011, ApJ, 734, 51 [NASA ADS] [CrossRef] [Google Scholar]
- Porod, G. 1951, Kollod-Z., 124, 83 [CrossRef] [Google Scholar]
- Prado, L. A. S. A., Ponce, M. L., Funari, S. S., et al. 2005, J. Non-cryst. Sol., 351, 2194 [NASA ADS] [CrossRef] [Google Scholar]
- Proffen, Th., & Page, K. L. 2004, Z. Kristallogr., 219, 130 [Google Scholar]
- Proffen, Th., Billinge, S. J. L., Egami, T., & Louca, D. 2003, Z. Kristallogr., 218, 132 [Google Scholar]
- Proffen, Th., Page, K. L., McLain, S. E., et al. 2006, Z. Kristallogr., 220, 1002 [Google Scholar]
- Rietmeijer, F. J. M., & Nuth, J. A. 2013, ApJ, 771, 34 [NASA ADS] [CrossRef] [Google Scholar]
- Rosotti, G. P., Ercolano, B., & Owen, J. E. 2015, MNRAS, 454, 2173 [NASA ADS] [CrossRef] [Google Scholar]
- Roskosz, M., & Leroux, H. 2015, ApJ, 801, L7 [NASA ADS] [CrossRef] [Google Scholar]
- Roskosz, M., Gillot, J., Capet, F., Roussel, P., & Leroux, H. 2009, ApJ, 707, L174 [NASA ADS] [CrossRef] [Google Scholar]
- Roskosz, M., Gillot, J., Capet, F., Roussel, P., & Leroux, H. 2011, A&A, 529, A111 [NASA ADS] [CrossRef] [EDP Sciences] [Google Scholar]
- Sabatier, G. 1950, Comptes Rendue Acad. Sci. Paris, 230, 1962 [Google Scholar]
- Sargent, B. A., Forrest, W. J., Tayrien, C., et al. 2009, ApJS, 182, 477 [NASA ADS] [CrossRef] [Google Scholar]
- Schmidt, P. W. 1991, J. Appl. Cryst., 24, 414 [CrossRef] [Google Scholar]
- Stancik, A. L., & Brauns, E. B. 2008, Vib. Spectrosc., 47, 66 [CrossRef] [Google Scholar]
- Stodolna, J., Jacob, D., & Leroux, H. 2012, Geochim. Cosmochim. Acta, 87, 35 [NASA ADS] [CrossRef] [Google Scholar]
- Strom, K. M., Strom, S. E., Edwards, S., Cabrit, S., & Skrutskie, M. F. 1989, AJ, 97, 1451 [NASA ADS] [CrossRef] [Google Scholar]
- Sturm, B., Bouwman, J., Henning, Th., et al. 2013, A&A, 553, A5 [NASA ADS] [CrossRef] [EDP Sciences] [Google Scholar]
- Sun, X., Shi, Y., Zhang, P., et al. 2011, J. Am. Chem. Soc., 133, 14542 [CrossRef] [Google Scholar]
- Suto, H., Sogawa, H., Tachibana, S., et al. 2006, MNRAS, 370, 1599 [NASA ADS] [CrossRef] [Google Scholar]
- Thompson, S. P. 2008, A&A, 484, 251 [NASA ADS] [CrossRef] [EDP Sciences] [Google Scholar]
- Thompson, S. P., & Tang, C. C. 2001, A&A, 484, 251 [Google Scholar]
- Thompson, S. P., Evans, A., & Jones, A. P. 1996, A&A, 308, 309 [NASA ADS] [Google Scholar]
- Thompson, S. P., Fonti, S., Verrienti, C., et al. 2002, A&A, 395, 705 [NASA ADS] [CrossRef] [EDP Sciences] [Google Scholar]
- Thompson, S. P., Fonti, S., Verrienti, C., et al. 2003, Meteor. Planet. Sci., 38, 457 [NASA ADS] [CrossRef] [Google Scholar]
- Thompson, S. P., Fonti, S., & verrienti, C., Blanco, A., Orofino, V., 2007, Adv. Space Res., 39, 357 [NASA ADS] [CrossRef] [Google Scholar]
- Thompson, S. P., Parker, J. E., Hill, T. P., et al. 2009, Rev. Sci. Instr., 80, 075107 [NASA ADS] [CrossRef] [PubMed] [Google Scholar]
- Thompson, S. P., Parker, J. E., Marchal, J., et al. 2011, J. Synchrotron Radiat., 18, 637 [CrossRef] [Google Scholar]
- Thompson, S. P., Parker, J. E., & Tang, C. C. 2012a, A&A, 545, A60 [NASA ADS] [CrossRef] [EDP Sciences] [Google Scholar]
- Thompson, S. P., Day, S. J., Parker, J. E., Evans, A., & Tang, C. C. 2012b, J. Non-Cryst. Sol., 358, 885 [NASA ADS] [CrossRef] [Google Scholar]
- Thompson, S. P., Parker, J. E., Day, S. J., Connor, L. D., & Evans, A. 2013, MNRAS, 434, 2582 [NASA ADS] [CrossRef] [Google Scholar]
- Thompson, S. P., Demyk, K., Day, S. J., et al. 2016, J. Non-Cryst. Sol., 447, 255 [NASA ADS] [CrossRef] [Google Scholar]
- van Boekel, R., Min, M., Leinert, C., et al. 2004, Nature, 432, 479 [NASA ADS] [CrossRef] [PubMed] [Google Scholar]
- van Boekel, R., Min, M., Waters, L. B. F. M., et al. 2005, A&A, 437, 189 [NASA ADS] [CrossRef] [EDP Sciences] [Google Scholar]
- Virgo, D., Mysen, B. O., & Kushiro, I. 1980, Science, 208, 1371 [NASA ADS] [CrossRef] [PubMed] [Google Scholar]
- Waters, L. B. F. M. 2015, EPJ Web Conf., 102, 00003 [CrossRef] [Google Scholar]
- Williams, J. P., & Cieza, L. 2011, ARA&A, 49, 67 [NASA ADS] [CrossRef] [Google Scholar]
- Wooden, D. H., Harker, D. E., & Brearley, A. J. 2005, in Chondrites and the Protoplanetary Disk, eds. A. N. Krot, E. R. D. Scott, & B. Reipurt (San Francisco, CA: ASP), ASP Conf. Ser., 341, 774 [NASA ADS] [Google Scholar]
- Wu, S., Zgang, S., & Tang, J. 2007, Mater. Chem. Phys., 102, 80 [CrossRef] [Google Scholar]
- Zolensky, M. E., Zega, T. J., Yano, H., et al. 2006, Sci, 314, 1735 [Google Scholar]
Appendix A: X-ray scattering
A.1. Total X-ray Scattering (TXS)
Materials with structural correlations that only extend over nanometre length scales produce only broad diffuse X-ray diffraction patterns and represent a size domain where traditional X-ray crystallographic methods are less effective. However, TXS provides a means of extracting structural correlations at nano-scale distances. Within a material with an average atomic number density, ρ0, the real-space distribution, G(r), of pairs of atoms is described by
 (A.1)
(A.1)
where δ is the Dirac delta function and rnm the distance separating the nth and mth atoms. The f(0) are the atomic form factors evaluated at zero magnitude of the X-ray scattering vector and, to a good approximation, are given by the atomic number, Z. The angle brackets indicate average values. Thus, for a known atomic structure, G(r) could be calculated over all atom pairs and would consist of a series of delta functions, each at some distance r corresponding to the separation distance between pairs of atoms.
G(r) can also be accessed experimentally via Fourier transform of the normalised TXS pattern, S(q),
![Mathematical equation: $$ \begin{aligned} G(r) = \frac{2}{\pi } \int _{q_{\rm min}}^{q_{\rm max}} q[S(q)-1]\sin (qr)\mathrm{d}q, \end{aligned} $$](/articles/aa/full_html/2019/04/aa34691-18/aa34691-18-eq5.gif) (A.2)
(A.2)
where q = 4πλ−1sinθ is the magnitude of the X-ray scattering vector. The qmin and qmax are defined by the experimental arrangement, however to provide adequate real-space resolution, and to decrease termination ripples in G(r) at short distances caused by the finite q range, TXS data collection must extend over as wide a range in q as possible, which requires high X-ray energy and wide scattering angles. S(q) is related to the measured data by,
 (A.3)
(A.3)
where Icoh(q) is the coherent scattering intensity, which is the measured pattern once it has been corrected for experimental effects (background scattering, detector dead-time and efficiency), sample dependent effects (Compton and multiple scattering) and normalized for incident flux. The sums are over all the atomic species, i, present in the material with concentration ci. The definition of S(q) has the square of the atomic form factor f(q) in its denominator, this becomes small for X-rays at high q and by dividing the measured intensity by this value there is a relative enhancement in the high q scattering, which carries the short-range information the method seeks to obtain. In practice TXS patterns appear visually similar to conventional powder patterns, but include the long decay tail extending well beyond the point where the Bragg diffraction dies out. Reviews of the TXS method are given by Proffen et al. (2003, 2006) and Proffen & Page (2004).
A.2. Small Angle X-ray Scattering (SAXS)
Scattering from large-scale structures is confined to very small values of the X-ray scattering vector, q, and for a collection of spheres of diameter D, the measured scattering at angles between 0 and  will be independent of their internal structure. The SAXS regime is defined by
  , where dA is the size of the largest interatomic distance. For
  interatomic structure is probed, while for
  , scattering is determined by particle size and morphology. Unlike Bragg diffraction, SAXS appears comparatively featureless due to there being little or no sharp variation in electron contrast over large spatial distances.
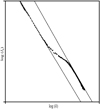 |
Fig. A.1. Schematic of a typical SAXS signal (points). The linear regions correspond to particles exhibiting Porod-like behaviour (Eq. (A.7)). |
The theory SAXS has long been described in the literature (e.g. Guinier et al. 1955; Lindner & Zemb 1991) and in a typical SAXS measurement, scattering is treated as arising from a two-phase system consisting of solid particles and either an inter-particle void space, or surrounding matrix. If the particles themselves are porous then an additional internal void space volume is also present in the total sample volume. The detection of SAXS thus relies on a detectable contrast between the electron densities of the phases/spaces present. A schematic SAXS dataset for a two-phase system plotted on a log–log scale is shown in Fig. A.1. Two characteristic linear regions, connected by a transition feature, can be seen that correspond to the surface envelopes of two large-scale structures that may, or may not, be related (e.g. two physically distinct structures embedded in a uniform matrix, or porous particles with internal void space).
The absolute scattering intensity per unit volume for a sample containing a volume fraction ϕ of monodisperse particles of characteristic length r and (electron) density ρ is given by
 (A.4)
(A.4)
F(qr) is the average squared form factor, which contains information on the size and shape of the scattering particles, while S(q) is the inter-particle interference function describing contributions to the measured intensity from the arrangement of particles relative to one another. In sufficiently dilute systems S(q)∼1. I0 is the scattering intensity at zero angle, which is related to the scatterer concentration cs (for a fixed particle volume VP within a total scattering volume Vr), with
 (A.5)
(A.5)
and
 (A.6)
(A.6)
being the scattering contrast between the two phases.
SAXS data are often interpreted in the literature via several standard graphical presentations:
-
Guinier plot lnI(q) vs q2. From the slope of the linear portion of this plot the radius of gyration, Rg, of the scattering objects can be obtained (slope
 , assuming spheroidal structures). This is the effective size of the scattering “particle”. An upturn from linearity at low q is indicative of aggregation, inter-particle interactions or high polydispersity, while a down turn at low-q indicates inter-particle repulsion.
 -
Porod plot log I(q) vs log q. The behaviour of I(q) in the linear regions of Fig. A.1 is described by Porod’s law, I(q)∝q−4 (Porod 1951). However this is for smooth regular particles with distinct interfaces and deviations away from Porod’s law reveals information about particle morphology and dimensionality. More generally,
 (A.7)
(A.7)where α can be determined from the slope of the linear regions and can indicate whether the constituent particles are organised as surface fractals of dimension DS, mass fractals of dimension DM, or as regular smooth shapes, related according to (Schmidt 2016; Prado et al. 2005),
 (A.8)
(A.8)and corresponding to different ranges of α:
-
1
< α < 3: the linear region is due to scatterers that are mass fractal in nature. Also termed volume, or bulky, fractals since both their surface and their bulk are not uniformly dense but form open structures with surface and inner parts having the same fractal dimension, i.e. DM = DS = α.
-
3
< α < 4: the scatterers are organised as surface fractals comprising dense cores and rough surfaces, i.e. DM = 3 and DS = 6 − α.
-
α
= 4: the scattering is from regular uniformly dense particles with smooth surfaces, i.e. DM = 3 and DS = 2.
Fractal structures exhibit self-similarity over certain length scales and Eq. (A.7), is expected to hold for the scattering intensity corresponding to an isotropic set of large scattering objects whose overall size is much larger than its constituent particles. The smallest fractal unit, termed a monomer, builds up larger structures and this pattern repeats itself until self-similarity is no longer observed, due to other physical factors. The length where self-similarity is no longer seen corresponds to the size of the fractal aggregate (i.e. particle radius), Lm; while the length at which self-similarity begins defines the monomer radius, r0. Both can be determined from the upper and lower limits (qmin and qmax) of the linear Porod regions (Schmidt 2016):
 (A.9)
(A.9) (A.10)
Equation (A.10) is similar to the q-space form of the Bragg equation d = 2πq−1, which can be identified with the distance between regions of similar scattering contrast. That is, we recover the Bragg concept if we consider the large scale structure to be composed of spheres of radius Lm whose centres are 2Lm apart.
-
1
-
Zimm plot I(q)−1 vs q2. From the linear sections of this plot a correlation length, ζ, is obtained (
 (slope/intercept)). At low-q this is related to the radius of gyration,
  , while at high-q
  . Departure from linearity at low-q can be indicative of non-homogeneity (or of chain-branching), while a negative intercept indicates phase separation.
 -
Kratky plot I(q)q2 vs q. This conveys information about the shape of the scattering system. For globular structures, Kratky plots exibit a bell-shape peak at low q and converge to the q axis at high q. Multiple peaks suggest multiple structures.
All Tables
Lengths and dimensions derived from the standard SAXS plots for the precursor gel and MgSiO3 silicate obtained by drying the precursor gel by microwave, in air and in vacuum.
SXPD refinement results (lattice parameters) for microwave-dried silicates at 995°C, with percentage contribution of each phase to the crystalline component of the fit and overall percentage contribution of these to the measured SXPD pattern (degree of crystallinity).
All Figures
|
Fig. 1. Successive steps during microwave drying of sol–gel: (1) the as-prepared gel, (2)–(6) after successive microwave exposures (900 W) of 1 min duration. Images shown are for Mg0.9Fe0.1SiO3, light brown colour of the dried product being due to Fe content. |
| In the text | |
|
Fig. 2. SEM micrograph (Hitachi TM1000) of amorphous MgSiO3 produced by microwave drying of sol gel. |
| In the text | |
|
Fig. 3. Wide and small angle X-ray scattering facilities at diamond light source: panel A: beamline I11 3-circle powder diffractometer, showing the 90°-arc position sensitive detector used for the present work; panel B: beamline I22 small angle scattering instrument shown configured with the 10 m camera length used for the present work. |
| In the text | |
|
Fig. 4. Measured SAXS data (solid line) for the MgSiO3 precursor gel phase presented in standard SAXS plots (see Appendix A.2). Panel A: Guinier plot; panel B: Porod plot; panel C: Zimm plot and panel D: Kratky plot (where the positions of a broad and a narrow feature are labelled K1 and K2 respectively). Dashed lines show fits to linear regions (labelled G1, P1, Z1 and Z2) in the Guinier, Porod and Zimm plots and from which various lengths and dimensions can be derived (see Appendix A.2 and text in Sect. 3.1.1.) |
| In the text | |
|
Fig. 5. Panel A: Monte Carlo fit to measured SAXS for the MgSiO3 precursor gel assuming spherical component “particles” produced by refining the particle size distribution (panel B). Panels C and D: fit and refined size distribution obtained for microwave-dried MgSiO3. Radius units are shown in nm. |
| In the text | |
|
Fig. 6. Standard SAXS plots (solid line) obtained for microwave-dried MgSiO3. Panel A: Guinier plot, panel B: Porod plot, panel C: Zimm plot and panel D: Kratky plot. Label convention for the linear and feature regions as per Fig. 4. |
| In the text | |
|
Fig. 7. Standard SAXS plots for air-dried (solid line) and vacuum-dried (dashed line) MgSiO3. Panel A: Guinier plot, panel B: Porod plot, panel C: Zimm plot and panel D: Kratky plot. Fit lines for the various linear portions not shown for clarity of comparison between air- and vacuum-dried data. |
| In the text | |
|
Fig. 8. Panel A: Monte Carlo fit to SAXS signal for MgSiO3 dried in air using spherical particle model and panel B: refined particle size distribution; panel C: fit to vacuum-dried MgSiO3 SAXS and refined particle size distribution (panel D). Radius units are shown in nm. |
| In the text | |
|
Fig. 9. Top: measured pair distribution functions out to 100 Å for MgSiO3 dried (A) in air, (B) in vacuum, (C) in microwave oven. Middle: pair distribution functions shown from 20 Å. Arrows indicate real-space length where the pair distribution amplitude goes to zero, marking size limit of coherent scattering domain for each silicate. Bottom: pair distribution functions for each silicate in the 1–20 Å range shown superimposed to show closely similar atomic structures. |
| In the text | |
|
Fig. 10. Top: synchrotron X-ray powder diffraction patterns for as-dried MgSiO3 silicates dried (A) in air, (B) in vacuum and (C) in microwave (patterns shown offset vertically for clarity). Bottom: corresponding FTIR spectra for the dried silicates: |
| In the text | |
|
Fig. 11. Decomposition of the 10 μm band for MgSiO3 dried in air (panel A), in vacuum (panel B) and in microwave (panel C). |
| In the text | |
|
Fig. 12. IR spectra in the region of the hydration bands for MgSiO3 dried in air (A), in vacuum (B) and by microwave (C). |
| In the text | |
|
Fig. 13. Decomposition of the 3 μm hydration band for MgSiO3 dried in air (panel A), in vacuum (panel B), by microwave (panel C). |
| In the text | |
|
Fig. 14. Mid-IR FTIR spectra (top) and SXPD patterns (bottom) for (A) Mg0.9Fe0.1SiO3 and (B) Mg2SiO4 produced by microwave drying. |
| In the text | |
|
Fig. 15. Decomposition of the 10 μm band for microwave-dried Mg0.9Fe0.1SiO3 (panel A) and Mg2SiO4 (panel B). |
| In the text | |
|
Fig. 16. SXPD patterns for in situ annealed MgSiO3. Panel A: temperature dependent crystallisation (patterns offset in y-direction). Bottom pattern is at 455°C (lower temperature scans omitted), top pattern is for 995°C, temperature step between displayed scans is 20°C. Panel B: diffraction patterns at the point where crystalline structure is first detected. Bottom pattern is at 705°C, top is 755°C, temperature step between displayed scans is 5°C. Panel C: SXPD scan at maximum annealing temperature 995°C showing multiple crystalline diffraction features. |
| In the text | |
|
Fig. 17. SXPD patterns for in situ annealed Mg0.9Fe0.1SiO3. Panel A. temperature dependent crystallisation (patterns offset in y-direction). Bottom pattern is at 455°C, top pattern is 995°C, temperature step between displayed scans is 20°C. Panel B: SXPD patterns at the point where crystalline structure is first detected, bottom pattern is at 850°C, top is 995°C, temperature step between displayed scans is 5°C. Panel C: SXPD scan at maximum annealing temperature 995°C showing limited crystalline diffraction. |
| In the text | |
|
Fig. 18. SXPD patterns for in situ annealed Mg2SiO4. Panel A: temperature dependent crystallisation (patterns offset in y-direction). Bottom pattern is at 455°C (lower temperature scans omitted), top pattern is for 995°C, temperature step between displayed scans is 20°C. Panel B: SXPD patterns at the point where crystalline structure is first detected. Bottom pattern is at 464°C, top is 584°C, temperature step between displayed patterns is 5°C. The two weak peaks at ∼16.5 and ∼23.6° 2θ are from residual NaCl. Panel C: SXPD pattern at maximum annealing temperature 995°C showing multiple crystalline diffraction features. |
| In the text | |
|
Fig. 19. Pawley whole pattern profile refinement fits to SXPD scans at maximum in situ annealing temperature (995°C). Panel A: MgSiO3, panel B: Mg0.9Fe0.1SiO3 and panel C: Mg2SiO4. |
| In the text | |
|
Fig. 20. Schematic showing temperatures at which features for the crystalline phases appear in the in situ SXPD data for the microwave-dried silicates. |
| In the text | |
|
Fig. 21. Crystallisation time as a function of temperature for the phases observed in the annealed microwave-dried amorphous silicates, calculated using the activation energies for each phase determined from the SXPD data. |
| In the text | |
|
Fig. A.1. Schematic of a typical SAXS signal (points). The linear regions correspond to particles exhibiting Porod-like behaviour (Eq. (A.7)). |
| In the text | |
Current usage metrics show cumulative count of Article Views (full-text article views including HTML views, PDF and ePub downloads, according to the available data) and Abstracts Views on Vision4Press platform.
Data correspond to usage on the plateform after 2015. The current usage metrics is available 48-96 hours after online publication and is updated daily on week days.
Initial download of the metrics may take a while.