Open Access
Fig. 6.
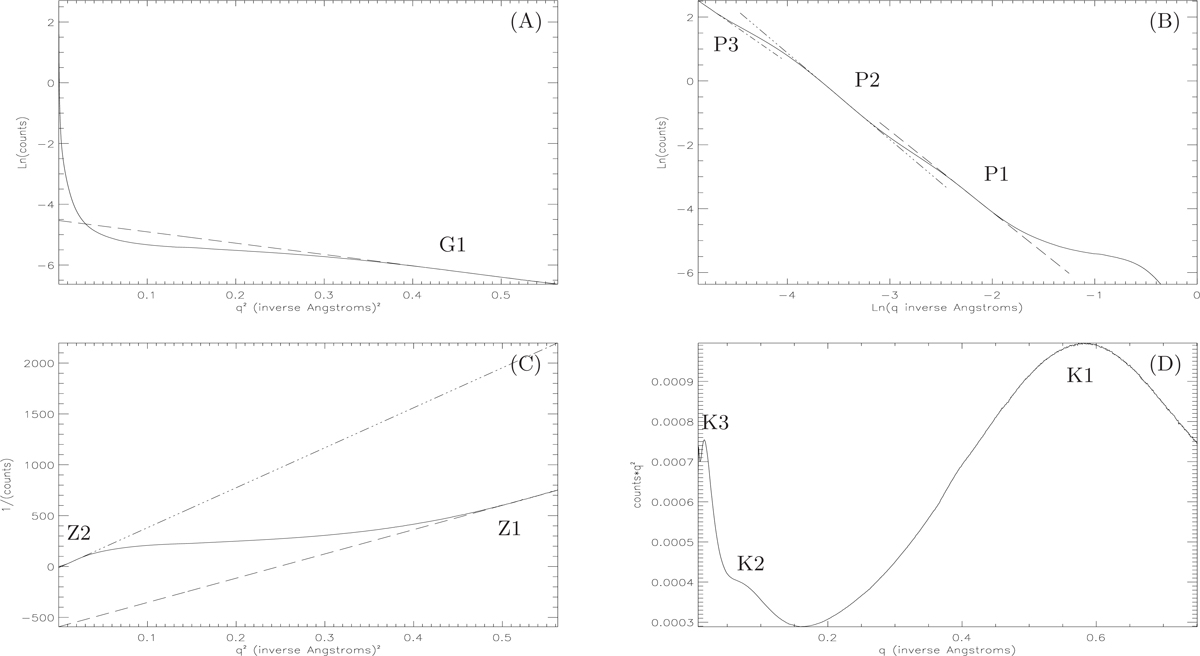
Standard SAXS plots (solid line) obtained for microwave-dried MgSiO3. Panel A: Guinier plot, panel B: Porod plot, panel C: Zimm plot and panel D: Kratky plot. Label convention for the linear and feature regions as per Fig. 4.
Current usage metrics show cumulative count of Article Views (full-text article views including HTML views, PDF and ePub downloads, according to the available data) and Abstracts Views on Vision4Press platform.
Data correspond to usage on the plateform after 2015. The current usage metrics is available 48-96 hours after online publication and is updated daily on week days.
Initial download of the metrics may take a while.