Open Access
Fig. 7.
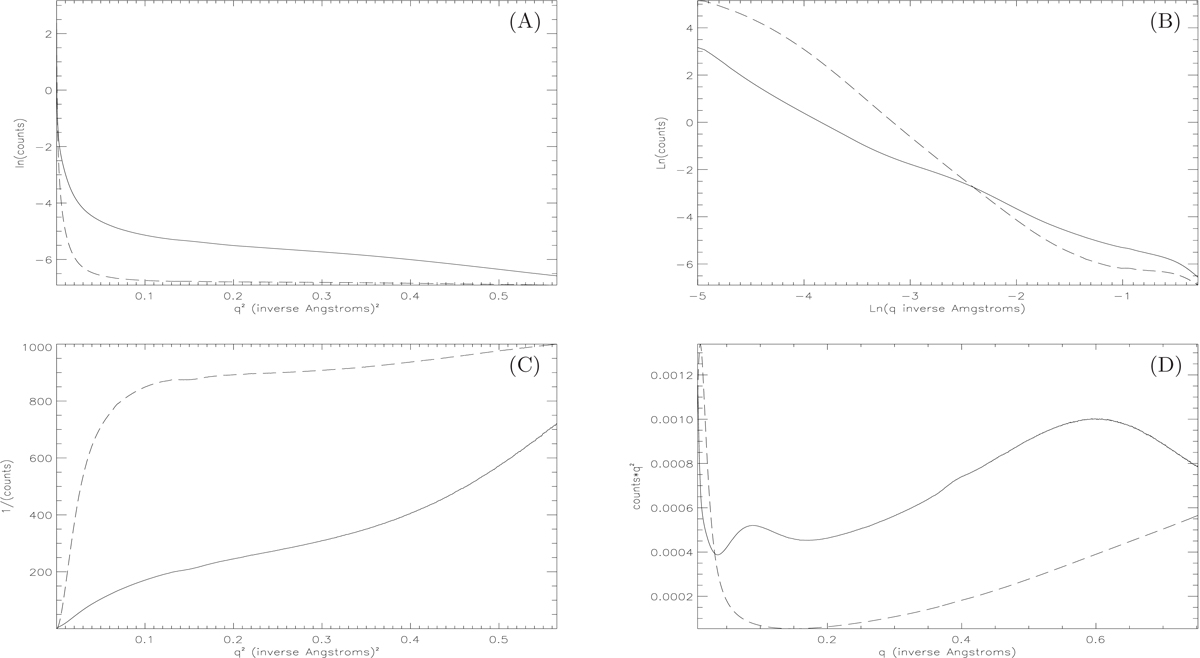
Standard SAXS plots for air-dried (solid line) and vacuum-dried (dashed line) MgSiO3. Panel A: Guinier plot, panel B: Porod plot, panel C: Zimm plot and panel D: Kratky plot. Fit lines for the various linear portions not shown for clarity of comparison between air- and vacuum-dried data.
Current usage metrics show cumulative count of Article Views (full-text article views including HTML views, PDF and ePub downloads, according to the available data) and Abstracts Views on Vision4Press platform.
Data correspond to usage on the plateform after 2015. The current usage metrics is available 48-96 hours after online publication and is updated daily on week days.
Initial download of the metrics may take a while.