Fig. 4.
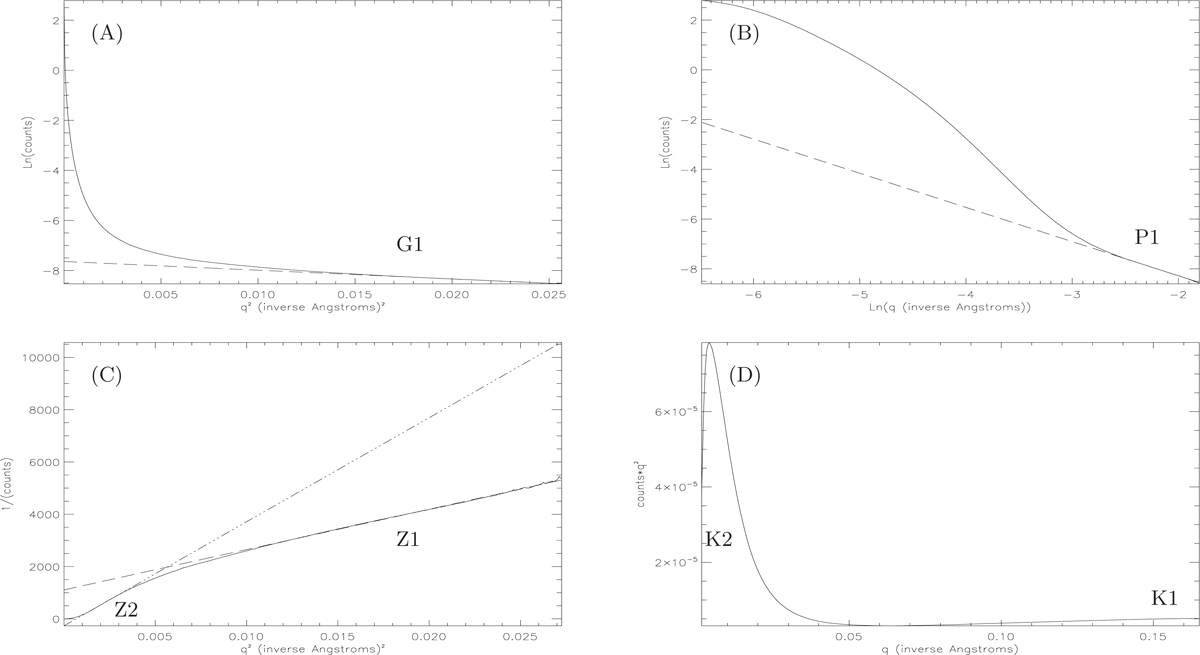
Measured SAXS data (solid line) for the MgSiO3 precursor gel phase presented in standard SAXS plots (see Appendix A.2). Panel A: Guinier plot; panel B: Porod plot; panel C: Zimm plot and panel D: Kratky plot (where the positions of a broad and a narrow feature are labelled K1 and K2 respectively). Dashed lines show fits to linear regions (labelled G1, P1, Z1 and Z2) in the Guinier, Porod and Zimm plots and from which various lengths and dimensions can be derived (see Appendix A.2 and text in Sect. 3.1.1.)
Current usage metrics show cumulative count of Article Views (full-text article views including HTML views, PDF and ePub downloads, according to the available data) and Abstracts Views on Vision4Press platform.
Data correspond to usage on the plateform after 2015. The current usage metrics is available 48-96 hours after online publication and is updated daily on week days.
Initial download of the metrics may take a while.