| Issue |
A&A
Volume 622, February 2019
|
|
|---|---|---|
| Article Number | A179 | |
| Number of page(s) | 11 | |
| Section | Galactic structure, stellar clusters and populations | |
| DOI | https://doi.org/10.1051/0004-6361/201732441 | |
| Published online | 21 February 2019 | |
J-PLUS: A wide-field multi-band study of the M 15 globular cluster
Evidence of multiple stellar populations in the RGB
1
Departamento de Astronomia, Instituto de Física, Universidade Federal do Rio Grande do Sul,
Porto Alegre,
RS, Brazil
e-mail: charles.bonatto@ufrgs.br, ana.chies@ufrgs.br
2
Universidade de São Paulo, São Paulo, Instituto de Astronomia, Geofísica e Ciências Atmosféricas,
SP, Brazil
3
Centro de Estudios de Física del Cosmos de Aragón,
Plaza San Juan 1,
44001
Teruel, Spain
4
Department of Astrophysics/IMAPP, rua General José Cristino, Radboud University,
Nijmegen, The Netherlands
5
Observatório Nacional,
RJ, Brazil
6
University of Michigan,
500 S State St,
Ann Arbor, USA
7
Departamento de Física, Universidade Federal de Sergipe,
Av. Marechal Rondon s/n,
49100-000
São Cristóvão,
SE, Brazil
8
AA-CSIC, Glorieta de la Astronomía S/N,
18008
Granada, Spain
Received:
8
December
2017
Accepted:
4
March
2018
Context. As a consequence of internal and external dynamical processes, Galactic globular clusters (GCs) have properties that vary radially. Wide-field observations covering the entire projected area of GCs out to their tidal radii (rtidal) can therefore give crucial information on these important relics of the Milky Way formation era.
Aims. The Javalambre Photometric Local Universe Survey (J-PLUS) provides wide field-of-view (2 deg2) images in 12 narrow, intermediate and broad-band filters optimized for stellar photometry. Here we have applied J-PLUS data for the first time for the study of Galactic GCs using science verification data obtained for the very metal-poor ([Fe/H] ≈−2.3) GC M 15 located at ~10 kpc from the Sun. Previous studies based on spectroscopy found evidence of multiple stellar populations (MPs) through their different abundances of C, N, O, and Na. Our J-PLUS data provide low-resolution spectral energy distributions covering the near-UV to the near-IR, allowing us to instead search for MPs based on pseudo-spectral fitting diagnostics.
Methods. We have built and discussed the stellar radial density profile (RDP) and surface brightness profiles (SBPs) reaching up to rtidal. Since J-PLUS FoV is larger than M 15’s rtidal, the field contamination can be properly taken into account. We also demonstrated the power of J-PLUS unique filter system by showing colour-magnitude diagrams (CMDs) using different filter combinations and for different cluster regions.
Results. J-PLUS photometric quality and depth are good enough to reach the upper end of M 15’s main-sequence. CMDs based on the colours (u − z) and (J0378 − J0861) are found to be particularly useful to search for splits in the sequences formed by the upper red giant branch (RGB) and asymptotic giant branch (AGB) stars. We interpret these split sequences as evidence for the presence of MPs. Furthermore, we show that the (u − z) × (J0378 − g) colour–colour diagram allows us to distinguish clearly between field and M 15 stars, which is important to minimize the sample contamination.
Conclusions. The J-PLUS filter combinations (u − z) and (J0378 − J0861), which are sensitive to metal abundances, are able to distinguish different sequences in the upper RGB and AGB regions of the CMD of M 15, showing the feasibility of identifying MPs without the need of spectroscopy. This demonstrates that the J-PLUS survey will have sufficient spatial coverage and spectral resolution to perform a large statistical study of GCs through multi-band photometry in the coming years.
Key words: globular clusters: general / globular clusters: individual: M 15 / surveys
© ESO 2019
1. Introduction
Galactic globular clusters (GCs) are among the most interesting – and beautiful – relics of the Milky Way formation epoch. Given their long-lived nature, some intrinsic properties (e.g. age, metallicity, and mass distribution) and the large-scale spatial distribution of GCs formed in the early phases of the Galaxy may provide clues to the Milky Way assembly process. In this sense, studies of GC properties can be used to set constraints to Galaxy formation models, as well as stellar and dynamical evolution theories.
In general, GCs are relatively isolated, self-gravitating, and dynamically relaxed (e.g. Dabringhausen et al. 2008) multi-particle systems. There is scarce evidence of the presence of dark matter in GCs, which is consistent with expectations for small dark-matter halos and, besides, they have low mass-to-light ratios (M∕LV ≈ 0.5 − 3.5 M⊙∕L⊙), probably because of the preferential loss of low-mass stars related to their advanced dynamical evolution (e.g. Dabringhausen et al. 2008).
Once considered as the prototypes of simple (or single) stellar populations and the building blocks of galaxies, GCs now have to be described by more complex – and theoretically challenging – scenarios, as shown by a growing number of works being published since the past decade (for recent reviews, see Gratton et al. 2012 and Bastian & Lardo 2018). More specifically, high-quality spectroscopy (e.g. Carretta 2015) and precision photometry (e.g. Piotto et al. 2007) led to the unambiguous detection of multiple stellar populations (MPs) in several Milky Way GCs as well as in old and young, massive extragalactic star clusters, likein the Magellanic Clouds (Milone et al. 2017), although it’s not clear if the processes acting on the young Magellanic Clouds clusters are the same at work in the old ones. The presence of MPs is so ubiquitous that it became a rule for high-mass (M > 2 × 10⁵ M⊙) GCs (Gratton et al. 2012). However, we remark that multiple populations have also been detected further down in the Galactic GC mass function, as are the recently reported cases of NGC 6362 (Dalessandro et al. 2014) and NGC 6535 (Piotto et al. 2015).
Spectroscopy is the most direct way to find systematic abundance variations among groups of stars and, thus, physically characterize MPs, but it is usually restricted to relatively small stellar samples. Photometry, on the other hand, has been shown to be an excellent alternative tool with which to search for MPs by tracking separate evolutionary sequences – in colour-magnitude diagrams (CMDs) of GCs – occupied by many stars. For its part, this technique relies on relatively high-precision photometry and, as such, Hubble Space Telescope (HST) data has helped revealing such features in different regions of many GCs (e.g. Piotto et al. 2007). However, most of the current spectroscopy and imaging on GCs has been based on data from instruments covering partially or even small fractions of the GC body, such as ACS, WFPC2 and WFPC3 (e.g. Milone et al. 2009, 2013) of HST, as well as FLAMES and FORS2 (e.g. Gratton et al. 2010; Nardiello et al. 2015) at the Very-Large Telescope (VLT/ESO). In fact, with a FoV of ~ 25′ in diameter, ESO/FLAMES can sample from the very centre to the rtidal of about half of the Galactic GCs listed in Harris (2010).
The Javalambre Photometric Local Universe Survey (J-PLUS)1 will observe 8500deg2 of the sky visible from the Javalambre Observatory in Spain with the panoramic camera T80Cam at the JAST/T80 telescope using a set of 12 broad, intermediate and narrow-band optical filters. Some of these filters are located at key stellar spectral features (see Table 1).
The wide-field (1.4° × 1.4°) capabilities of T80Cam may be an excellent tool to study integrated properties of Galactic GCs, such as mass and luminosity segregations, total mass, among others. Coupled to the set of 12 optimized narrow, intermediate, and broad-band filters – providing adequate sampling of the stellar spectral energy distribution (SED) – we will have tools to explore specific pseudo-spectral fitting diagnostics to photometrically infer about the presence of MPs. In addition, the data, covering all – or most – of the GC body, can also be used to search for MPs in different regions of the clusters. As a test case, we have obtained science verification data in the 12 J-PLUS bands for the GC M 15 (NGC 7078). M 15 is old (≳10 Gyr), and very metal-poor [Fe/H] = −2.3 (Carretta et al. 2009), located ~ 10 kpc away from the Sun and 10 kpc away from the Galactic centre (Harris 2010). The core and tidal radii of M 15 are (Harris 2010) rcore = 0.14′ (~0.4 pc) and rtidal = 21.5′ (~60 pc), respectively. It is a post-core-collapsed GC (Djorgovski & King 1986; de Marchi & Paresce 1996) where the presence of a central intermediate-mass black hole is still under debate (e.g. Kirsten et al. 2014).
MPs in M 15 have been detected both spectroscopically (e.g. Carretta et al. 2009) and photometrically (e.g. Lardo et al. 2011; Piotto et al. 2015). In particular, Larsen et al. (2015) employed photometry from HST/WFC3 and Sloan Digital Sky survey (SDSS) to confirm the presence of MPs (at least in the radial range 0.07′−2.2′ around the GC centre) in the lower red-giant branch (RGB), which is indicative of 1st and 2nd generation populations dominating at different cluster-centric distances. They found radial variations in possibly 3 populations of stars characterized by different abundances of C, N, O, and Na.
In this paper we have studied the stellar radial density and surface brightness profiles (RDP and SBP) for the 12 J-PLUS bands, covering the radial range from the centre to the tidal radius of M 15. When reaching the full radial range of a given GC, both kinds of profiles are important to study the large-scale structure and might provide crucial clues on the dynamical state. We have also investigated the evolutionary sequences of M 15 in different colour-magnitude diagrams (CMDs), and tried to detect MPs in its giant branches.
This paper is organized as follows: in Sect. 2 we briefly discuss the instrumentation and observations, and present the photometry. In Sect. 3 we show the spatial distribution of stars and surface brightness, in Sect. 4 we discuss properties of CMDs. Finally, discussions and our conclusions are given in Sect. 5.
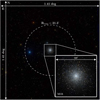 |
Fig. 1. Composite three-colour image of M 15 built with the J-PLUS filters J0515, J0660 and J0861; the tidal radius (rtidal ~21.5′) is fully encompassed by the observation, which shows the complete FoV of the instrument. Inset: magnification of the brightest part of M 15 (R ~5′). |
Informations on the observations of M 15.
2. Instrumentation and data
The J-PLUS survey is being carried out with the Javalambre Auxiliary Survey Telescope (JAST/T80), an 0.83 m, F/4.5 telescope with a German-equatorial mount and a Ritchey-Chrétien optical configuration. It is installed at the Observatorio Astrofísico de Javalambre (OAJ) in Spain. The focal plane corresponds to a Cassegrain layout with a field corrector of three spherical lenses of fused silica in the range 115–140 mm. The JAST/T80 field of view (FoV) has a diameter of 1.7° (110 mm), with full optical performance, reaching the 2.0° (130 mm) diameter with a slight vignetting (<1%) and slightly degraded image quality. The scientific instrument for the JAST/T80 telescope (and for J-PLUS) is the imager T80Cam, a wide-field camera installed at the Cassegrain focus. It is equipped with a large-format 9232 × 9216 pixels e2v CCD (10 μm pixel), with a 0.55′′ pixel−1 scale yielding a FoV of 1.4° × 1.4°, and a set of 12 broad, intermediate and narrow band filters. The high-efficiency CCD is read from 16 ports simultaneously, allowing readout times of 12s with a typical readout noise of 3.4 electrons (RMS).
The J-PLUS survey has been primarily conceived to perform the calibration for the main J-PAS2 survey data, and will observe more than 8500deg2 of the sky through a set of 12 filters. The photometric system of the survey is composed of 4 broad (g, r, i & z), two intermediate (u & J0861) and six narrow-band (J0378, J0395, J0410, J0430, J0515 & J0660) filters covering the whole optical range. This is an optimized filter system to properly recover the stellar parameters Teff, log (g) and [Fe/H], through the fitting of flux calibrated models of the observed stars. Further details are in Cenarro et al. (2019), hereafter referred to as Paper 0. Concerning the Javalambre Physics of the Accelerating Universe Astrophysical Survey (J-PAS), this survey will cover at least 8000 deg2 in approximately five years, using an unprecedented system of 56 narrow band filters in the optical. The main J-PAS instrument is a 2.5 m telescope with an effective FoV of 5 deg 2. Besides photometry, J-PAS will deliver high-quality redshift and low-resolution spectroscopy for hundreds of millions of galaxies. In addition to the present paper, the J-PLUS EDR and science verification data were used to refine the membership in nearby galaxy clusters (Molino et al. 2019), study the Hα emission (Logroño-García et al. 2019) and the stellar populations (San Roman et al. 2019) of several local galaxies, and compute the stellar and galaxy number counts up to r = 21 (López-Sanjuan et al. 2019).
In this paper we present science verification observations3 of the Galactic GC M 15, collected during the nights of 13 and 14 of November 2015. Table 1 summarizes the journal of the observations, provides basic information on the filters and gives some statistics on the photometric catalogues. Given the wide T80Cam FoV, a single pointing was more than enough to cover the entire projected area of M 15. At a distance from the Sun d⊙ ≈10 kpc, 1′ corresponds to ≈2.9 pc. To avoid saturation of bright RGB and AGB stars, the final co-added images consist of a relatively large number of short-exposure individual frames, with a minimum number of ten images. We remark that these science verification images are significantly deeper than those obtained with the adopted exposure-time for the standard J-PLUS strategy (see Paper 0). The number of stars and the limiting (faintest) magnitude detected with uncertainty < 0.5 mag in each image are also given in Table 1 for each filter.
Data reduction, photometric zero-points and co-added images for each filter were provided by OAJ/CEFCA (see Paper 0 for details). We have built photometric catalogues for all the J-PLUS filters by performing DAOPHOT PSF (Stetson 1987) photometry to each co-added image. The standard procedure of OAJ is to use SExtractor (Bertin & Arnouts 1996) to extract photometry for the stars present in a given image. However, for crowded fields such as those containing Galactic GCs, PSF DAOPHOT photometry reaches deeper photometric limits than SExtractor. In the present case, we reached limits of one to two magnitudes deeper than the standard J-PLUS SExtractor photometry. To build the PSF model, we have used stars distributed all over the co-added image of a given filter. Figure 1 is a three-colour composite image of M 15, which illustrates the wide-field capabilities of the instrument, reaching beyond the tidal radius of the cluster (rtidal ~21.5′ ~ 62 pc) with uniform photometry. We note that the K 648 planetary nebula (Kustner 1921; Pease 1928) appears as a greenish point located ≈30′′ (≈ 1.4 pc) to the north-east of M 15 centre.
The quality of the photometry in each filter can be assessed by the dependence of the uncertainty (1 σ) on the measured magnitude. These relations are shown in Fig. 2 for all stars contained in the final reduced images, whose panels contain only stars with uncertainties lower than 0.2 mag. In most cases, the error vs magnitude dependence follows the usual exponential increase after some magnitude. Most importantly, the uncertainty for stars in the RGB, horizontal branch (HB) and AGB is lower than 0.05 mag in all filters. Such small errors indicate that photometric scattering should not be significant along the evolutionary sequences occupied by these stars, as it will be shown later. Based on the above, we remark that only stars with photometric uncertainty <0.2 mag will be used in the remaining analysis. In addition, we also examine in the bottom panels of Fig. 2 the dependence of the average error (<σ>) on the distance to M 15 centre. As expected from crowding, there is a slight increase of <σ> for R≲5′ ( ≈ 15 pc) – especially for the filters redder than J0515, but hardly reaching 0.1 mag.
3. Full-scale radial analysis of M 15
Globular clusters have long been considered as excellent laboratories for the study of stellar dynamical processes (e.g. Noyola & Gebhardt 2007) and N-body simulations (e.g. Baumgardt 2017; Khalisi et al. 2007). Internal dynamical processes such as core-collapse, the presence of a central black hole, as well as the physics of the initial gravitational collapse will affect the central region in different levels, while external tidal stresses plus evaporation and ejection are expected to produce observable effects at larger radii (e.g. Noyola & Gebhardt 2007). These effects are expected to leave observable imprints on large-scale radial profiles. In this sense, it is desirable to have access to (uniform and relatively deep) photometric data that cover all – or most – of the GC body. In this section we discuss the radial behaviour of some properties obtained from our wide-field observations of M 15.
3.1. Stellar radial density distribution
The presence of structures on the stellar radial density distribution (RDP, defined as  ) – or star-count density – may provide important clues on the dynamical state of a GC. M 15, in particular, has evidence of being a post-core collapse GC (de Marchi & Paresce 1996) and, thus, the RDP of the very central region is critical. Here, we build the RDP with r photometry, because this is the catalogue containing the largest number of stars with errors < 0.2 mag (Table 1). The J-PLUS RDP - based on the isophotal centre coordinates (J2000) α = 21h: 29m:57. s26 and δ = 12°:09′:43′′.92 – covers the region from ~ 3′′ to well beyond the tidal radius (Fig. 3).
As expected from ground-based and relatively low-pixel resolution observations, completeness effects (crowding and limited photometric depth) around the central part of the GC should prevent a large fraction of the stars from being detected, especially for r≲3′. This, in turn, would result in a stellar RDP presenting significant departures from classical profiles that usually describe well the large-scale RDP of GCs (e.g. Miocchi et al. 2013), such as the three-parameter King (1962) and Wilson (1975) profiles. These effects are clearly present in the J-PLUS RDP of M 15 (Fig. 3). However, we remark that most of the missing stars are MS ones, and the main focus hereafter will be the brighter sequences, like the RGB, AGB and HB (Sect. 4).
Clearly, J-PLUS photometry is not adequate to probe the innermost region of such a populous and crowded GC as M 15 with the requiredresolution. Thus, the derivation of robust structural parameters of M 15 requires to complement the J-PLUS data with higher spatial resolution ones. In this context, the high spatial resolution of HST would be ideal to build a complementary data-set to probe the central region of M 15. An adequate data-set is the archival HST/ACS photometry of Sarajedini et al. (2007) and Anderson et al. (2008), which contains stars brighter than about 3 mags below the MSTO (F814W≲22). Given that this data-set fully encompasses the region R ≤0′.3, the resulting RDP was directly (no scaling applied) transposed to Fig. 3. Next, we used thearchival HST/WFC3 data-set of Larsen et al. (2015) to sample the annulus within 0′.3 ≤ R ≤2′.3 (this dataset excludes the central R≲10′′ region of M 15), which contains stars brighter than the sub-giant branch (F555W≲19). However, since this data-set provides only a partial coverage of M 15’s projected area, its RDP had to be multiplied by the factor 7.1 to provide a perfect match with the ACS RDP. The combined ACS+WFC3 RDP merges smoothly into the J-PLUS one at R ≈2′. The composite HST+J-PLUS RDP (Fig. 3) ends up sampling an unprecedented large radial range (0′.12 ≤ R ≤50′) with a relatively high quality.
Next, we fitted the classical three-parameter King profile4 to the composite RDP of M 15 (excluding the completeness-affected portion of the J-PLUS RDP) as a simplifying assumption. The free parameters are the central density of stars (σO ) and the background (sky) level, as wellas the core (rcore) and tidal (rtidal) radii. We obtain σO ~ 25 stars arcsec−2 (~ 1 × 10⁴ stars pc −2), σbg ≈ 7.2 × 10⁻⁴ stars arcsec−2, rcore = 0′.15 ± 0′.01 (~0.4 pc), and rtidal = 28′.6 ± 0′.9 (~ 83 pc). Integration of the RDP from the centre to rtidal gives a number of present-day member stars of ≈ 5.4 × 10⁴. The values of rcore and rtidal are consistent with previous determinations for M 15 (e.g. Harris 2010).
To further probe RDP properties, now we consider samples of stars belonging to different luminosity (or equivalently, mass) classes: main-sequence and giants. Based, for instance on the CMD shown in Fig. 6, we built samples of stars fainter and brighter than g = 18.2. A similar criterion was applied to the HST data, in the sense that the stars corresponding to a given RDP have a similar luminosity range – although coming from different samples. Next we built the RDPs (according to the recipe given above for joining RDPs of different data sets) followed by giants and main-sequence stars (inset of Fig. 3. It’s clear that the spatial distribution of giants is more concentrated than that of the main-sequence stars, which is consistent with expectations of long-termmass-segregation effects acting on a GC (e.g. McLaughlin & Fall 2008; Alessandrini et al. 2016). However, as a caveat we remark that number counts for faint stars may suffer from radially variable incompleteness – especially at the central part – and, consequently, the amplitude of the difference between the two profiles can be overestimated.
In Fig. 4 we show a colour (u – z) map of the high-stellar density region (R <5′) of M 15. Clearly, the central ~1′ − 2′ is populated predominantly by stars with redder colours when compared to more external regions, which is consistent with the differences in density between the RDP built with all stars and that restricted to RGB+AGB stars (Fig. 3).
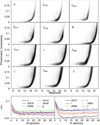 |
Fig. 2. Top panels: Photometric error as a function of the measured magnitude. Bottom panels: Average photometric error as a function of the distance to M 15 centre. Filters are indicated in panels. |
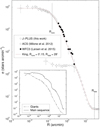 |
Fig. 3. Composite stellar radial density profile of M 15. HST data has been used for the region where J-PLUS suffers severe incompleteness (R ≤3′). Core and tidal radii derived from fitting the 3-par King profile are indicated. Inset: RDPs for main-sequence (solid line) and giant (dot-dashed) stars. |
 |
Fig. 4. Spatial distribution of the colour (u – z) across the inner 5′ of M 15. A redder colour near the centre is consistent with the relative central concentration of RGB and AGB stars. Stars distributed along the blue and red sequences in Fig. 8 are shown as blue triangles and black squares, respectively. Vertical bar shows the colour scale. |
3.2. Surface brightness profiles
Next we built the SBPs as a function of the distance to the cluster centre for all the filters (Fig. 5). In general terms, SBPs are considered as an easily obtained tool that can be used to derive the internal GC mass distribution by means of de-projection. Dynamical models of GCs usually require parameters such as the central surface brightness and the half-light radius, which can be derived from King (1962) profile fits to the observed SBP. In the present case, the SBPs are built similarly to the RDPs (Sect. 3.1), in the sense that the individual luminosities of all stars within concentric rings are summed up and later converted to surface brightness. Consequently, the final SBPs end up having a similar spatial resolution as the J-PLUS RDPs. The J-PLUS SBPs of M 15 (Fig. 5) are smoother and less sensitive to completeness than the star-counts corresponding to the RDP (Fig. 3).
Similarly to the RDP, the relatively coarse resolution of the telescope + camera system (Sect. 2) does not allow the J-PLUS SBPs to resolve in detail the collapsed core of such a distant GC as M 15. Nevertheless, they can be adequately fitted by the 3-par King profile. The resulting parameters are in Table 2. Despite the significant uncertainties – especially in rtidal – the structural radii derived from the SBPs are very similar to the HST+J-PLUS composite RDP ones (Fig. 3).
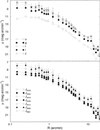 |
Fig. 5. Surface brightness profiles for the narrow (top panel) and broad-band (bottom panel) filters. |
King fit to the J-PLUS SBPs of M 15.
4. J-PLUS colour-magnitude diagrams
Among other issues, the presence of multiple populations in GCs has raised great interest in the recent literature (e.g. Gratton et al. 2012). The wide-field T80 photometry, complemented with its special filter system, may be a valuable tool to reveal and characterize MPs in CMDs.
Despite its location at a relatively high Galactic latitude (b = −27.31°), a significant number of field stars is present across the area on the sky occupied by M 15, and the wide FoV of T80Cam – including a wide area beyond its tidal radius that can be used as comparison field – is adequate to take their contamination into account. As already implied by the RDP (Fig. 3), the contamination is not expected to be excessive, at least at the central part of M 15. In any case, we applied the decontamination algorithm developed by Bonatto & Bica (2007) to minimize the presence of field stars on CMDs and produce cleaner photometry. In summary, the algorithm assumes that the colour and magnitude distribution of the contaminant stars across the cluster area is the same as that displayed by the offset field, with differences essentially related to the relative densities. Thus, the algorithm divides the observed colour and magnitude space (of the cluster and the area-corrected offset field) in a grid of cells and builds the respective Hess diagrams. Then it computes the cluster intrinsic stellar density, which is simply the difference between both Hess diagrams. The cell size of the Hess diagrams are considerably wider than the photometric errors but small enough to preserve the morphology of the evolutionary sequences. The efficiency of this approach relies heavily on the colour and magnitude representativity of the offset field with respect to the contaminant stars. In Fig. 6 we illustrate the decontamination process for two different colours; one exclusive to J-PLUS (u - z) and the widely used (g – r). Field contamination accounts only for ~2% and ~ 9% of the stars present, respectively in the CMDs g × (g – r) and u × (u – z) in the central 5′ region of M 15, which is consistent with the high density contrast between the RDP in this region and that beyond the tidal radius (Fig. 3). These fractions increase to ~58% and ~40% in the region 10′ –20′. Field stars in both CMDs have colours and magnitudes distributed mainly across the RGB (and main-sequence turnoff – MSTO) of M 15. Some contamination – especially for bright stars – remain in the final CMDs.
We note that, instead of the discrete CMDs, in what follows we will mostly use their continuous counterpart, the Hess diagrams. Hess diagrams (Hess 1924) contain the relative density of occurrence of stars in different colour-magnitude cells of the Hertzsprung-Russell diagram; photometric uncertainties are explicitly taken into account in the density computation. In short, the CMD is divided into a grid of cells, and the fraction of the colour and magnitude of all stars is computed for each cell. Compared to CMDs, Hess diagrams provide a clearer view of the evolutionary sequences, especially in those having a large number of (usually superimposed) stars. The decontaminated Hess diagrams are typical of a very metal-poor GC, displaying a prominent blue-HB and reaching the upper RGB. The main-sequence turnoff is detected in both filters, but especially the g.
Interestingly, among the several possible colour–colour combinations, we found one that separates field from M 15 stars. In Fig. 7 we show the colour–colour diagram (u – z) vs. (J0378 – g) for all stars present in the inner 5′. We note that there are two visible sequences for colours redder than ~ 1, but merging together for bluer values in both colours. As shown in the corresponding CMD (inset), each sequence corresponds to either of the expected stars of M 15 and the field. We note that the separation occurs more clearly for stars brighter than the bottom of the RGB; field and M 15 main-sequence stars merge together. If the separation between these two sequences holds for GCs of any metallicity and/or projected towards any direction in the Galaxy, such a colour–colour diagram may become a valuable discriminator of field and GC stars. The GC and field stars colour–colour separation will be subsequently verified for GCs with higher metallicity and different directions than M 15. However, we remark that, contrarily to the quantitative decontamination algorithm applied above (Fig. 6), the colour–colour separation of sequences does not take the relative stellar density (GC member to field stars) into account. In this sense, it serves only to provide a qualitative perspective of the intrinsic morphology of the evolutionary sequences of a given GC. In the case of M 15, it separates only stars brighter than the main-sequence turnoff.
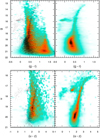 |
Fig. 6. Field-star decontamination illustration in different colours. Left panels: Hess diagram of the underlying field stars is compared to the CMDs extracted in the inner 5′ of M 15 (small black points). Right panels: Hess diagrams built with the decontaminated photometry. |
Can we detect multiple populations?
Spectroscopically, MPs are characterized by populations of stars having different chemical compositions, particularly of the light elements, including He, C, N, O, and Na (e.g. Milone et al. 2014; Gratton et al. 2012; Pancino et al. 2010). Moreover, depending on the photometric quality, MPs can show up as splits in the evolutionary sequences from the main sequence to the giant branch (e.g. Gratton et al. 2012). Quite recently, Gruyters et al. (2017) report the first ever detection of MPs along the AGB of NGC 6752, obtained with Strömgren photometry.
Coupling photometry from HST/WFC3 (for the centre) and SDSS (for R≳1 pc) to chemical enrichment models, Larsen et al. (2015) showed evidence of multiple populations (characterized by N-normal and N-enhanced compositions) of red giants that are differently distributed in M 15, at least in the radial range 4′′ −130′′. Exploiting the well-established sensitivity of UV photometry to light-element abundance variations – accessible with WFC3/HST filters – they found that giants in the lower RGB with primordial composition are more centrally concentrated, with a reversal of the trend for radii greater than 1′. Larsen et al. (2015) also found that the observed spread of the RGB stars in the colour (F343N − F555N) is significantly larger than that expected from photometric uncertainties, thus likely characterizing intrinsically different populations of stars.
The spectral distribution of the 12 J-PLUS bands may provide an adequate means to distinguish between atmospheric effects related to light-element abundance variations and those impacting the stellar structure. In this context, we have used the J-PLUS bands that are more sensitive to metallic bands (Table 1 and Fig. 11) to build CMDs reaching to the upper RGB and AGB (Fig. 6), to search for the colour that best presents evidence of sequence splits. This separation is more clearly visible with the bluest and reddest J-PLUS filters, u × (u − z) followed by J0378 × (J0378 − J0861). In the top panels of Fig. 8 we show the Hess diagrams corresponding to the CMDs (u vs. (u – z) and J0378 vs. (J0378 – J0861)) extracted from the central 5′, with field-decontaminated photometry. We note that the RGB appears to split into two sequences from u≲17 and J0378≲16.5. The splits are considerablywider than what would be expected from photometric scattering, as can be seen by the average error bars (Fig. 8). Fiduciallines – arbitrarily built to represent the mean path followed by each sequence – are included in Fig. 8 as a visual aid.
Visually considering the sequence split and guided by the fiducial lines in the u × (u − z) CMD, we separated the stars in blue and red sub-samples, and took their magnitudes in the other J-PLUS filters. We remark that when these stars are directly transposed into the J0378 × (J0378 − J0861) CMD, most of them consistently fall in the corresponding (blue and red) sequences.
To check whether any potential systematic effect might have been introduced on the images by the 2D-calibration process, thus producing gradients or affecting one corner more than the others, we plot in Fig. 4 the locii occupied by the upper RGB+AGB stars that define the blue and red sequences seen in Fig. 8. It turns out that both samples are more or less equally randomly distributed across the image, thus ruling out systematic calibration effects as a possible cause of the split.
The presence of the split along the RGB can be better visualized using rectified evolutionary sequences. We do this by first building a guiding line (GL), which is the median between the fiducial lines corresponding to the blue and red stellar sub-populations shown in the top-left panel of Fig. 8. Then we divide the GL in a series of segments (of same size) and, for each segment we compute the stellar density in the direction perpendicular to the segment, in both sides of the GL. In practice, we compute the angle of the segment direction (in the CMD) with respect to the vertical, and apply the corresponding rotation to the position (colour and magnitude) of all stars (and uncertainty). The final result is shown in Fig. 9, which also shows the portion of the CMD to be rectified and the stellar-density profiles (1 mag wide) extracted from bins projected in the direction perpendicular to the GL. The split appears to start at a distance along the GL ≈ 2.2, which corresponds to u ~ 17.
Next, we investigate (Fig. 10) the radial dependence of the upper-RGB split by means of CMDs extracted from different radial bins for u × (u − z). The fiducial lines built for the full 5′ region CMD are directly overplotted in the CMDs built for the 0′ –2′, 2′ –3′, 3′ –4′ and 4′ –10′ radial bins, with no shifts applied. One can conclude that the split can be detected at least up to 3′ from the centre of the cluster, and maybe reaching 4′. This is expected, as the RGB stars are essentially concentrated towards the centre of the cluster (see Fig. 3).
To further search for clues to the origin of the detected split, we build the average J-PLUS SEDs for the stars in each sequence. Magnitudes in each filter are transformed into flux, averaged out and normalized to the flux at g for comparison purposes. The result is shown in Fig. 11. On average, blue-sequence stars have higher flux than red-sequence ones for λ≲4500 Å, with the trend consistently reversing otherwise. This is consistent with the blue sequence stars being systematically slightly hotter than the red sequence stars. This is the expected behaviour if we interpret the blue-sequence stars as being RGBs from the primordial sub-population of the cluster, while the red-sequence would correspond to the sub-population of RGBs with altered chemistry for C, N, O and Na – see, for example, Figs. 1 and 2 in Larsen et al. (2015), which show qualitatively the same behaviour, but for different – but analogous – bands. It is clear that the flux (and magnitude) differences between both sequences are systematic and not related to a particular band. In the lower panel of Fig. 11 we further explore qualitatively this interpretation. We show synthetic models of RGB stars computed as in Coelho et al. (2011) and Coelho (2014), degraded to medium resolution for easier visualization. The spectrum in black is from an RGB star with the chemistry of a primordial sub-population in a cluster with similar metallicity as M 15 (Teff = 4500 K, log g = 1.5, [Fe/H] = −2.3 dex, [α∕Fe] = 0.4 dex). The red one is from a cooler RGB (Teff = 4250 K, same logg and [Fe/H] as the black spectrum) but with variations in the abundances of C, N, O, Na and He. The similarity between theobserved and the synthetic SEDs is seen clearly. Although just qualitatively, this analysis may provide some clues to what is causing the split. Additionally, we remark that stellar evolution models have shown that an increase in the abundance of He changes the overall properties of the stellar population by increasing Teff of the stars, while C, N, O, and Na do not (e.g. Cassisi et al. 2017). This effect will in turn also affect spectroscopy sensitive to Hydrogen lines (e.g. Coelho et al. 2011). Considering the above, we find evidence that pseudo-spectral fitting has potential to trace chemical variations among stars, though a quantitive analysis will be explored in future work.
Besides being sensitive to stellar temperature, some of the J-PLUS filters may also be sensitive to metallicity. For instance, J0378 (and u) overlaps the NH molecule in the near-UV, while J0861 (and z) encompasses the Ca II Triplet in the near-IR. In this sense, the colours (J0378 − J0861) and (u − z) may be sensitive to differences in the N and Ca abundances. The wavelength range covered by u also includes features known to be sensitive to the variations of C and N typical of clusters with multi-populations (Coelho et al. 2011, 2012). Exploring the sensitivity of the WFC3/HST filters F275W, F336W, and F438W to the molecular bands OH, NH, and CN + CH, respectively, Piotto et al. (2015) have shown that the pseudo-colour C = (mF275W − mF336W) − (mF336W − mF438W) splits the RGB of M 15 in at least 2 sequences (see their Fig. 22).
As another suggestion that the split observed in the u × (u − z) and J0378 × (J0378 − J0861) CMDs is likely related to light-elements abundance, in the bottom panels of Fig. 8 we show the CMDs J0410 × (J0410 − J0660) and g × (g − r). J0410 and J0660 overlap Hδ and Hα, respectively, while both g and r are very broad and encompass several lines and continuum. There is still some separation (albeit marginal) between the blue and red samples in the J0410 × (J0410 − J0660) CMD, but much less clear the in the previous CMDs. However, they become mostly mixed up in the g × (g − r) CMD, thus suggesting that the separation is indeed related to the light-elements abundance variations.
In summary, it seems quite plausible that additional J-PLUS filter combinations – such as J0378 and J0861 – can separate MPs in Galactic GCs, even for such a low-metallicity GC as M 15. Thus, it would be interesting to investigate the effect on the J-PLUS filters produced by a GC hosting two sub-populations characterized by the sameoverall metallicity but presenting topical abundance changes. Since M 15 is very metal-poor, the next obvious target is a metal-rich GC, and Harris (2010) contains 22 GCs more metal-rich than [Fe/H] = −1.0 and closer than d⊙~ 10 kpc from the Sun.
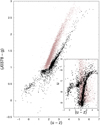 |
Fig. 7. (u – z) vs. (J0378 – g) colour–colour diagram for the stars located within 5′ from the centre of M 15. Stars in each sequence correspond to M15 (black points) and field (brown). Their locations in the corresponding CMD are shown in the inset. |
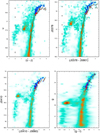 |
Fig. 8. Top panels: CMDs that best show evidence of more than one population, extracted from the central 5′ of the cluster. Fiducial lines for the apparent sequence split in the upper RGB are shown, together with the average error bars computed in bins 0.5 mag wide. Stars of the blue and red sequences are overplotted on the Hess diagram. Bottom panels: same as above for combinations of filters that are not much sensitive to light element abundance variations. |
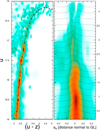 |
Fig. 9. Left panel: portion of the CMD to be rectified along the guiding (continuous) line (GL); the position of the individual sectors along the GL is marked (circles). Right panel: rectified stripe ( ≈ 1 mag wide) of the RGB/AGB overplotted with the stellar density profiles (dotted lines) extracted from sectors perpendicular to the GL; distance along the GL is marked on the right axis; profiles are normalized to their peak value for visualization purposes. |
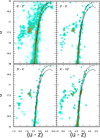 |
Fig. 10. CMDs extracted from different regions to show that the RGB split extends up to ~ 4′ from the cluster centre. |
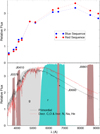 |
Fig. 11. Top panel: average J-PLUS SEDs for the stars in the blue and red sequence splits. Normalized at g for comparison purposes. Bottom panel: synthetic spectra by Coelho et al. (2011) and Coelho (2014) representing a RGB of a primordial sub-population in black (Teff = 4500 K, log g = 1.5, [Fe/H] = −2.3 dex, [α∕Fe] = 0.4 dex, Y = 0.256), and a slightly cooler giant representing a secondary population in red (Teff = 4250 K, log g = 1.5, [Fe/H] = −2.3 dex, [α∕Fe ] = 0.4 dex, [C∕Fe ] = −0.30 dex, [N∕Fe ] = +1.20 dex, [O∕Fe ] = −0.45 dex, [Na∕Fe ] = +0.60 dex, Y = 0.300). J-PLUS filters used in Fig. 8 are highlighted. |
5. Concluding remarks
In this paper we present science verification (or Phase III) data obtained with the 12 J-PLUS filters for the M 15 globular cluster. This data set was obtained as a test-case to investigate the potential applications of J-PLUS to the study of Galactic GCs by means of the instrument’s wide field capabilities and the full set of narrow and broad-band filters photometry.
M 15 is very metal-poor ([Fe/H] = −2.3) and relatively distant from the Sun (d⊙~ 10 kpc). Even so, the filter combination (u − z) is able to show the presence of MPs by means of an upper-RGB split. (J0378 − J0861) also shoes similar behaviour, though witj lower significance. In the case of M 15, the split is detected at least up to ~ 3′ (~ 8.7 pc) from the cluster centre.
A follow-up to the findings presented here is underway using similar observations of closer and less metal-poor GCs. In fact, Harris (2010) catalogue lists 22 GCs more metal-rich than [Fe/H] = −1.0 and closer than d⊙ ~ 10 kpc from the Sun. All of them can be observed by S-PLUS5, the southern counterpart of J-PLUS, while 8 are accessible from the northern facility.
Finally, it is interesting to remark that the J-PLUS (and S-PLUS) T80Cam FoV (1.4° × 1.4°) is wide enough to collect multi-filter photometry reaching beyond the tidal radius of the vast majority of the Galactic GCs, the exceptions being 47 Tuc, NGC 6752 and Omega Cen, for which the tidal radius is slightly larger than the FoV (Harris 2010). Thus, it’s clear that these narrow-band surveys can provide photometrically uniform and relatively deep observations encompassing most of the member stars in a single pointing for all Galactic GCs. In addition, it prepares the community to exploit the potential of narrow-band filter diagnostics to identify and characterize MPs. This is timely in light of the upcoming J-PAS, when we might be able to analyse the chemistry of the SEDs through its extensive set of 54 narrow-band filters. This opens a window through which to study properties – including multiple stellar populations – in different spatial regions of a GC body, for clusters characterized by different metallicity values and located in different environments.
Acknowledgements
The authors thank an anonymous referee for interesting comments and suggestions. We acknowledge financial support from the Spanish Ministry of Economy and Competitiveness through grants AYA2012-30789, AYA2015-66211-C2-1-P and AYA2015-66211-C2-2. CJB, ACS and PC thank CNPq for partially financing this work. LSJ acknowledges support from FAPESP (0800) and CNPq. We acknowledge the OAJ Data Processing and Archiving Unit (UPAD) for reducing and calibrating the OAJ data used in this work. Based on observations made with the JAST/T80 telescope at the Observatorio Astrofísico de Javalambre, in Teruel, owned, managed and operated by the Centro de Estudios de Física del Cosmos de Aragón. We acknowledge the OAJ Data Processing and Archiving Unit (UPAD) for reducing and calibrating the OAJ data used in this work. Funding for the J-PLUS Project has been provided by the Governments of Spain and Aragón through the Fondo de Inversiones de Teruel, the Aragón Government through the Reseach Groups E96 and E103, the Spanish Ministry of Economy and Competitiveness (MINECO; under grants AYA2015-66211-C2-1-P, AYA2015-66211-C2-2, AYA2012-30789 and ICTS-2009-14), and European FEDER funding (FCDD10-4E-867, FCDD13-4E-2685). RAD acknowledges support from CNPq through BP grant 312307/2015-2, CSIC through grant COOPB20263, FINEP grants REF. 1217/13 – 01.13.0279.00 and REF 0859/10 – 01.10.0663.00 for partial hardware support for the J-PLUS project through the National Observatory of Brazil.
References
- Alessandrini, E., Lanzoni, B., Ferraro, F. R., Miocchi, P., & Vesperini, E. 2016, ApJ, 833, 252 [NASA ADS] [CrossRef] [Google Scholar]
- Anderson, J., Sarajedini, A., Bedin, L. R., et al. 2008, AJ, 135, 2055 [NASA ADS] [CrossRef] [Google Scholar]
- Bastian, N., & Lardo, C. 2018, ARA&A, 56, 83 [NASA ADS] [CrossRef] [Google Scholar]
- Baumgardt, H. 2017, MNRAS, 464, 2174 [NASA ADS] [CrossRef] [Google Scholar]
- Bertin, E., & Arnouts, S. 1996, A&AS, 117, 393 [NASA ADS] [CrossRef] [EDP Sciences] [Google Scholar]
- Bonatto, C., & Bica, E. 2007, MNRAS, 377, 1301 [NASA ADS] [CrossRef] [Google Scholar]
- Carretta, E. 2015, ApJ, 810, 148 [NASA ADS] [CrossRef] [Google Scholar]
- Carretta, E., Bragaglia, A., Gratton, R., D’Orazi, V., & Lucatello, S. 2009, A&A, 508, 695 [NASA ADS] [CrossRef] [EDP Sciences] [Google Scholar]
- Cassisi, S., Salaris, M., Pietrinferni, A., & Hyder, D. 2017, MNRAS, 464, 2341 [NASA ADS] [CrossRef] [Google Scholar]
- Cenarro, A. J., Moles, M., Cristóbal-Hornillos, D., & J-PLUS collaboration 2019, A&A, 622, A176 [NASA ADS] [CrossRef] [EDP Sciences] [Google Scholar]
- Coelho, P. R. T. 2014, MNRAS, 440, 1027 [NASA ADS] [CrossRef] [Google Scholar]
- Coelho, P., Percival, S. M., & Salaris, M. 2011, ApJ, 734, 72 [NASA ADS] [CrossRef] [Google Scholar]
- Coelho, P., Percival, S., & Salaris, M. 2012, in Astronomical Society of India Conference Series, Vol. 6, eds., P. Prugniel, & H. P. Singh, 107 [Google Scholar]
- Dabringhausen, J., Hilker, M., & Kroupa, P. 2008, MNRAS, 386, 864 [NASA ADS] [CrossRef] [Google Scholar]
- Dalessandro, E., Massari, D., Bellazzini, M., et al. 2014, ApJ, 791, L4 [NASA ADS] [CrossRef] [Google Scholar]
- de Marchi, G.,& Paresce, F. 1996, ApJ, 467, 658 [NASA ADS] [CrossRef] [Google Scholar]
- Djorgovski, S.,& King, I. R. 1986, ApJ, 305, L61 [NASA ADS] [CrossRef] [Google Scholar]
- Gratton, R., Carretta, E., Bragaglia, A., Lucatello, S., & D’Orazi, V. 2010, Messenger, 142, 28 [NASA ADS] [Google Scholar]
- Gratton, R. G., Carretta, E., & Bragaglia, A. 2012, A&ARv, 20, 50 [CrossRef] [Google Scholar]
- Gruyters, P., Casagrande, L., Milone, A. P., et al. 2017, A&A, 603, A37 [NASA ADS] [CrossRef] [EDP Sciences] [Google Scholar]
- Harris, W. E. 2010, ArXiv e-prints [arXiv:1012.3224] [Google Scholar]
- Hess, R. 1924, Probleme der Astronomie, 265 [CrossRef] [Google Scholar]
- Khalisi, E., Amaro-Seoane, P., & Spurzem, R. 2007, MNRAS, 374, 703 [NASA ADS] [CrossRef] [Google Scholar]
- King, I. 1962, AJ, 67, 471 [NASA ADS] [CrossRef] [Google Scholar]
- Kirsten, F., Vlemmings, W., Freire, P., et al. 2014, A&A, 565, A43 [NASA ADS] [CrossRef] [EDP Sciences] [Google Scholar]
- Kustner, F. 1921, Veroeffentlichungen Astron. Inst. Univ. Bonn, 15, 47 [Google Scholar]
- Lardo, C., Bellazzini, M., Pancino, E., et al. 2011, A&A, 525, A114 [NASA ADS] [CrossRef] [EDP Sciences] [Google Scholar]
- Larsen, S. S., Baumgardt, H., Bastian, N., et al. 2015, ApJ, 804, 71 [NASA ADS] [CrossRef] [Google Scholar]
- Logroño-García, R., Vilella-Rojo, G., López-Sanjuan, C., & J-PLUS collaboration 2019, A&A, 622, A180 [NASA ADS] [CrossRef] [EDP Sciences] [Google Scholar]
- López-Sanjuan, C., Vázquez-Ramió, H., Varela, J., & J-PLUS collaboration 2019, A&A, 622, A177 [NASA ADS] [CrossRef] [EDP Sciences] [Google Scholar]
- McLaughlin, D. E. & Fall, S. M. 2008, ApJ, 679, 1272 [NASA ADS] [CrossRef] [Google Scholar]
- Milone, A. P., Stetson, P. B., Piotto, G., et al. 2009, A&A, 503, 755 [NASA ADS] [CrossRef] [EDP Sciences] [Google Scholar]
- Milone, A. P., Marino, A. F., Piotto, G., et al. 2013, ApJ, 767, 120 [NASA ADS] [CrossRef] [Google Scholar]
- Milone, A. P., Marino, A. F., Bedin, L. R., et al. 2014, MNRAS, 439, 1588 [NASA ADS] [CrossRef] [Google Scholar]
- Milone, A. P., Marino, A. F., D’Antona, F., et al. 2017, MNRAS, 465, 4363 [NASA ADS] [CrossRef] [Google Scholar]
- Miocchi, P., Lanzoni, B., Ferraro, F. R., et al. 2013, ApJ, 774, 151 [NASA ADS] [CrossRef] [Google Scholar]
- Molino, A., Costa-Duarte, M. V., Mendes de Oliveira, C., & J-PLUS collaboration 2019, A&A, 622, A178 [NASA ADS] [CrossRef] [EDP Sciences] [Google Scholar]
- Nardiello, D., Milone, A. P., Piotto, G., et al. 2015, A&A, 573, A70 [NASA ADS] [CrossRef] [EDP Sciences] [Google Scholar]
- Noyola, E., & Gebhardt, K. 2007, AJ, 134, 912 [NASA ADS] [CrossRef] [Google Scholar]
- Pancino, E., Rejkuba, M., Zoccali, M., & Carrera, R. 2010, A&A, 524, A44 [NASA ADS] [CrossRef] [EDP Sciences] [Google Scholar]
- Pease, F. G. 1928, PASP, 40, 342 [NASA ADS] [CrossRef] [Google Scholar]
- Piotto, G., Bedin, L. R., Anderson, J., et al. 2007, ApJ, 661, L53 [NASA ADS] [CrossRef] [Google Scholar]
- Piotto, G., Milone, A. P., Bedin, L. R., et al. 2015, AJ, 149, 91 [NASA ADS] [CrossRef] [Google Scholar]
- San Roman, I., Sánchez-Blázquez, P., Cenarro, A. J., & J-PLUS collaboration 2019, A&A, 622, A181 [NASA ADS] [CrossRef] [EDP Sciences] [Google Scholar]
- Sarajedini, A., Bedin, L. R., Chaboyer, B., et al. 2007, AJ, 133, 1658 [NASA ADS] [CrossRef] [Google Scholar]
- Stetson, P. B. 1987, PASP, 99, 191 [NASA ADS] [CrossRef] [Google Scholar]
- Wilson, C. P. 1975, AJ, 80, 175 [NASA ADS] [CrossRef] [Google Scholar]
J-PLUS website: http://www.j-plus.es/
J-PAS website: http://www.j-pas.org/
Already be made public at early-data release at the J-PLUS web portal: http://j-plus.es/datareleases/early_data_release
The Southern Photometric Local Universe Survey (S-PLUS) is a joint scientific effort of Brazilian, Chilean and Spanish institutions to map ~8000 deg 2 of the southern sky with the same filters as J-PLUS, expected to have a 3–4 year duration. S-PLUS will cover an additional ~ 1200 deg 2 of the Galactic plane and the Bulge. S-PLUS is a Brazilian-led project funded by Brazil with important financial support from the Universidad de La Serena in Chile (1 FTE) and practical support from CEFCA (Spain).
All Tables
All Figures
 |
Fig. 1. Composite three-colour image of M 15 built with the J-PLUS filters J0515, J0660 and J0861; the tidal radius (rtidal ~21.5′) is fully encompassed by the observation, which shows the complete FoV of the instrument. Inset: magnification of the brightest part of M 15 (R ~5′). |
| In the text | |
 |
Fig. 2. Top panels: Photometric error as a function of the measured magnitude. Bottom panels: Average photometric error as a function of the distance to M 15 centre. Filters are indicated in panels. |
| In the text | |
 |
Fig. 3. Composite stellar radial density profile of M 15. HST data has been used for the region where J-PLUS suffers severe incompleteness (R ≤3′). Core and tidal radii derived from fitting the 3-par King profile are indicated. Inset: RDPs for main-sequence (solid line) and giant (dot-dashed) stars. |
| In the text | |
 |
Fig. 4. Spatial distribution of the colour (u – z) across the inner 5′ of M 15. A redder colour near the centre is consistent with the relative central concentration of RGB and AGB stars. Stars distributed along the blue and red sequences in Fig. 8 are shown as blue triangles and black squares, respectively. Vertical bar shows the colour scale. |
| In the text | |
 |
Fig. 5. Surface brightness profiles for the narrow (top panel) and broad-band (bottom panel) filters. |
| In the text | |
 |
Fig. 6. Field-star decontamination illustration in different colours. Left panels: Hess diagram of the underlying field stars is compared to the CMDs extracted in the inner 5′ of M 15 (small black points). Right panels: Hess diagrams built with the decontaminated photometry. |
| In the text | |
 |
Fig. 7. (u – z) vs. (J0378 – g) colour–colour diagram for the stars located within 5′ from the centre of M 15. Stars in each sequence correspond to M15 (black points) and field (brown). Their locations in the corresponding CMD are shown in the inset. |
| In the text | |
 |
Fig. 8. Top panels: CMDs that best show evidence of more than one population, extracted from the central 5′ of the cluster. Fiducial lines for the apparent sequence split in the upper RGB are shown, together with the average error bars computed in bins 0.5 mag wide. Stars of the blue and red sequences are overplotted on the Hess diagram. Bottom panels: same as above for combinations of filters that are not much sensitive to light element abundance variations. |
| In the text | |
 |
Fig. 9. Left panel: portion of the CMD to be rectified along the guiding (continuous) line (GL); the position of the individual sectors along the GL is marked (circles). Right panel: rectified stripe ( ≈ 1 mag wide) of the RGB/AGB overplotted with the stellar density profiles (dotted lines) extracted from sectors perpendicular to the GL; distance along the GL is marked on the right axis; profiles are normalized to their peak value for visualization purposes. |
| In the text | |
 |
Fig. 10. CMDs extracted from different regions to show that the RGB split extends up to ~ 4′ from the cluster centre. |
| In the text | |
 |
Fig. 11. Top panel: average J-PLUS SEDs for the stars in the blue and red sequence splits. Normalized at g for comparison purposes. Bottom panel: synthetic spectra by Coelho et al. (2011) and Coelho (2014) representing a RGB of a primordial sub-population in black (Teff = 4500 K, log g = 1.5, [Fe/H] = −2.3 dex, [α∕Fe] = 0.4 dex, Y = 0.256), and a slightly cooler giant representing a secondary population in red (Teff = 4250 K, log g = 1.5, [Fe/H] = −2.3 dex, [α∕Fe ] = 0.4 dex, [C∕Fe ] = −0.30 dex, [N∕Fe ] = +1.20 dex, [O∕Fe ] = −0.45 dex, [Na∕Fe ] = +0.60 dex, Y = 0.300). J-PLUS filters used in Fig. 8 are highlighted. |
| In the text | |
Current usage metrics show cumulative count of Article Views (full-text article views including HTML views, PDF and ePub downloads, according to the available data) and Abstracts Views on Vision4Press platform.
Data correspond to usage on the plateform after 2015. The current usage metrics is available 48-96 hours after online publication and is updated daily on week days.
Initial download of the metrics may take a while.


![$\sigma(R)=\sigma_{bg} + \sigma_0 [\frac{1}{\sqrt{1+(R/r_{\textrm{core}})^2}} - \frac{1}{\sqrt{1+(r_{\textrm{tidal}}/r_{\textrm{core}})^2)}}]^2$](/articles/aa/full_html/2019/02/aa32441-17/aa32441-17-eq2.png)