Fig. 9.
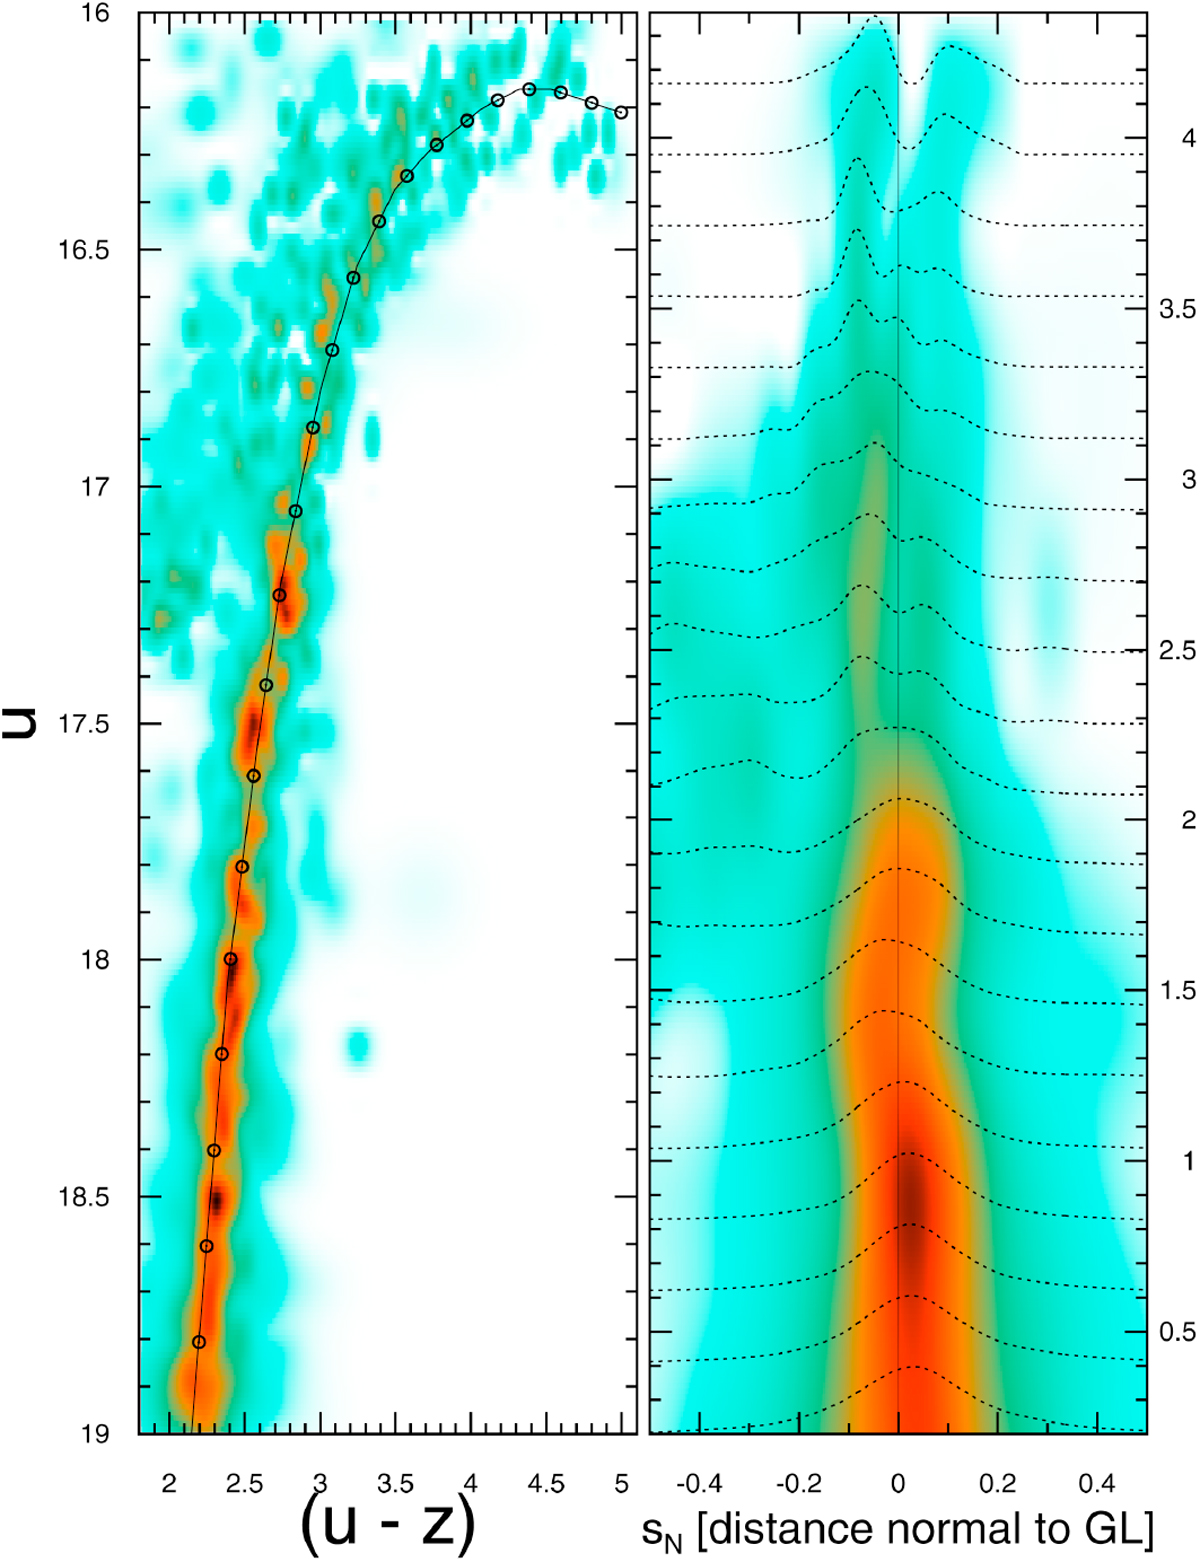
Left panel: portion of the CMD to be rectified along the guiding (continuous) line (GL); the position of the individual sectors along the GL is marked (circles). Right panel: rectified stripe ( ≈ 1 mag wide) of the RGB/AGB overplotted with the stellar density profiles (dotted lines) extracted from sectors perpendicular to the GL; distance along the GL is marked on the right axis; profiles are normalized to their peak value for visualization purposes.
Current usage metrics show cumulative count of Article Views (full-text article views including HTML views, PDF and ePub downloads, according to the available data) and Abstracts Views on Vision4Press platform.
Data correspond to usage on the plateform after 2015. The current usage metrics is available 48-96 hours after online publication and is updated daily on week days.
Initial download of the metrics may take a while.