| Issue |
A&A
Volume 662, June 2022
|
|
|---|---|---|
| Article Number | A117 | |
| Number of page(s) | 9 | |
| Section | Galactic structure, stellar clusters and populations | |
| DOI | https://doi.org/10.1051/0004-6361/202243843 | |
| Published online | 28 June 2022 | |
Confirmation of a metallicity spread amongst first population stars in globular clusters
1
Dipartimento di Fisica e Astronomia, Universitá degli Studi di Bologna, Via Gobetti 93/2, 40129 Bologna, Italy
e-mail: This email address is being protected from spambots. You need JavaScript enabled to view it.
2
Astrophysics Research Institute, Liverpool John Moores University, 146 Brownlow Hill, Liverpool L3 5RF, UK
3
INAF – Osservatorio Astronomico di Abruzzo, Via M. Maggini, 64100 Teramo, Italy
4
INFN – Sezione di Pisa, Largo Pontecorvo 3, 56127 Pisa, Italy
5
Donostia International Physics Center (DIPC), Paseo Manuel de Lardizabal, 4, 20018 Donostia-San Sebastián, Guipuzkoa, Spain
6
IKERBASQUE, Basque Foundation for Science, 48013 Bilbao, Spain
Received:
22
April
2022
Accepted:
6
May
2022
Abstract
Stars in massive star clusters exhibit intrinsic variations in some light elements (the multiple populations phenomenon) that are difficult to explain in a fully coherent formation scenario. In recent years, high quality Hubble Space Telescope (HST) photometry has led to the characterisation of the global properties of these multiple populations in an unparalleled level of detail. In particular, the colour-(pseudo)colour diagrams known as ‘chromosome maps’ have been proven to be very efficient at separating cluster stars with a field-like metal abundance distribution (first population) from an object with distinctive light-element abundance anti-correlations (second population). The unexpected wide colour ranges covered by the first population group – traditionally considered to have a uniform chemical composition – in the chromosome maps of the majority of the investigated Galactic globular clusters have recently been attributed to intrinsic metallicity variations up to ∼0.30 dex from the study of subgiant branch stars in two metal-rich Galactic globular clusters by employing appropriate HST filter combinations. On the other hand, high-resolution spectroscopy of small samples of first populations stars in the globular clusters NGC 3201 and NGC 2808 – both displaying extended sequences of first population stars in their chromosome maps – have provided conflicting results thus far, with a spread of metal abundance detected in NGC 3201 but not in NGC 2808. We present here a new method that employs HST near-UV and optical photometry of red giant branch stars to confirm these recent results independently. Our approach was firstly validated using observational data for M 2, a globular cluster hosting a small group of first population stars with an enhanced (by ≃0.5 dex) metallicity with respect to the main component. We then applied our method to three clusters that cover a much larger metallicity range and that have well populated, extended first population sequences in their chromosome maps, namely M 92, NGC 2808, and NGC 6362. We confirm that metallicity spreads are present among first population stars in these clusters, thus solidifying the case for the existence of unexpected variations up to a factor of two of metal abundances in most globular clusters. We also confirm the complex behaviour of the mean metallicity (and metallicity range) differences between first and second population stars.
Key words: stars: abundances / globular clusters: general / stars: Population III / stars: imaging
© C. Lardo et al. 2022
 Open Access article, published by EDP Sciences, under the terms of the Creative Commons Attribution License (https://creativecommons.org/licenses/by/4.0), which permits unrestricted use, distribution, and reproduction in any medium, provided the original work is properly cited.
This article is published in open access under the Subscribe-to-Open model. This email address is being protected from spambots. You need JavaScript enabled to view it. to support open access publication.
1. Introduction
It has now been well established that Galactic globular clusters (GCs) host multiple populations (MPs) of stars, which is at odds with the traditional paradigm of star clusters harbouring objects all with the same age and uniform initial chemical composition. A large number of spectroscopic observations have in fact shown that individual GCs are characterised by anti-correlated star-to-star variations among C, N, O, Na (in some cases also Mg and Al), and He (see, e.g., Gratton et al. 2012, 2019; Bastian & Lardo 2018; Cassisi & Salaris 2020, for reviews), while their colour magnitude diagrams (CMDs) confirm negligible age spreads despite the chemical inhomogeneity.
The more popular scenarios for the formation of MPs invoke subsequent episodes of star formation (see, e.g., D’Ercole et al. 2008; Decressin et al. 2008; Renzini et al. 2022) whereby stars with CNONa (and He) abundance patterns similar to those observed in the field are the first stars to form (we denote them as P1), while stars showing a range of N and Na (and He) enrichment and C and O depletion (we denote them as P2) were formed several 106 up to ∼108 years later. The time at which this happened depended on the adopted scenario and was due to chemically processed material being ejected by some class of more massive objects born in the first epoch of star formation. All of the proposed scenarios however have difficulties in quantitatively matching the observed abundance patterns, and no consensus has thus far been reached on the mechanism responsible for the formation of MPs in a cluster (see, e.g., Bastian 2015; Renzini et al. 2015; Bastian & Lardo 2018).
Complementary to high-resolution spectroscopy, photometry has been crucial to enlarge the sample of clusters investigated for the presence of MPs, the sample of stars surveyed in each cluster, and the range of evolutionary phases (including the main sequence, which is generally too faint to be investigated spectroscopically in GCs) where chemical abundance variations have been detected (see, e.g., Monelli et al. 2013; Piotto et al. 2015; Milone et al. 2017; Niederhofer et al. 2017; Dondoglio et al. 2022). Photometry has also been instrumental for the discovery and characterisation of MPs in massive extragalactic old- and intermediate-age clusters (see, e.g., Larsen et al. 2014; Dalessandro et al. 2016; Gilligan et al. 2019; Hollyhead et al. 2019; Lagioia et al. 2019a,b; Martocchia et al. 2019; Nardiello et al. 2019; Saracino et al. 2019, 2020; Cadelano et al. 2022, and references therein), demonstrating that the MP phenomenon is not restricted to the Milky Way’s oldest massive clusters.
The ability of photometry to detect MPs rests on the fact that abundance variations in the elements involved in the anti-correlations affect stellar effective temperatures, luminosities, and spectral energy distributions (see, e.g., Salaris et al. 2006, 2019; Marino et al. 2008; Yong et al. 2008; Sbordone et al. 2011; Cassisi et al. 2013; Dalessandro et al. 2016, 2018; Mucciarelli et al. 2016; Milone et al. 2017). For example, filters covering wavelengths shorter than ≲4500 Å can be especially sensitive to star-to-star differences in C, N, and O abundances.
Taking advantage of photometry in the Hubble Space Telescope (HST) Wide Field Camera 3 filters F275W, F336W, and F438W from the UV legacy survey of Galactic GCs (see, e.g., Piotto et al. 2015), and data in the F814W filter from the Wide Field Channel of the HST Advanced Camera for Survey (Sarajedini et al. 2007), Milone et al. (2015b, 2017) have introduced the pseudo two-colour diagram ΔF275W, F814W-ΔC F275W, F336W, F438W named the ‘chromosome map’. In this diagram, different populations can be easily identified, especially when considering red giant branch (RGB) stars. The RGB stars belonging to the P1 population of a cluster are expected to be generally distributed around the origin of the chromosome map coordinates (ΔF275W, F814W ∼ 0, ΔC F275W, F336W, F438W ∼ 0), covering a narrow range of ΔF275W, F814W and ΔC F275W, F336W, F438W values, whilst P2 stars (with a range of abundances of C, N, O, Na, and He) span a wide range of both coordinates (Milone et al. 2015b, 2017; Carretta et al. 2018).
On the other hand, as reported by Milone et al. (2017), the large majority of their sample of 57 Galactic GCs display ΔF275W, F814W values (and ΔC F275W, F336W, F438W to a much lesser extent) for P1 stars that cover a range much larger than what is expected from photometric errors only. Unresolved binaries do certainly contribute to produce an extended P1 sequence in ΔF275W, F814W, but their fraction in GCs is too small to fully explain the phenomenon, as shown by Marino et al. (2019b) and Martins et al. (2020) – see also the discussion in Kamann et al. (2020).
The reason for these extended P1 sequences therefore must be some unexpected level of chemical non-uniformity, which does not alter the relative abundances of the metals. Identifying the cause for this inhomogeneity therefore has a major impact on our understanding of the mechanism of formation of globular clusters.
In the assumption that P1 stars in a cluster have a uniform metal content, Milone et al. (2015b), Milone et al. (2018), and Lardo et al. (2018) have shown that variations in the initial abundance of He can explain the extended sequences because of their effect on the stellar effective temperatures: An increased initial He abundance produces hotter, and hence bluer RGB stars at a given luminosity, and lower ΔF275W, F814W values in the chromosome maps. The analysis of the GC chromosome maps by Marino et al. (2019a) allowed them to conclude more generally that the extended P1 sequences can be due either to a range of initial helium abundances or to a range of metallicity (of about 0.1 dex), with the more metal-poor component populating the lower ΔF275W, F814W values (hotter and bluer RGB stars).
The assumption of uniform metallicity was corroborated by the spectroscopy of six RGB stars distributed along the extended P1 of the GC NGC 2808 by Cabrera-Ziri et al. (2019), which did not reveal any significant spread in metallicity. Also Latour et al. (2019) did not find any metallicity variation among P1 stars in NGC 2808 by employing MUSE spectra for 1115 RGB stars distributed along the various sequences of the cluster chromosome map. On the other hand, the spectroscopic study by Marino et al. (2019b) of 18 RGB stars belonging to the extended P1 of NGC 3201 has disclosed a [Fe/H] range (hence a range of total metallicity if the abundance ratios among the more abundant metals are uniform, as is typically measured in P1 stars), which is of the order of 0.1–0.15 dex.
Very recently, Legnardi et al. (2022) have studied, in detail, two metal-rich GCs with extended P1, namely NGC 6362 and NGC 6838 ([Fe/H] ∼ −1.10 and ≃0.8, respectively), devising appropriate combinations of magnitudes in the F275W, F336W, F438W, and F814W filters for the clusters’ P1 subgiant branch stars, so as to disentangle the effect of metallicity and helium variations. By comparisons with theoretical subgiant branch isochrones, they found that a range of metallicity and not Y is present among P1 stars in these two clusters and, by extrapolation, in all other GCs with extended P1 in their chromosome maps. By employing the width of the P1 sequences in the (F275W − F814W) colour at a reference F814W magnitude determined by Milone et al. (2017) for 55 GCs, Legnardi et al. (2022) estimated, from theoretical isochrones, the presence of metallicity ranges – denoted in terms of [Fe/H] ranges – ranging from a few 0.01 dex up to much higher values of 0.15–0.30 dex for metal-poor GCs, which is at odds with inferences from spectroscopic analyses, pointing to uniform [Fe/H] abundances in the majority of Galactic GCs (see, e.g., Carretta et al. 2009). This result therefore has major implications not only for the models of massive clusters’ formation, but also for the spectroscopic investigations of chemical abundances in GCs.
For this reason, we believe that a further investigation of the origin of the extended P1 sequences is warranted, so as to corroborate the results by Legnardi et al. (2022) independently. For this purpose, we present an alternative method here to assess whether a metallicity or helium spread is the cause of the extended P1 in Galactic GCs. It makes use of information from photometry similar to the Legnardi et al. (2022) study; however, instead of subgiants, it uses the same RGB stars along the extended P1 sequence of the chromosome maps to disentangle the effect of metallicity and Y. Here we also show our results for the GCs NGC 6341 (M 92), NGC 2808, and NGC 6362 (one of the two clusters investigated by Legnardi et al. 2022, with their method to disentangle the effect of metallicity and helium); they cover a large metallicity range between ≃2.15 and ≃1.10.
Section 2 introduces the method based on the properties of theoretical isochrones tested empirically on the GC M 2, and Sect. 3 presents an application to our sample of three clusters. Section 4 closes the paper by discussing the results.
2. RGB stars in the F814W-(F275W–F814W) colour magnitude diagram
The photometric identification of P1 RGB stars takes advantage of the chromosome maps described by Milone et al. (2017), which make use of the combination of a F814W-(F275W − F814W) CMD and a F814W-CF275W, F336W, F438W diagram, where the pseudocolour CF275W, F336W, F438W is defined as CF275W, F336W, F438W = (F275W − F336W)−(F336W − F438W). They were produced as follows: First, red and blue fiducial lines in each of these two diagrams were calculated by determining the values of the 4th and the 96th percentile of the (F275W − F814W) and CF275W, F336W, F438W distributions in various magnitude bins across the RGB, as shown in the left and middle panel of Fig. 1 for the cluster NGC 2808 (the photometry for this cluster and all other clusters discussed in this paper is from Nardiello et al. 2018). In these diagrams P2 stars are distributed between the red and blue fiducials, whilst the supposedly chemically homogeneous P1 stars are expected to lie around the red fiducials. As a second step, the width of the RGB in the (F275W − F814W) colour (denoted here as WF275W, F814W) and in the CF275W, F33W, F438W pseudocolour (denoted as WC F275W, F336W, F438W) was calculated at a reference luminosity, set to two F814W magnitudes above the cluster turnoff, taking the colour and pseudocolour differences between the red and blue fiducial. Finally, for each RGB star, the differences in (F275W − F814W) and CF275W, F336W, F438W with respect to the red fiducials taken at the star F814W magnitude were calculated, and they were normalised to the values of WF275W, F814W and WC F275W, F336W, F438W. These quantities are denoted as ΔF275W, F814W and ΔC F275W, F336W, F438W, respectively, and are defined as follows:
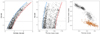 |
Fig. 1. Chromosome map of RGB stars in NGC 2808. The left and middle panel display the F814W-(F275W − F814W) CMD and the F814W-CF275W, F336W, F438W diagram, respectively, with the corresponding red and blue fiducial lines being overimposed (see text for details). The right panel displays the resulting chromosome map. P1 stars are displayed as orange open circles, and P2 stars are shown as black crosses. |
 (1)
(1)
 (2)
(2)
where X=(F275W − F814W), Y=CF275W, F336W, F438W, and R and B denote the red and blue fiducial line, respectively. The chromosome map is the plot of the stars’ position in a ΔC F275W, F336W, F438W versus ΔF275W, F814W diagram, shown in the right panel of Fig. 1 for the GC NGC 2808.
Following the definitions of these two quantities, the values ΔF275W, F814W = 0 and ΔC F275W, F336W, F438W = 0 correspond to objects lying on the red fiducial lines. Whereas, Δ values different from zero denote colour and pseudocolour distances (defined as positive for CF275W, F336W, F438W and negative for (F275W − F814W)) from such lines.
The P2 stars typically follow a sequence extending from the origin of both coordinates towards increasing ΔC F275W, F336W, F438W and decreasing ΔF275W, F814W, as shown in Fig. 1, whilst P1 stars should be clustered around the origin because of their expected chemical homogeneity, with a small spread being simply due to photometric errors (see, e.g., Milone et al. 2017; Cassisi & Salaris 2020, for more details). However, as already mentioned, a large number of GCs display extended P1 sequences in the chromosome map of their RGB stars, such as the case of NGC 2808 shown in Fig. 1, where the sequence of P1 stars is clearly elongated mainly along the ΔF275W, F814W axis (see, e.g., Milone et al. 2017; Cassisi & Salaris 2020, for more details about the identification of this elongated sequence with P1 stars). This means that P1 objects describe multiple RGB sequences between the red and blue fiducials in the F814W-(F275W − F814W) CMD. In the chromosome maps, these multiple RGB sequences are essentially compressed along one segment because of the way the maps were calculated. In the following, we show how we can employ the F814W-(F275W − F814W) CMD of P1 stars to help discriminate between inhomogeneities in He and metallicity as the origin of the extended P1 phenomenon.
Figure 2 displays the F814W-(F275W − F814W) CMD of two α-enhanced 12 Gyr isochrones with [Fe/H] = −1.3 and −1.6, respectively, from Pietrinferni et al. (2006). The relative abundance distribution of the metals is typical of P1 stars and is the same for the two isochrones; it is just the total metallicity (hence [Fe/H]) that varies. Due to the shape of the RGBs in this CMD, the colour difference at fixed magnitude between the two isochrones increases with decreasing F814W. This is more clearly seen in the lower panel of the figure, where we display the more metal-rich RGB as a reference straight line at (F275W − F814W) = 0 and, on the horizontal axis, plot the colour differences Δ(F275W − F814W) between the metal-poorer RGB and this reference line at varying F814W in the range between about 2 and 4 magnitudes above the main sequence turnoff, which is approximately the magnitude range considered in the analysis presented in the next section.
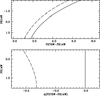 |
Fig. 2. Upper panel:F814W-(F275W − F814W) CMD of two RGBs belonging to 12 Gyr old isochrones with [Fe/H] = −1.6 (dashed line) and −1.3 (solid line), respectively. Lower panel: difference of the (F275W − F814W) colour at varying F814W between the [Fe/H] = −1.6 (dashed line) and the ‘verticalised’ metal-richer RGBs (solid line), taken as a reference (see text for details). |
The colour separation Δ(F275W − F814W) increases when moving to brighter magnitudes, while the effect of a spread of initial helium abundance (at fixed metallicity) is different, as shown by Fig. 3. Here we display the RGB of the [Fe/H]=−1.3 isochrone of the previous figure, together with an isochrone for the same metallicity and age, but calculated with the helium mass fraction Y increased by 0.05. In this case, the colour separation Δ(F275W − F814W) between the two RGBs tends to decrease when moving to brighter magnitudes, which is the opposite behaviour compared to the case of metallicity variations.
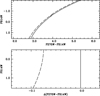 |
Fig. 3. As Fig. 2, but the dashed line represents a 12 Gyr old isochrone with [Fe/H] = −1.3 and the helium mass fraction Y increased by 0.05. |
In addition to these predictions from theory, the GC M 2 gives us the opportunity to verify the behaviour of RGBs empirically with a different metallicity predicted by the models. This cluster has been found to host stars characterised by large iron variations, with three main metallicity groups at [Fe/H] = −1.7, −1.5, and −1.0, respectively (Yong et al. 2014). While the presence of an intrinsic metallicity spread between the two metal-poorer groups (we denote these groups as the main cluster component) is still controversial (Lardo et al. 2016), several independent studies have confirmed the existence of a small component (accounting for ∼1% of the cluster mass) with [Fe/H] = −1 (Yong et al. 2014; Milone et al. 2015a; Lardo et al. 2016). Such metal-rich stars do not exhibit star-to-star variations in light elements or s-process enhancement (e.g., they have a P1-like chemical composition; Yong et al. 2014). They are located on a well-defined, narrow red sequence which runs parallel to the main RGB body and that can be followed down to the SGB and main sequence, supporting the case for cluster membership (Milone et al. 2015a).
The top panel of Fig. 4 displays the chromosome map of the cluster, including the metal-rich P1 component – which comprises a very small fraction of the cluster population, and therefore lies to the red of the red fiducials in the diagrams used to calculated the chromosome map – located at values ΔF275W, F814W larger than 0.5. The F814W-(F275W − F814W) CMD used to determine the chromosome map is shown in the middle panel of the same figure, whilst the bottom panel displays the colour differences Δ(F275W − F814W) between stars belonging to the P1 of the main component and the verticalised cubic fit to the position of the metal-rich P1 stars in the F814W-(F275W − F814W) CMD, as a function of F814W. We can see clearly that the Δ(F275W − F814W) values increase with increasing brightness along the RGB, as predicted by theory. As a conclusion, the opposite trends of the colour differences Δ(F275W − F814W) with F814W for the case of RGBs, with different metallicity or different initial helium, provides us with a diagnostic that can be applied to the GCs with extended P1.
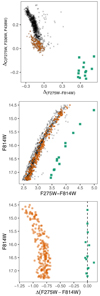 |
Fig. 4. Top panel: chromosome map of M 2. The P1 and P2 stars in the main cluster component are displayed as large orange circles and black crosses, respectively, while the P1 metal-rich component is shown as green squares. Middle panel:F814W-(F275W − F814W) CMD of the three groups of stars shown in the chromosome map. Bottom panel: similar to the right panel of Fig. 2, but the orange circles display the difference of the (F275W − F814W) colour between the P1 stars of the main cluster component, and the ‘verticalised’ fit to the CMD of the metal-rich component is considered as a reference (dashed line). The individual metal-rich P1 stars are also plotted around the verticalised fit. |
To assess how this diagnostic performs in the case of populations with a continuous distribution of helium or metal abundances, we performed a few numerical experiments. Figure 5 shows the equivalent of Figs. 2 and 3, but for the F814W-(F275W − F814W) CMDs of three pairs of synthetic samples with 200 RGB stars each, calculated from 12 Gyr α-enhanced isochrones (Pietrinferni et al. 2006). This number of stars is a typical average value for the clusters in the Milone et al. (2017) sample, which we use for the analysis described below.
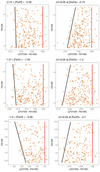 |
Fig. 5. As Fig. 2, but for synthetic samples of P1 stars (200 objects) including a 0.15 dex uniform spread of metallicity (left panels), or a uniform spread ΔY = 0.05 (right panels). The top row displays the results for populations with [Fe/H] distributed between −2.15 and −2.0 dex, and for a spread of helium at [Fe/H] = −2.15. The middle row shows the case for [Fe/H] between −1.6 and −1.45 dex, and for a spread of helium at [Fe/H] = −1.3. The bottom row displays the case for [Fe/H] between −0.85 and −1.0 dex, and for a range of helium at [Fe/H] = −0.7. In each panel the solid vertical lines at Δ(F275W − F814W) = 0 are the verticalised red fiducials of the F814W-(F275W − F814W) CMDs of the samples. The other line in each panel corresponds to the blue fiducial of the Δ(F275W − F814W) distribution as a function of F814W (see text for details). |
The left panels of each row display samples with a spread of metallicity (0.15 dex and uniform distribution), while the right panels are samples with a spread of Y (ΔY = 0.05 and uniform distribution)1. From top to bottom, the three rows display simulations in order of increasing metallicity regimes. Random Gaussian photometric errors with a 1σ dispersion typical of the cluster photometries used in the next section (average values of the order of ∼0.01 mag) are also included in these simulations.
The straight red lines located at Δ(F275W − F814W) = 0.0 are the verticalised red fiducials of the F814W-(F275W − F814W) CMDs of the samples. Each red fiducial corresponds to a fit to the 95th percentile (to account for potential outliers due to the photometric error) of the colour distribution as a function of F814W. In the simulations with a metallicity spread, the red fiducials represent the position in the CMD of the populations with the highest metallicity, whilst in the case of the simulations with a range of Y, the red fiducials denote the position of the objects with the lowest Y. The horizontal coordinate of each panel displays the colour difference Δ(F275W − F814W) between the individual synthetic stars and the corresponding red fiducial at the star F814W magnitude.
The various panels show that in the case of a metallicity spread the range of (F275W − F814W) colours spanned by the population increases with increasing F814W luminosity, and this trend steepens with increasing mean metallicity. This is evident when considering the second straight line displayed in each panel, which is the blue fiducial of the distribution of points in the diagram; it has been derived as a linear fit to the 5th percentile of the distribution of the colour differences as a function of F814W. In the metal-poor regime ([Fe/H] around −2), this line is almost vertical and the slope (always in the sense of increasing Δ(F275W − F814W) with increasing F814W luminosity) increases with increasing mean metallicity. Moreover, for a fixed spread of [Fe/H], the range of (F275W − F814W) colours increases with increasing mean metallicity. The opposite effect can be seen in the case of populations with a range of Y. The range of Δ(F275W − F814W) values decreases with increasing luminosity at all metallicities.
The exact value of the slope – not the sign – of the blue edge of the Δ(F275W − F814W) distribution as a function of F814W, and whether the value of the slope is significantly different from zero generally depends on the following: the size of the stellar sample; the photometric error, which in our simulations are set to the typical values of the GC sample we are going to consider in our analysis; the value of the mean metallicity; the metallicity (or Y) range of the RGB sample; and, very importantly, the probability distribution of the various metallicities (or Y values) within the adopted range.
In the case of the choice of parameters of Fig. 5, multiple realisations of the simulations show that in both scenarios we can always recover a slope that is significantly different from zero. We thus varied the probability distribution of metallicity and Y by performing the same simulations described before, but by assuming Gaussian distributions for both metallicity and Y. The mean values and 1σ spreads were chosen in order to cover, within ±3σ from the mean, the same total ranges of [Fe/H] and Y as in Fig. 5. Also in this case we formally derived slopes of the blue fiducials of the Δ(F275W − F814W) distribution as a function of F814W with a different sign in the case of metallicity or Y variations, but in many realisations they were often not significantly different from zero.
The implication of these numerical experiments is that it is possible to use the distribution of P1 RGB stars in the F814W-(F275W − F814W) CMDs to determine whether a range of metallicity or Y is present; however, with the available observational data, we can only find statistically significant results for certain distributions of metallicity (or Y) among the cluster P1 stars. This is similar to the situation with the method employed by Legnardi et al. (2022) based on the photometry of subgiants, which can be applied to clusters with P1 and P2 stars that are well separated along the subgiant branch.
3. The extended P1 of three Galactic globular clusters
Based on the results of the previous section, we investigate here the behaviour in the F814W-(F275W − F814W) CMD of RGB stars belonging to three GCs in the Milone et al. (2017) sample, with well-populated RGB photometry in the appropriate filters, and a well-extended P1 in their chromosome maps, namely NGC 6341 (M 92), NGC 2808, and NGC 6362 (see Milone et al. 2017), with spectroscopic [Fe/H] = −2.35, −1.18, and −1.07, respectively (Carretta et al. 2009)2. Unfortunately, in our analysis, we cannot employ the GC NGC 3201 – whose P1 RGB stars display a range of metallicities according to the spectroscopic analysis by Marino et al. (2019b) – because the available photometry does not have enough stars along the RGB to perform our analysis (see the previous section).
For each cluster, we first determined the chromosome map to identify their P1 stars. Given that we are interested in high-precision photometry of cluster members, we retained only stars with a membership probability > 95% for our analysis. Additionally, only stars with relatively small photometric uncertainties (< 0.05, 0.04, 0.03, 0.02, and 0.01 mag in F275W, F336W, F438W, F606W, and F814W, respectively) were selected to produce the chromosome maps.
Cluster members along the RGB were identified by performing a multi-variate analysis on the photometric data through a Gaussian mixture model (GMM) algorithm (Chaussé 2010). For each giant star in a given cluster photometry, we computed the colour (and colour-indices) from all possible combinations of the magnitudes available in the Nardiello et al. (2019) catalogues, including (F275W − F814W) and CF275W, F336W, F438W. Member stars were then selected using the constraint that similar objects (e.g., stars belonging to the cluster) lie on a well-defined RGB sequence in the multi-dimensional space defined by all the possible CMD combinations. In such a way, stars which are likely contaminants (field stars and/or binaries) are easily spotted by the algorithm because they are scattered around when using different colour (or colour index) combinations to create the CMD.
Once the cluster RGB stars were selected, we followed the procedure described in Sect. 2 to derive the chromosome maps shown in Fig. 6. The P1 stars were then identified according to their position in the chromosome map (following Milone et al. 2017) and they are plotted as orange circles in Fig. 6.
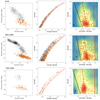 |
Fig. 6. From top to bottom, the three rows of panels refer to the clusters M 92, NGC 2808, and NGC 6362, respectively. In each row the left panel displays the cluster RGB chromosome map, with small black crosses denoting P2 stars, and orange circles representing the P1 population. The middle panel displays the corresponding F814W-(F275W − F814W) CMD, with a cubic polynomial fit to the red edge of the P1 sequence (red solid line – see text). The faint limit of the CMDs approximately corresponds to 1.5–2.0 mag above the turnoff. The right panel shows the difference of the (F275W − F814W) colour of P1 stars with respect the ‘verticalised’ fit shown in the middle panel (red line). The solid black line is a linear best fit to the 5th percentile of the colour differences as a function of F814W (see text for details), corresponding to the blue fiducial of the Δ(F275W − F814W) distribution as a function of F814W, while the dotted line denotes a comparison vertical sequence to emphasise the sign of the slope of the blue fiducial in this diagram (see text for details). The dashed black line is the best fit to the 50th percentile of the colour differences as a function of F814W. A colour-coded number density 2D map is also displayed. The average 1-σ (F275W − F814W) photometric error over the F814W covered in the figure is show in the bottom left corner of each panel. |
The left-hand panels of Fig 6 show, from top to bottom, the chromosome maps of M 92, NGC 2808, and NGC 6362, respectively. From a visual standpoint, they are very similar to the ones published by Milone et al. (2017). Also, the number ratios of P1 stars to the total number of RGB stars we obtained for these clusters are consistent with the values listed in Table 2 of Milone et al. (2017).
The middle panels of Fig. 6 show the position of the RGB stars of the chromosome maps in the F814W-(F275W − F814W) CMDs. The redder envelope of the P1 population in these CMDs was derived by fitting the 95th percentile (to account for potential outliers) of the colour distribution as a function of F814W with a third order polynomial. This red fiducial line is shown in red in the middle panels of the same figures, and it corresponds to the location of P1 stars with either the highest metallicity – if metallicity varies along the extended P1 sequence in the chromosome maps – or the lowest helium abundance, if helium changes along the P1 sequence.
The Δ(F275W − F814W) colour differences between the individual RGB stars and the fiducial lines in the middle panels are plotted in the right-hand panels of Fig. 6. The red solid lines denote the verticalised red fiducials described before, whilst the black solid lines are linear fits to the 5th percentile of the Δ(F275W − F814W) distribution as a function of F814W, and they represent the blue edge, or blue fiducial, of the distribution of Δ(F275W − F814W) values. We verified that for each cluster the sign of the slope of this blue fiducial does not change if we fit alternatively the 10th or even the 15th percentile of the colour distribution, to be more conservative regarding the presence of unresolved binaries and blue stragglers progeny (having already been largely filtered out by our procedure to determine the chromosome maps) which are predicted to be located mainly at the bluer end of the extended P1 sequence in the chromosome maps (see Martins et al. 2020; Marino et al. 2019b).
We find in all clusters that the range of Δ(F275W − F814W) values increase with increasing F814W brightness; this is a clear signature for the presence of a range of metal abundances among their P1 stars (see Fig. 5). Errors on the magnitudes show a decreasing trend with increasing luminosity, thus the photometric error does not contribute to the broadening of the RGB with luminosity. The lines denoting the median of the colour differences as a function of F814W, and the number density of points in these diagrams also show a general trend consistent with the sign of the slope of the blue fiducial in all three clusters. The absolute values of the slope of the blue fiducial in all three clusters are significantly different from zero at more than a 95% confidence level. A range of helium as the main driver of the observed range of (F275W − F814W) colours among P1 stars seems to be ruled out.
4. Summary and discussion
We have exploited HST near-UV and optical photometry of RGB stars in the Galactic GCs M 92, NGC 2808, and NGC 6362, so as to determine whether metal or helium abundance variations are the cause of the extended P1 sequences in their chromosome maps. The cluster NGC 6362 is in common with the Legnardi et al. (2022) study, and we find for this cluster and all others in our sample that a range in metal abundance does exist among their P1 stars. This confirms the results of Legnardi et al. (2022) based on the analysis of subgiant branch stars in NGC 6362 and NGC 6838, and solidifies the case for the existence of unexpected variations in metal abundances in most globular clusters.
A range of metallicity does not only explain the P1 extension in the (F275W − F814W) colour, but also the associated smaller range of the CF275W, F336W, F438W pseudocolour covered by P1 stars in the chromosome maps. This is shown in Fig. 7, which displays the F814W-(F275W − F814W) and the F814W-CF275W, F336W, F438W diagrams of a synthetic population with –1 < [Fe/H] < –0.85, similar to the one shown in Fig. 5.
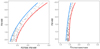 |
Fig. 7. From left to right:F814W-(F275W − F814W) and F814W-C(F275W, F336W, F438W) diagrams for a synthetic sample with −1 < [Fe/H] < −0.85) similar to the one shown in Fig. 5. The blue and red fiducial lines shown in each panel as solid lines (determined as described in Sect. 2) highlight the different widths of the RGB in the two diagrams. The width (in magnitudes) of the horizontal axis of the two figures is the same. |
Assuming that a metallicity spread, as found for NGC 6362 and NGC 6838, is the cause of the P1 extension in the chromosome maps of all clusters in the Milone et al. (2017) sample, Legnardi et al. (2022) determined the correspondent range of [Fe/H] – a proxy for a range of total metallicity in P1 stars – for the sample studied by Milone et al. (2017), comparing the width of the RGB (WF275W, F814W) taken two F814W magnitudes above the main sequence turnoff tabulated by Milone et al. (2017) with theoretical isochrones. They derived internal variations ranging from less than 0.05 to 0.30 dex, which mildly correlate with cluster mass and metallicity. Our study corroborates these conclusions by directly establishing the existence of a metallicity spread in a slightly larger sample of clusters distributed over a wider [Fe/H] range compared to the Legnardi et al. (2022) study, using an independent method.
Figure 6 also shows that the P2 distribution in the F814W-(F275W − F814W) CMDs of NGC 6362 appears clustered around the blue edge of the P1 distribution; whereas, for both M 92 and NGC 2808, the red edge of the P2 distribution is close to the red edge of the P1 one. Also, in the case of M 92, the width of the P2 sequence is comparable to the width of the P1 one, whilst it is larger in NGC 2808. This has implications on the metallicity distribution of P2 stars in these clusters if we consider the analysis by Lardo et al. (2018) (see also Milone et al. 2018) who have shown that at fixed metallicity the (F275W − F814W) colour of RGB P2 stars becomes bluer when the extension of the light element anti-correlations (mainly due to the decrease in oxygen) and Y increase.
The red edge of the P2 CMD corresponds to the P2 stars with the smaller values of the light element abundance anti-correlations and helium enhancement, hence its position with respect to the P1 colour distribution is likely a fair indicator of the metallicity out of which these P2 stars formed. In the case of NGC 6362, these P2 stars formed with the same [Fe/H] of the metal-poorer P1 population, while in the other clusters they formed with a [Fe/H] closer to the metal-richer P1 component. Also, given that at fixed [Fe/H] the (F275W − F814W) colour of RGB P2 stars increases with increasing Y and decreasing oxygen, a comparable or narrower width of the P2 sequence compared to the P1 counterpart suggests a smaller [Fe/H] range in the P2 cluster population. These conclusions echo those by Legnardi et al. (2022), based on the distribution of the P1 and P2 stars in the chromosome maps, and they highlight the emerging and ever increasing complexity of the chemical makeup of GCs.
The existence of a metallicity spread amongst P1 stars and a different distribution of the total metallicity in P1 and P2 populations might have implications for the determination of the relative He abundances, based on the comparison of theoretical and observed colours of P1 and P2 RGB stars (Milone et al. 2018), that need to be assessed. We also need to investigate the impact of both helium and total metallicity variations on the interpretation of the horizontal branch morphologies of individual clusters, using synthetic horizontal branch modelling (see, e.g., Dalessandro et al. 2013; Cassisi et al. 2014; Salaris et al. 2016; Tailo et al. 2019).
Finally, it is also important to further validate these results about metallicity spreads with dedicated high-resolution spectroscopic analyses. So far, as previously mentioned, spectroscopy of NGC 2808 P1 stars distributed along the extended sequence in the chromosome map has not disclosed any metallicity spread, and the spectroscopic analysis of a sizable sample of P1 RGB stars in NGC 6362 by Mucciarelli et al. (2016), for example, did not reveal any statistically significant spread. This lack of detection might be due to measurements not sufficiently precise compared to the range of metal abundances in these two clusters, which are equal to ∼0.1 dex and ∼0.05 dex for NGC 2808 and NGC 6362, respectively (see Legnardi et al. 2022). Moreover, in the case of NGC 6362, it is possible that P1 stars on the blue side of the chromosome map have not been sampled by the observations. In the case of M 92, Langer et al. (1998) found a spread of 0.18 dex (consistent with ∼0.15 dex estimated by Legnardi et al. 2022 for P1 stars) in iron peak elements among three bright red giants, but a recent analysis by Mészáros et al. (2020) does not find any significant metallicity spread in this cluster.
These ranges of metallicity and Y produce widths of the RGB in the F814W-(F275W − F814W) CMD that are consistent with the ranges measured by Milone et al. (2017).
The number of RGB stars in these clusters’ photometries range between ∼150 (for NGC6362) and ∼400 (for NGC 2808).
Acknowledgments
The authors would like to thank Ivan Cabrera-Ziri for useful comments and discussions. M. Salaris acknowledges support from The Science and Technology Facilities Council Consolidated Grant ST/V00087X/1. C. Lardo acknowledges funding from Ministero dell’Universitá e della Ricerca through the Programme Rita Levi Montalcini (grantPGR18YRML1). Isochrones and photometry used in this study are available at http://basti.oa-teramo.inaf.it/index.html and https://archive.stsci.edu/prepds/hugs/, respectively.
References
- Bastian, N. 2015, ArXiv e-prints [arXiv:1510.01330] [Google Scholar]
- Bastian, N., & Lardo, C. 2018, ARA&A, 56, 83 [Google Scholar]
- Cabrera-Ziri, I., Lardo, C., & Mucciarelli, A. 2019, MNRAS, 485, 4128 [NASA ADS] [CrossRef] [Google Scholar]
- Cadelano, M., Dalessandro, E., Salaris, M., et al. 2022, ApJ, 924, L2 [NASA ADS] [CrossRef] [Google Scholar]
- Carretta, E., Bragaglia, A., Gratton, R., D’Orazi, V., & Lucatello, S. 2009, A&A, 508, 695 [NASA ADS] [CrossRef] [EDP Sciences] [Google Scholar]
- Carretta, E., Bragaglia, A., Lucatello, S., et al. 2018, A&A, 615, A17 [NASA ADS] [CrossRef] [EDP Sciences] [Google Scholar]
- Cassisi, S., & Salaris, M. 2020, A&ARv, 28, 5 [Google Scholar]
- Cassisi, S., Mucciarelli, A., Pietrinferni, A., Salaris, M., & Ferguson, J. 2013, A&A, 554, A19 [EDP Sciences] [Google Scholar]
- Cassisi, S., Salaris, M., Pietrinferni, A., Vink, J. S., & Monelli, M. 2014, A&A, 571, A81 [NASA ADS] [CrossRef] [EDP Sciences] [Google Scholar]
- Chaussé, P. 2010, J. Stat. Software, 34, 1 [Google Scholar]
- Dalessandro, E., Salaris, M., Ferraro, F. R., Mucciarelli, A., & Cassisi, S. 2013, MNRAS, 430, 459 [NASA ADS] [CrossRef] [Google Scholar]
- Dalessandro, E., Lapenna, E., Mucciarelli, A., et al. 2016, ApJ, 829, 77 [NASA ADS] [CrossRef] [Google Scholar]
- Dalessandro, E., Lardo, C., Cadelano, M., et al. 2018, A&A, 618, A131 [NASA ADS] [CrossRef] [EDP Sciences] [Google Scholar]
- Decressin, T., Baumgardt, H., & Kroupa, P. 2008, A&A, 492, 101 [NASA ADS] [CrossRef] [EDP Sciences] [Google Scholar]
- D’Ercole, A., Vesperini, E., D’Antona, F., McMillan, S. L. W., & Recchi, S. 2008, MNRAS, 391, 825 [CrossRef] [Google Scholar]
- Dondoglio, E., Milone, A. P., Renzini, A., et al. 2022, ApJ, 927, 207 [NASA ADS] [CrossRef] [Google Scholar]
- Gilligan, C. K., Chaboyer, B., Cummings, J. D., et al. 2019, MNRAS, 486, 5581 [NASA ADS] [CrossRef] [Google Scholar]
- Gratton, R. G., Carretta, E., & Bragaglia, A. 2012, A&ARv, 20, 50 [CrossRef] [Google Scholar]
- Gratton, R., Bragaglia, A., Carretta, E., et al. 2019, A&ARv, 27, 8 [Google Scholar]
- Hollyhead, K., Martocchia, S., Lardo, C., et al. 2019, MNRAS, 484, 4718 [NASA ADS] [CrossRef] [Google Scholar]
- Kamann, S., Giesers, B., Bastian, N., et al. 2020, A&A, 635, A65 [Google Scholar]
- Lagioia, E. P., Milone, A. P., Marino, A. F., Cordoni, G., & Tailo, M. 2019a, AJ, 158, 202 [NASA ADS] [CrossRef] [Google Scholar]
- Lagioia, E. P., Milone, A. P., Marino, A. F., & Dotter, A. 2019b, ApJ, 871, 140 [NASA ADS] [CrossRef] [Google Scholar]
- Langer, G. E., Fischer, D., Sneden, C., & Bolte, M. 1998, AJ, 115, 685 [NASA ADS] [CrossRef] [Google Scholar]
- Lardo, C., Mucciarelli, A., & Bastian, N. 2016, MNRAS, 457, 51 [NASA ADS] [CrossRef] [Google Scholar]
- Lardo, C., Salaris, M., Bastian, N., et al. 2018, A&A, 616, A168 [NASA ADS] [CrossRef] [EDP Sciences] [Google Scholar]
- Larsen, S. S., Brodie, J. P., Grundahl, F., & Strader, J. 2014, ApJ, 797, 15 [NASA ADS] [CrossRef] [Google Scholar]
- Latour, M., Husser, T. O., Giesers, B., et al. 2019, A&A, 631, A14 [NASA ADS] [CrossRef] [EDP Sciences] [Google Scholar]
- Legnardi, M. V., Milone, A. P., Armillotta, L., et al. 2022, MNRAS, 513, 735 [NASA ADS] [CrossRef] [Google Scholar]
- Marino, A. F., Villanova, S., Piotto, G., et al. 2008, A&A, 490, 625 [NASA ADS] [CrossRef] [EDP Sciences] [Google Scholar]
- Marino, A. F., Milone, A. P., Sills, A., et al. 2019a, ApJ, 887, 91 [NASA ADS] [CrossRef] [Google Scholar]
- Marino, A. F., Milone, A. P., Renzini, A., et al. 2019b, MNRAS, 487, 3815 [CrossRef] [Google Scholar]
- Martins, F., Morin, J., Charbonnel, C., Lardo, C., & Chantereau, W. 2020, A&A, 635, A52 [NASA ADS] [CrossRef] [EDP Sciences] [Google Scholar]
- Martocchia, S., Dalessandro, E., Lardo, C., et al. 2019, MNRAS, 487, 5324 [Google Scholar]
- Mészáros, S., Masseron, T., García-Hernández, D. A., et al. 2020, MNRAS, 492, 1641 [Google Scholar]
- Milone, A. P., Marino, A. F., Piotto, G., et al. 2015a, ApJ, 808, 51 [NASA ADS] [CrossRef] [Google Scholar]
- Milone, A. P., Marino, A. F., Piotto, G., et al. 2015b, MNRAS, 447, 927 [NASA ADS] [CrossRef] [Google Scholar]
- Milone, A. P., Piotto, G., Renzini, A., et al. 2017, MNRAS, 464, 3636 [Google Scholar]
- Milone, A. P., Marino, A. F., Renzini, A., et al. 2018, MNRAS, 481, 5098 [NASA ADS] [CrossRef] [Google Scholar]
- Monelli, M., Milone, A. P., Stetson, P. B., et al. 2013, MNRAS, 431, 2126 [NASA ADS] [CrossRef] [Google Scholar]
- Mucciarelli, A., Dalessandro, E., Massari, D., et al. 2016, ApJ, 824, 73 [NASA ADS] [CrossRef] [Google Scholar]
- Nardiello, D., Libralato, M., Piotto, G., et al. 2018, MNRAS, 481, 3382 [NASA ADS] [CrossRef] [Google Scholar]
- Nardiello, D., Piotto, G., Milone, A. P., et al. 2019, MNRAS, 485, 3076 [NASA ADS] [CrossRef] [Google Scholar]
- Niederhofer, F., Bastian, N., Kozhurina-Platais, V., et al. 2017, MNRAS, 464, 94 [NASA ADS] [CrossRef] [Google Scholar]
- Pietrinferni, A., Cassisi, S., Salaris, M., & Castelli, F. 2006, ApJ, 642, 797 [Google Scholar]
- Piotto, G., Milone, A. P., Bedin, L. R., et al. 2015, AJ, 149, 91 [Google Scholar]
- Renzini, A., D’Antona, F., Cassisi, S., et al. 2015, MNRAS, 454, 4197 [Google Scholar]
- Renzini, A., Marino, A. F., & Milone, A. P. 2022, MNRAS, 513, 2111 [NASA ADS] [CrossRef] [Google Scholar]
- Salaris, M., Weiss, A., Ferguson, J. W., & Fusilier, D. J. 2006, ApJ, 645, 1131 [NASA ADS] [CrossRef] [Google Scholar]
- Salaris, M., Cassisi, S., & Pietrinferni, A. 2016, A&A, 590, A64 [CrossRef] [EDP Sciences] [Google Scholar]
- Salaris, M., Cassisi, S., Mucciarelli, A., & Nardiello, D. 2019, A&A, 629, A40 [NASA ADS] [CrossRef] [EDP Sciences] [Google Scholar]
- Saracino, S., Bastian, N., Kozhurina-Platais, V., et al. 2019, MNRAS, 489, L97 [NASA ADS] [CrossRef] [Google Scholar]
- Saracino, S., Martocchia, S., Bastian, N., et al. 2020, MNRAS, 493, 6060 [NASA ADS] [CrossRef] [Google Scholar]
- Sarajedini, A., Bedin, L. R., Chaboyer, B., et al. 2007, AJ, 133, 1658 [Google Scholar]
- Sbordone, L., Salaris, M., Weiss, A., & Cassisi, S. 2011, A&A, 534, A9 [CrossRef] [EDP Sciences] [Google Scholar]
- Tailo, M., D’Antona, F., Caloi, V., et al. 2019, MNRAS, 486, 5895 [NASA ADS] [CrossRef] [Google Scholar]
- Yong, D., Grundahl, F., Johnson, J. A., & Asplund, M. 2008, ApJ, 684, 1159 [NASA ADS] [CrossRef] [Google Scholar]
- Yong, D., Roederer, I. U., Grundahl, F., et al. 2014, MNRAS, 441, 3396 [NASA ADS] [CrossRef] [Google Scholar]
All Figures
|
Fig. 1. Chromosome map of RGB stars in NGC 2808. The left and middle panel display the F814W-(F275W − F814W) CMD and the F814W-CF275W, F336W, F438W diagram, respectively, with the corresponding red and blue fiducial lines being overimposed (see text for details). The right panel displays the resulting chromosome map. P1 stars are displayed as orange open circles, and P2 stars are shown as black crosses. |
| In the text | |
|
Fig. 2. Upper panel:F814W-(F275W − F814W) CMD of two RGBs belonging to 12 Gyr old isochrones with [Fe/H] = −1.6 (dashed line) and −1.3 (solid line), respectively. Lower panel: difference of the (F275W − F814W) colour at varying F814W between the [Fe/H] = −1.6 (dashed line) and the ‘verticalised’ metal-richer RGBs (solid line), taken as a reference (see text for details). |
| In the text | |
|
Fig. 3. As Fig. 2, but the dashed line represents a 12 Gyr old isochrone with [Fe/H] = −1.3 and the helium mass fraction Y increased by 0.05. |
| In the text | |
|
Fig. 4. Top panel: chromosome map of M 2. The P1 and P2 stars in the main cluster component are displayed as large orange circles and black crosses, respectively, while the P1 metal-rich component is shown as green squares. Middle panel:F814W-(F275W − F814W) CMD of the three groups of stars shown in the chromosome map. Bottom panel: similar to the right panel of Fig. 2, but the orange circles display the difference of the (F275W − F814W) colour between the P1 stars of the main cluster component, and the ‘verticalised’ fit to the CMD of the metal-rich component is considered as a reference (dashed line). The individual metal-rich P1 stars are also plotted around the verticalised fit. |
| In the text | |
|
Fig. 5. As Fig. 2, but for synthetic samples of P1 stars (200 objects) including a 0.15 dex uniform spread of metallicity (left panels), or a uniform spread ΔY = 0.05 (right panels). The top row displays the results for populations with [Fe/H] distributed between −2.15 and −2.0 dex, and for a spread of helium at [Fe/H] = −2.15. The middle row shows the case for [Fe/H] between −1.6 and −1.45 dex, and for a spread of helium at [Fe/H] = −1.3. The bottom row displays the case for [Fe/H] between −0.85 and −1.0 dex, and for a range of helium at [Fe/H] = −0.7. In each panel the solid vertical lines at Δ(F275W − F814W) = 0 are the verticalised red fiducials of the F814W-(F275W − F814W) CMDs of the samples. The other line in each panel corresponds to the blue fiducial of the Δ(F275W − F814W) distribution as a function of F814W (see text for details). |
| In the text | |
|
Fig. 6. From top to bottom, the three rows of panels refer to the clusters M 92, NGC 2808, and NGC 6362, respectively. In each row the left panel displays the cluster RGB chromosome map, with small black crosses denoting P2 stars, and orange circles representing the P1 population. The middle panel displays the corresponding F814W-(F275W − F814W) CMD, with a cubic polynomial fit to the red edge of the P1 sequence (red solid line – see text). The faint limit of the CMDs approximately corresponds to 1.5–2.0 mag above the turnoff. The right panel shows the difference of the (F275W − F814W) colour of P1 stars with respect the ‘verticalised’ fit shown in the middle panel (red line). The solid black line is a linear best fit to the 5th percentile of the colour differences as a function of F814W (see text for details), corresponding to the blue fiducial of the Δ(F275W − F814W) distribution as a function of F814W, while the dotted line denotes a comparison vertical sequence to emphasise the sign of the slope of the blue fiducial in this diagram (see text for details). The dashed black line is the best fit to the 50th percentile of the colour differences as a function of F814W. A colour-coded number density 2D map is also displayed. The average 1-σ (F275W − F814W) photometric error over the F814W covered in the figure is show in the bottom left corner of each panel. |
| In the text | |
|
Fig. 7. From left to right:F814W-(F275W − F814W) and F814W-C(F275W, F336W, F438W) diagrams for a synthetic sample with −1 < [Fe/H] < −0.85) similar to the one shown in Fig. 5. The blue and red fiducial lines shown in each panel as solid lines (determined as described in Sect. 2) highlight the different widths of the RGB in the two diagrams. The width (in magnitudes) of the horizontal axis of the two figures is the same. |
| In the text | |
Current usage metrics show cumulative count of Article Views (full-text article views including HTML views, PDF and ePub downloads, according to the available data) and Abstracts Views on Vision4Press platform.
Data correspond to usage on the plateform after 2015. The current usage metrics is available 48-96 hours after online publication and is updated daily on week days.
Initial download of the metrics may take a while.