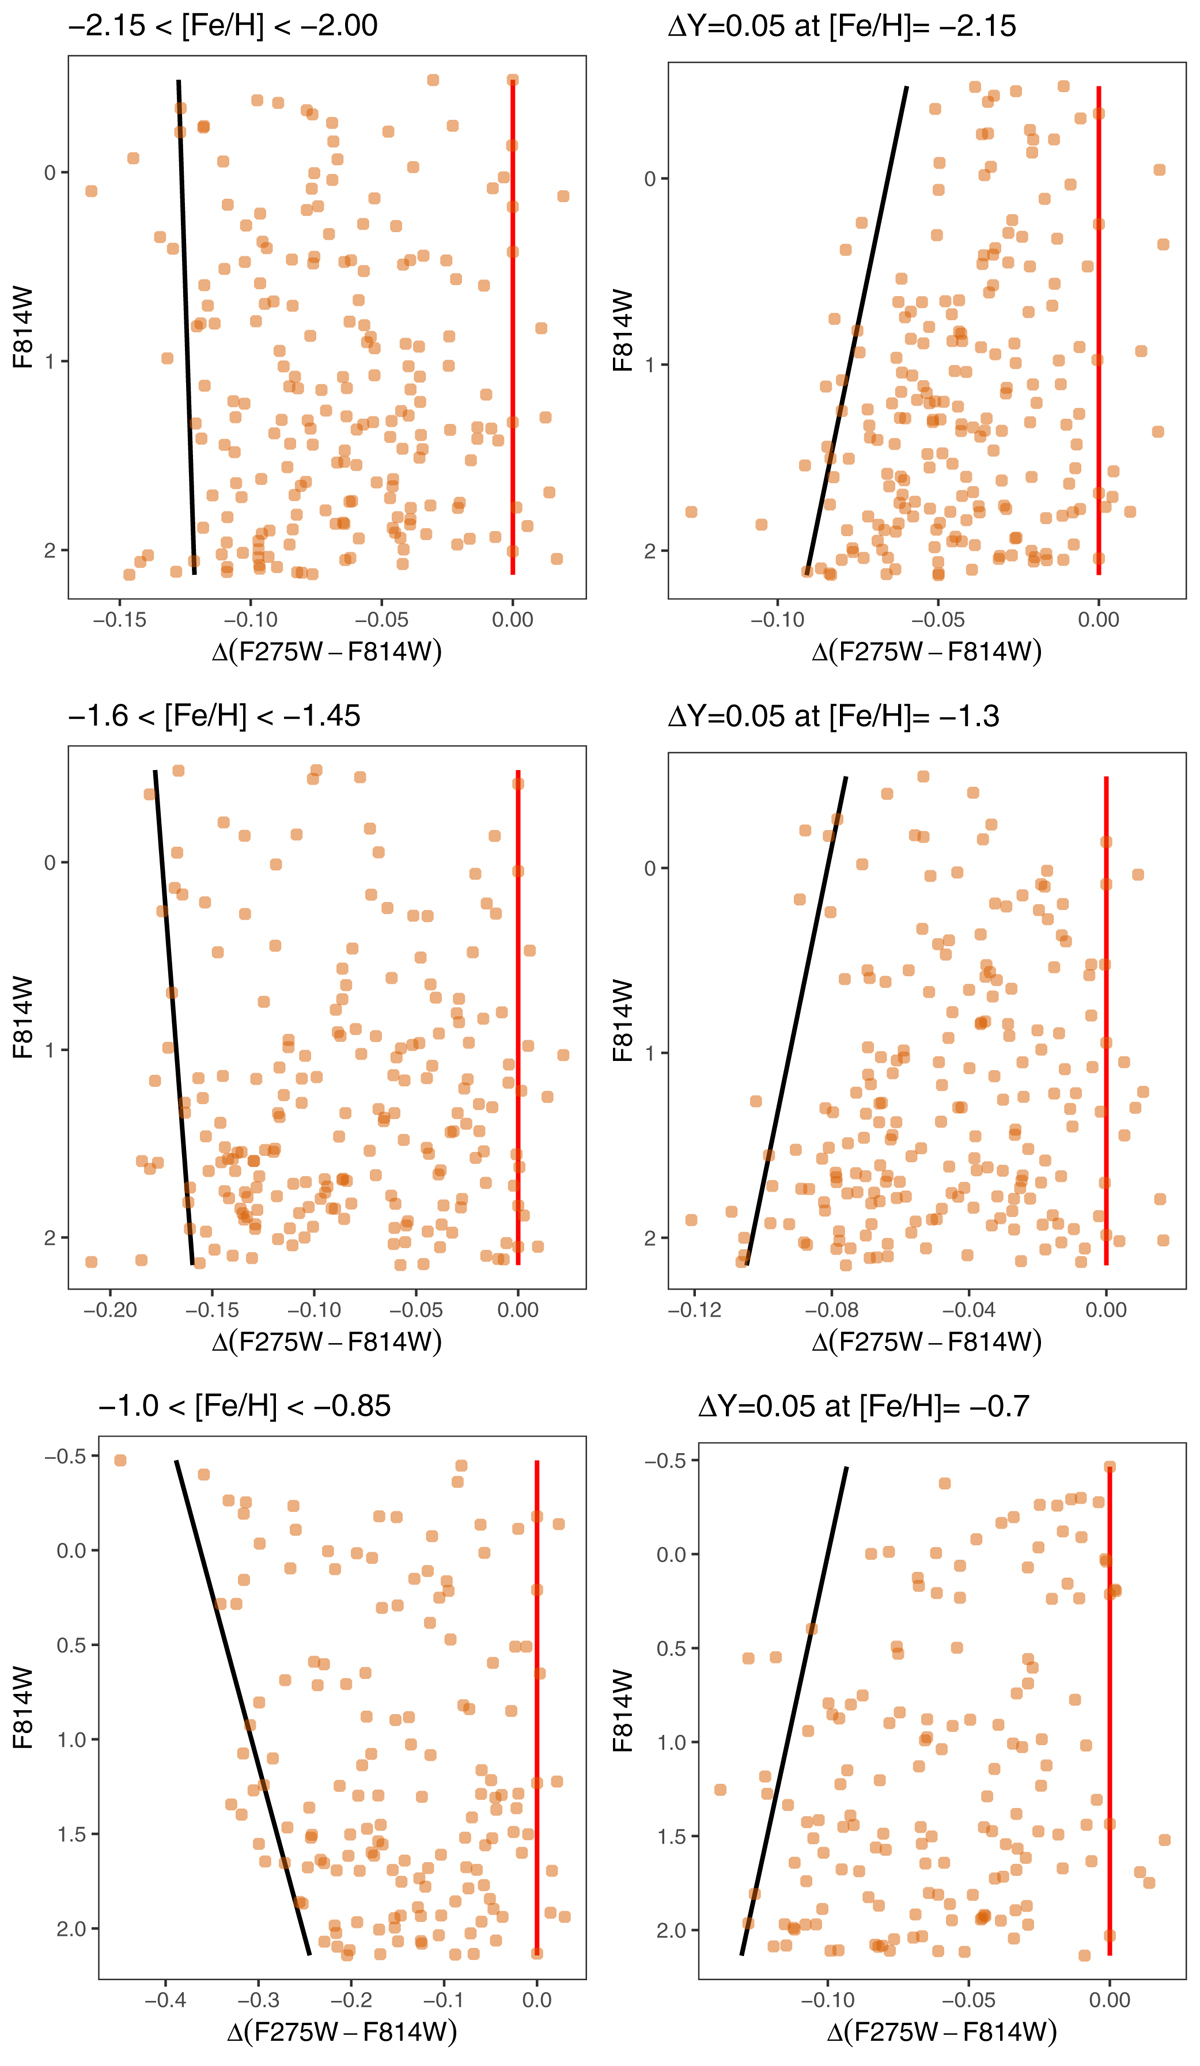
Fig. 5.
Download original image
As Fig. 2, but for synthetic samples of P1 stars (200 objects) including a 0.15 dex uniform spread of metallicity (left panels), or a uniform spread ΔY = 0.05 (right panels). The top row displays the results for populations with [Fe/H] distributed between −2.15 and −2.0 dex, and for a spread of helium at [Fe/H] = −2.15. The middle row shows the case for [Fe/H] between −1.6 and −1.45 dex, and for a spread of helium at [Fe/H] = −1.3. The bottom row displays the case for [Fe/H] between −0.85 and −1.0 dex, and for a range of helium at [Fe/H] = −0.7. In each panel the solid vertical lines at Δ(F275W − F814W) = 0 are the verticalised red fiducials of the F814W-(F275W − F814W) CMDs of the samples. The other line in each panel corresponds to the blue fiducial of the Δ(F275W − F814W) distribution as a function of F814W (see text for details).
Current usage metrics show cumulative count of Article Views (full-text article views including HTML views, PDF and ePub downloads, according to the available data) and Abstracts Views on Vision4Press platform.
Data correspond to usage on the plateform after 2015. The current usage metrics is available 48-96 hours after online publication and is updated daily on week days.
Initial download of the metrics may take a while.