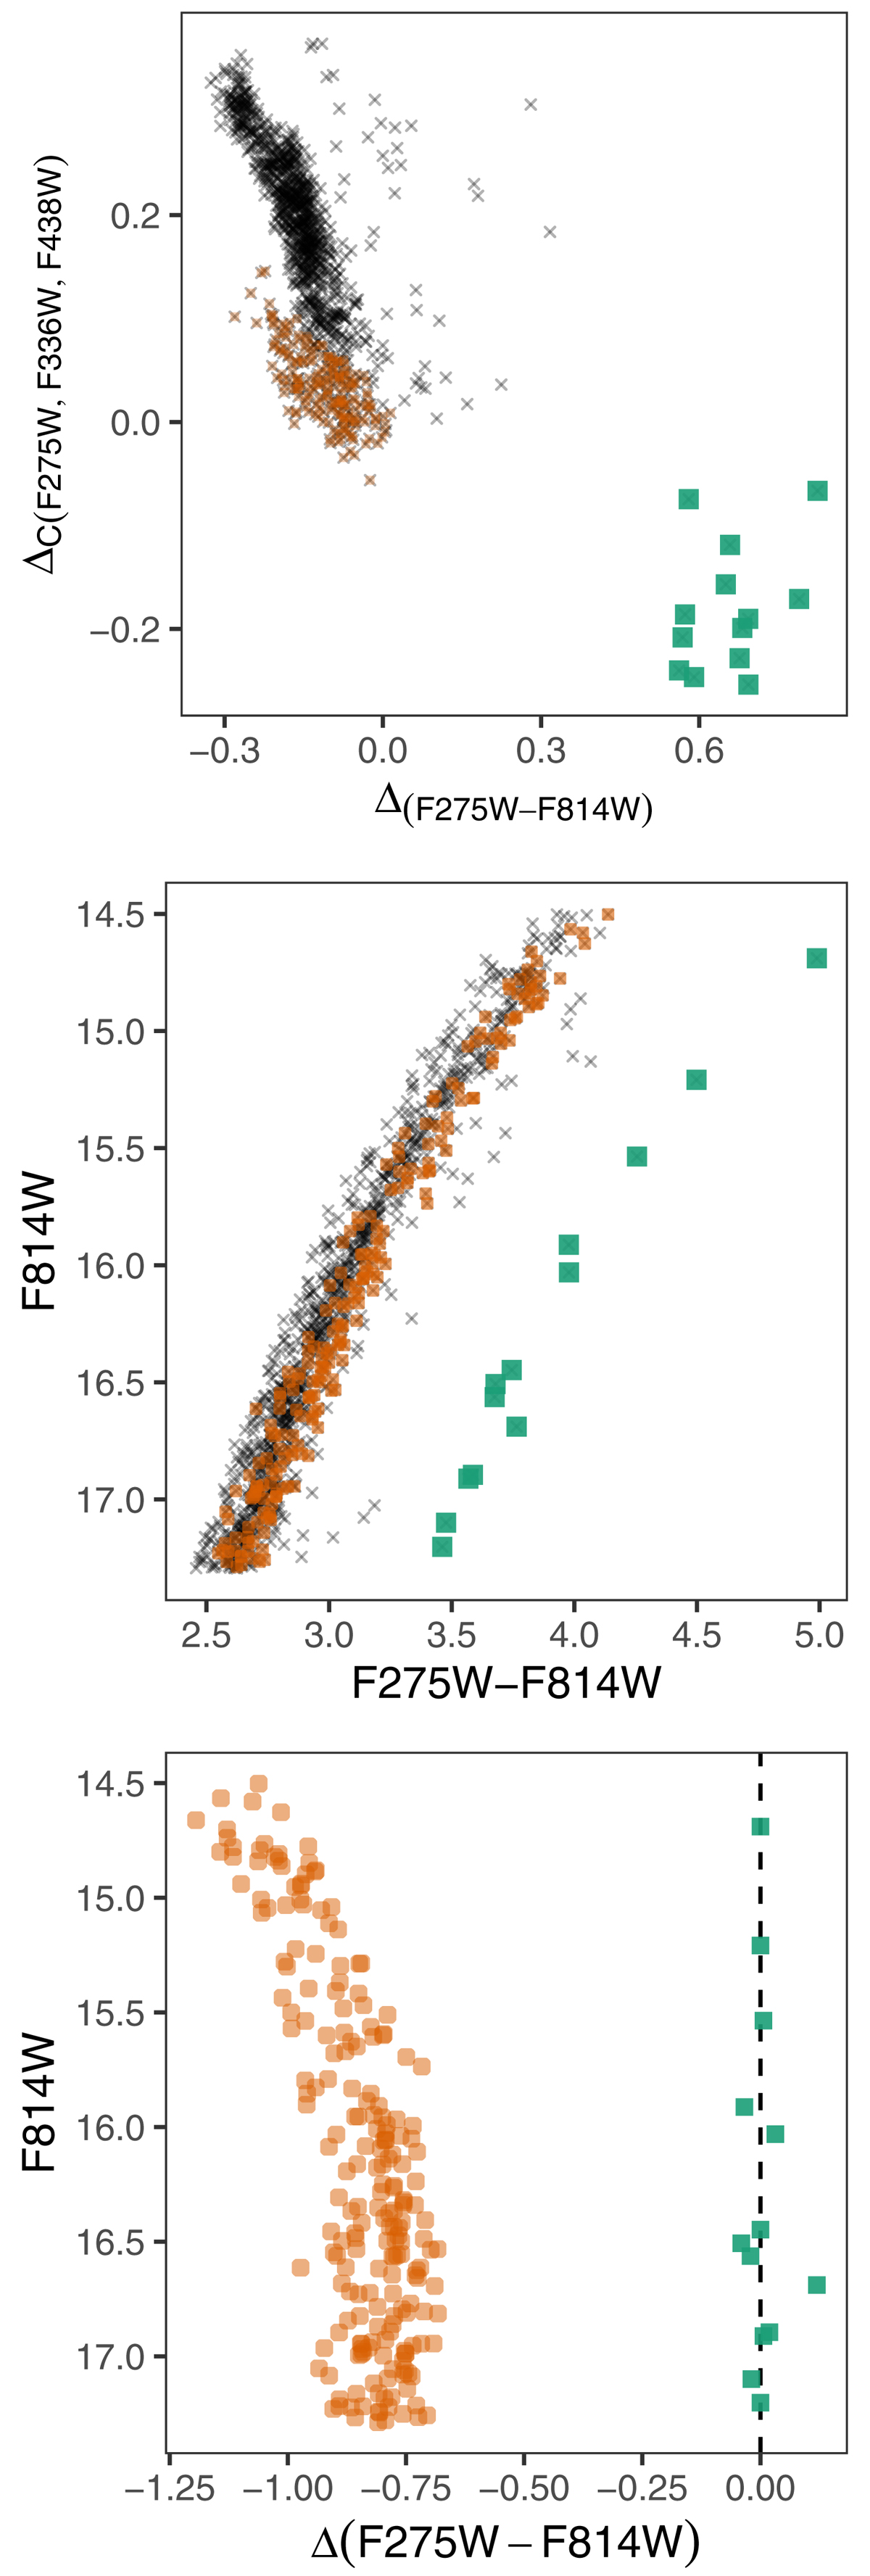
Fig. 4.
Download original image
Top panel: chromosome map of M 2. The P1 and P2 stars in the main cluster component are displayed as large orange circles and black crosses, respectively, while the P1 metal-rich component is shown as green squares. Middle panel:F814W-(F275W − F814W) CMD of the three groups of stars shown in the chromosome map. Bottom panel: similar to the right panel of Fig. 2, but the orange circles display the difference of the (F275W − F814W) colour between the P1 stars of the main cluster component, and the ‘verticalised’ fit to the CMD of the metal-rich component is considered as a reference (dashed line). The individual metal-rich P1 stars are also plotted around the verticalised fit.
Current usage metrics show cumulative count of Article Views (full-text article views including HTML views, PDF and ePub downloads, according to the available data) and Abstracts Views on Vision4Press platform.
Data correspond to usage on the plateform after 2015. The current usage metrics is available 48-96 hours after online publication and is updated daily on week days.
Initial download of the metrics may take a while.