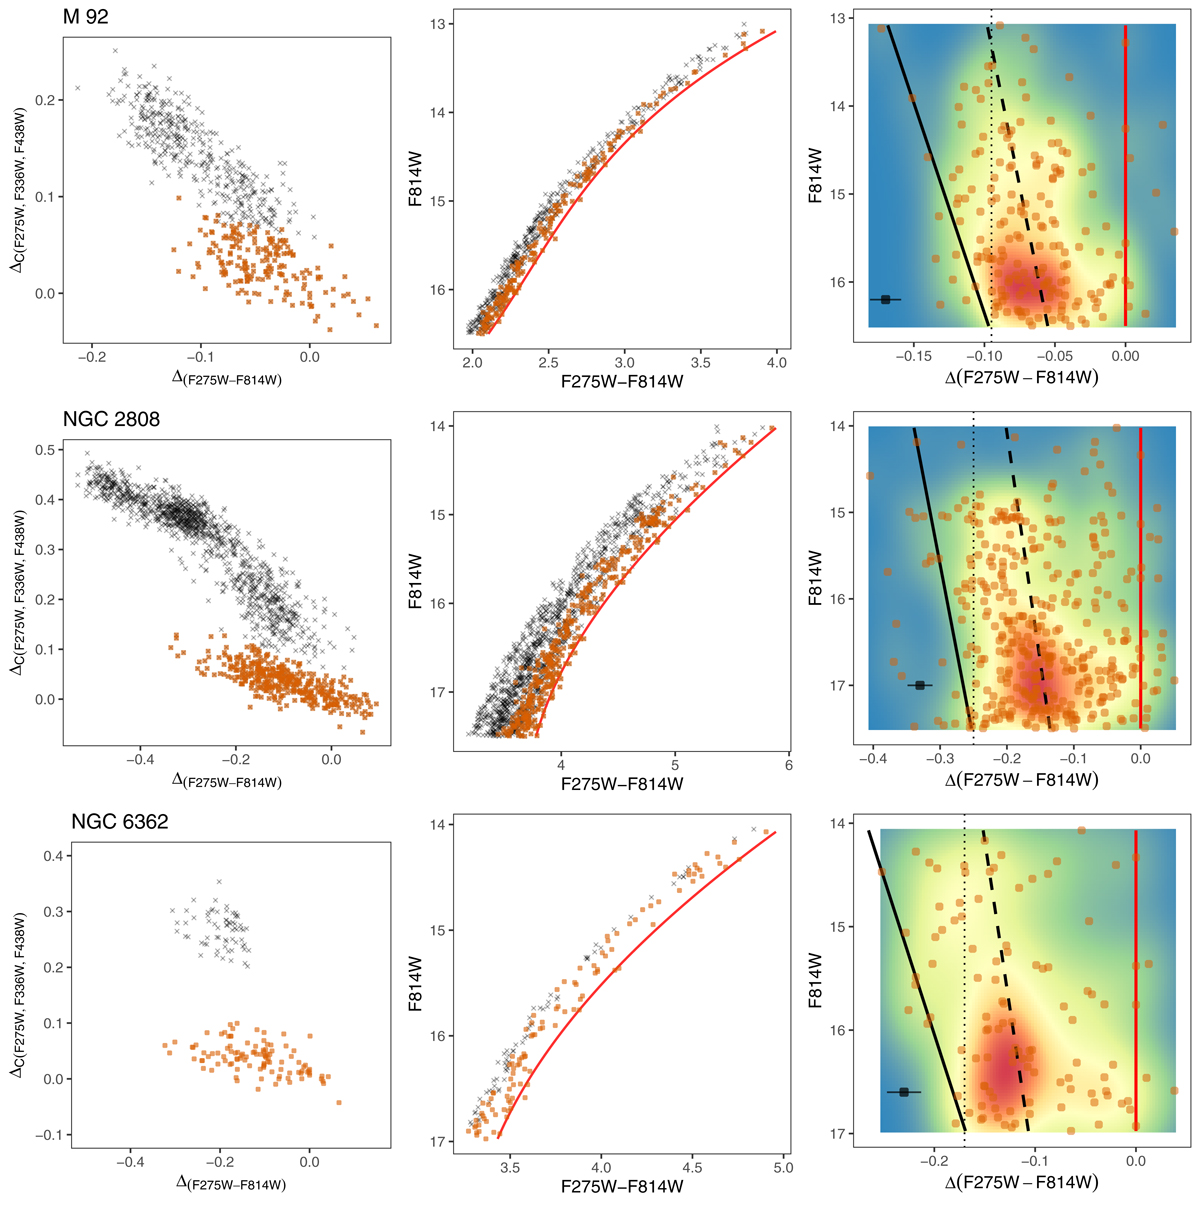
Fig. 6.
Download original image
From top to bottom, the three rows of panels refer to the clusters M 92, NGC 2808, and NGC 6362, respectively. In each row the left panel displays the cluster RGB chromosome map, with small black crosses denoting P2 stars, and orange circles representing the P1 population. The middle panel displays the corresponding F814W-(F275W − F814W) CMD, with a cubic polynomial fit to the red edge of the P1 sequence (red solid line – see text). The faint limit of the CMDs approximately corresponds to 1.5–2.0 mag above the turnoff. The right panel shows the difference of the (F275W − F814W) colour of P1 stars with respect the ‘verticalised’ fit shown in the middle panel (red line). The solid black line is a linear best fit to the 5th percentile of the colour differences as a function of F814W (see text for details), corresponding to the blue fiducial of the Δ(F275W − F814W) distribution as a function of F814W, while the dotted line denotes a comparison vertical sequence to emphasise the sign of the slope of the blue fiducial in this diagram (see text for details). The dashed black line is the best fit to the 50th percentile of the colour differences as a function of F814W. A colour-coded number density 2D map is also displayed. The average 1-σ (F275W − F814W) photometric error over the F814W covered in the figure is show in the bottom left corner of each panel.
Current usage metrics show cumulative count of Article Views (full-text article views including HTML views, PDF and ePub downloads, according to the available data) and Abstracts Views on Vision4Press platform.
Data correspond to usage on the plateform after 2015. The current usage metrics is available 48-96 hours after online publication and is updated daily on week days.
Initial download of the metrics may take a while.