Fig. 7.
Download original image
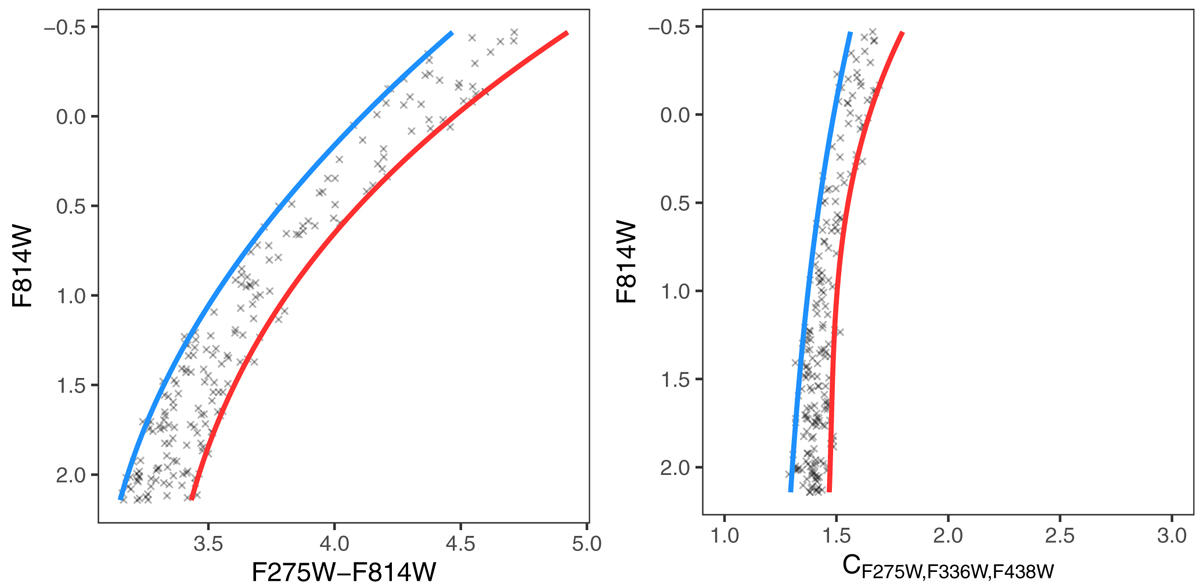
From left to right:F814W-(F275W − F814W) and F814W-C(F275W, F336W, F438W) diagrams for a synthetic sample with −1 < [Fe/H] < −0.85) similar to the one shown in Fig. 5. The blue and red fiducial lines shown in each panel as solid lines (determined as described in Sect. 2) highlight the different widths of the RGB in the two diagrams. The width (in magnitudes) of the horizontal axis of the two figures is the same.
Current usage metrics show cumulative count of Article Views (full-text article views including HTML views, PDF and ePub downloads, according to the available data) and Abstracts Views on Vision4Press platform.
Data correspond to usage on the plateform after 2015. The current usage metrics is available 48-96 hours after online publication and is updated daily on week days.
Initial download of the metrics may take a while.