Fig. 8.
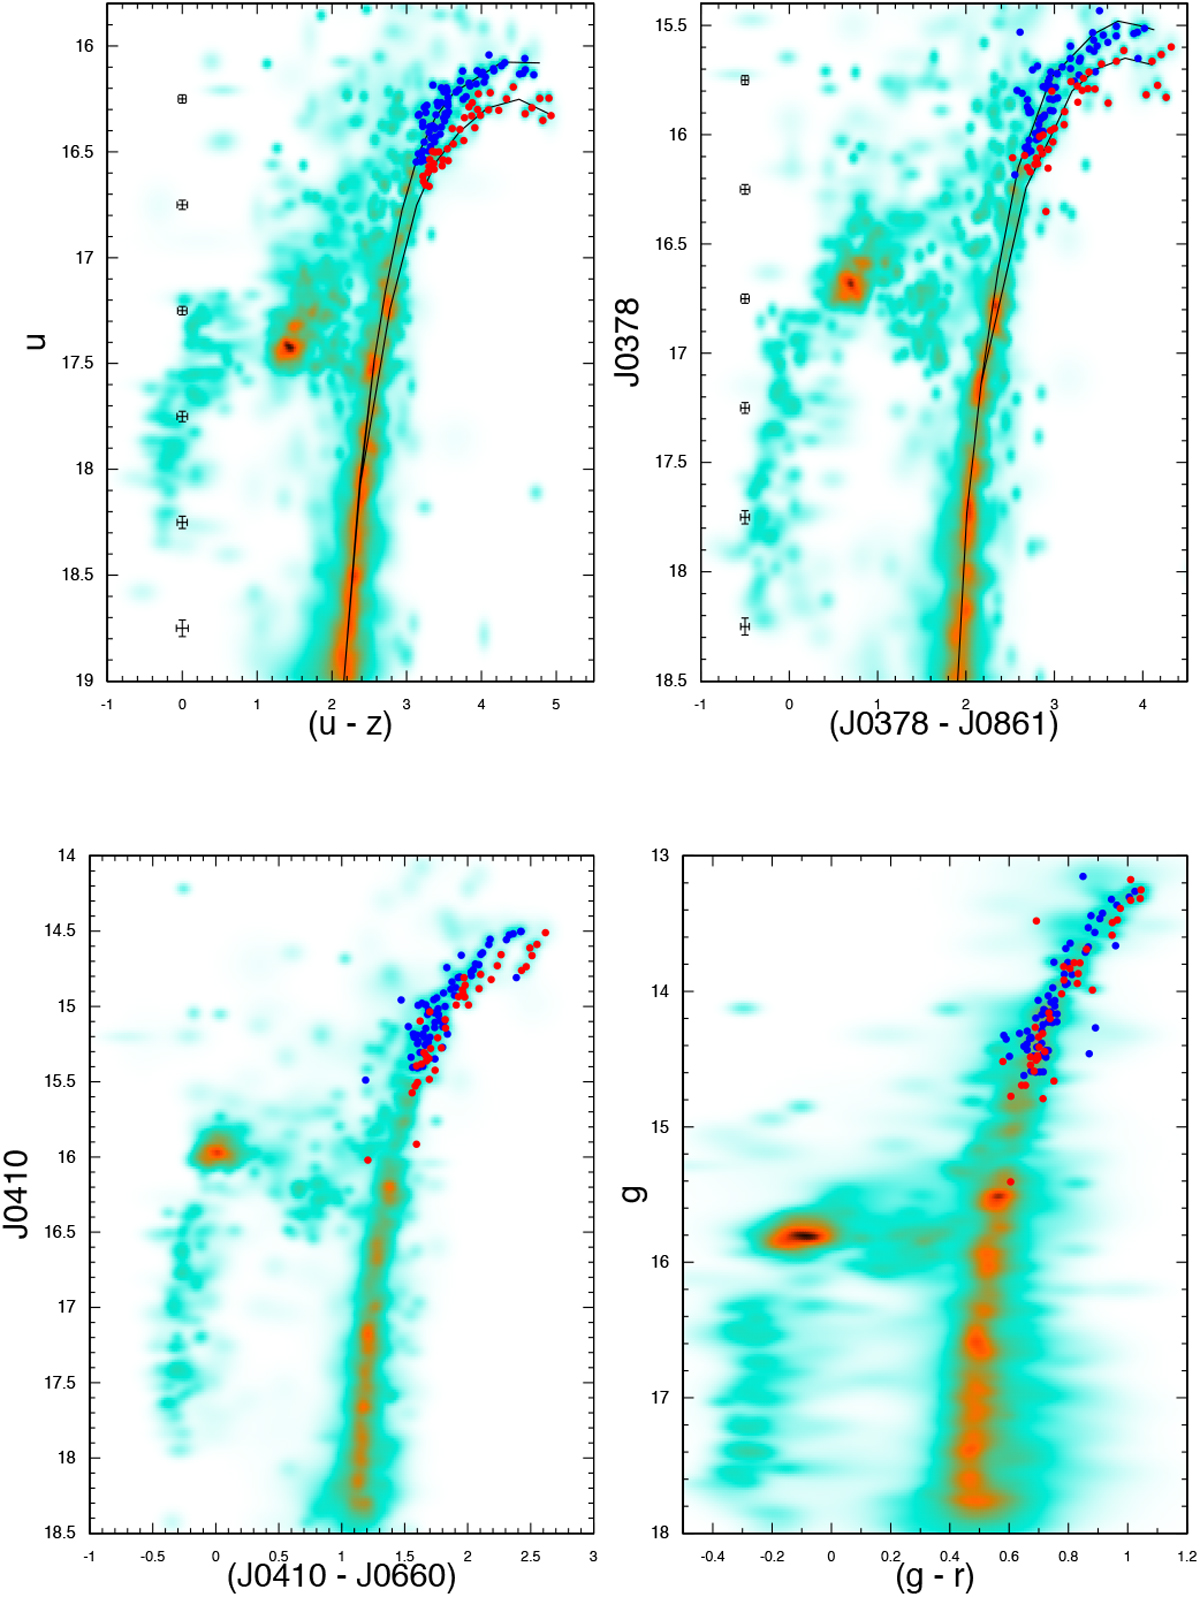
Top panels: CMDs that best show evidence of more than one population, extracted from the central 5′ of the cluster. Fiducial lines for the apparent sequence split in the upper RGB are shown, together with the average error bars computed in bins 0.5 mag wide. Stars of the blue and red sequences are overplotted on the Hess diagram. Bottom panels: same as above for combinations of filters that are not much sensitive to light element abundance variations.
Current usage metrics show cumulative count of Article Views (full-text article views including HTML views, PDF and ePub downloads, according to the available data) and Abstracts Views on Vision4Press platform.
Data correspond to usage on the plateform after 2015. The current usage metrics is available 48-96 hours after online publication and is updated daily on week days.
Initial download of the metrics may take a while.