Free Access
Fig. 6.
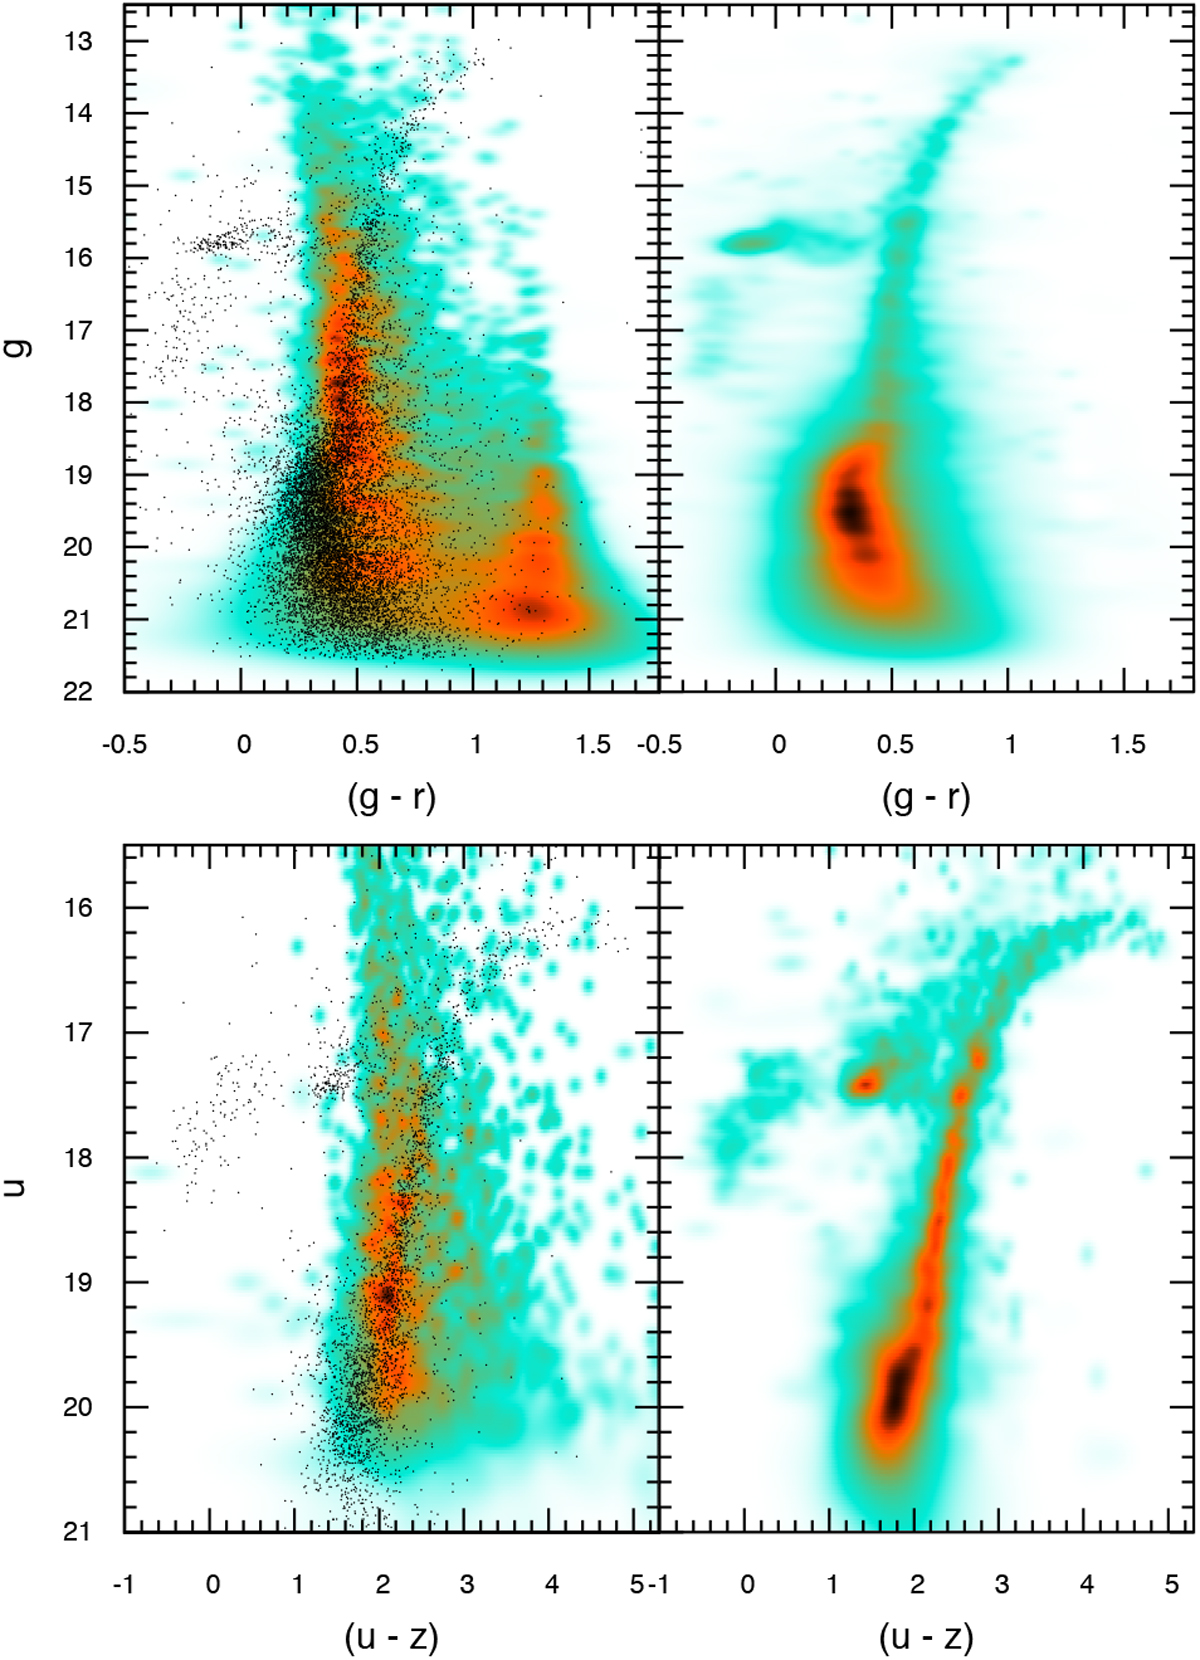
Field-star decontamination illustration in different colours. Left panels: Hess diagram of the underlying field stars is compared to the CMDs extracted in the inner 5′ of M 15 (small black points). Right panels: Hess diagrams built with the decontaminated photometry.
Current usage metrics show cumulative count of Article Views (full-text article views including HTML views, PDF and ePub downloads, according to the available data) and Abstracts Views on Vision4Press platform.
Data correspond to usage on the plateform after 2015. The current usage metrics is available 48-96 hours after online publication and is updated daily on week days.
Initial download of the metrics may take a while.