| Issue |
A&A
Volume 621, January 2019
|
|
|---|---|---|
| Article Number | A116 | |
| Number of page(s) | 18 | |
| Section | Interstellar and circumstellar matter | |
| DOI | https://doi.org/10.1051/0004-6361/201834335 | |
| Published online | 15 January 2019 | |
Particle transport within the pulsar wind nebula HESS J1825–137★
1
Centre for Space Research, North-West University,
Potchefstroom 2520,
South Africa
2
Institut für Experimentalphysik, Universität Hamburg,
Luruper Chaussee 149,
22761
Hamburg,
Germany
3
Max-Planck-Institut für Kernphysik,
PO Box 103980,
69029
Heidelberg,
Germany
4
Dublin Institute for Advanced Studies,
31 Fitzwilliam Place,
Dublin 2,
Ireland
5
National Academy of Sciences of the Republic of Armenia,
Marshall Baghramian Avenue, 24,
0019
Yerevan,
Armenia
6
Yerevan Physics Institute,
2 Alikhanian Brothers St.,
375036
Yerevan,
Armenia
7
Institut für Physik, Humboldt-Universität zu Berlin,
Newtonstr. 15,
12489
Berlin,
Germany
8
Department of Physics, University of Namibia,
Private Bag 13301,
Windhoek,
Namibia
9
GRAPPA, Anton Pannekoek Institute for Astronomy, University of Amsterdam,
Science Park 904,
1098 XH Amsterdam,
The Netherlands
10
Department of Physics and Electrical Engineering, Linnaeus University,
351 95 Växjö,
Sweden
11
Institut für Theoretische Physik, Lehrstuhl IV: Weltraum und Astrophysik, Ruhr-Universität Bochum,
44780
Bochum,
Germany
12
Institut für Astro- und Teilchenphysik, Leopold-Franzens-Universität Innsbruck,
6020
Innsbruck,
Austria
13
School of Physical Sciences, University of Adelaide,
Adelaide 5005,
Australia
14
LUTH, Observatoire de Paris, PSL Research University, CNRS, Université Paris Diderot,
5 Place Jules Janssen,
92190
Meudon,
France
15
Laboratoire de Physique Nucléaire et de Hautes Energies, Sorbonne Université, Université Paris Diderot, Sorbonne Paris Cité, CNRS/IN2P3,
4 Place Jussieu,
75252
Paris,
France
16
Laboratoire Univers et Particules de Montpellier, Université Montpellier, CNRS/IN2P3, CC 72, Place Eugéne Bataillon,
34095
Montpellier Cedex 5,
France
17
IRFU, CEA, Université Paris-Saclay,
91191
Gif-sur-Yvette,
France
18
Astronomical Observatory, The University of Warsaw,
Al. Ujazdowskie 4,
00-478
Warsaw,
Poland
19
Aix-Marseille Université, CNRS/IN2P3, CPPM,
Marseille,
France
20
Instytut Fizyki Ja̧drowej PAN,
ul. Radzikowskiego 152,
31-342
Kraków,
Poland
21
School of Physics, University of the Witwatersrand,
1 Jan Smuts Avenue,
Braamfontein,
Johannesburg,
2050
South Africa
22
Laboratoire d’Annecy de Physique des Particules, Université Grenoble Alpes, Université Savoie Mont Blanc, CNRS, LAPP,
74000
Annecy,
France
23
Landessternwarte, Universität Heidelberg, Königstuhl,
D 69117
Heidelberg,
Germany
24
CNRS/IN2P3, Centre d’Études Nucléaires de Bordeaux Gradignan, Université Bordeaux,
33175
Gradignan,
France
25
Oskar Klein Centre, Department of Physics, Stockholm University, Albanova University Center,
10691
Stockholm,
Sweden
26
Institut für Astronomie und Astrophysik, Universität Tübingen,
Sand 1,
72076
Tübingen,
Germany
27
Laboratoire Leprince-Ringuet, Ecole Polytechnique, CNRS/IN2P3,
91128
Palaiseau,
France
28
APC, AstroParticule et Cosmologie, Université Paris Diderot, CNRS/IN2P3, CEA/Irfu, Observatoire de Paris, Sorbonne Paris Cité, 10 rue Alice Domon et Léonie Duquet,
75205
Paris Cedex 13,
France
29
Université Grenoble Alpes, CNRS, IPAG,
38000
Grenoble,
France
30
Department of Physics and Astronomy, The University of Leicester,
University Road,
Leicester,
LE1 7RH,
UK
31
Nicolaus Copernicus Astronomical Center, Polish Academy of Sciences,
ul.Bartycka 18,
00-716
Warsaw,
Poland
32
Institut für Physik und Astronomie, Universität Potsdam,
Karl-Liebknecht-Strasse 24/25,
14476
Potsdam,
Germany
33
Friedrich-Alexander-Universität Erlangen-Nürnberg, Erlangen Centre for Astroparticle Physics,
Erwin-Rommel-Str. 1,
91058
Erlangen,
Germany
34
DESY,
15738
Zeuthen,
Germany
35
Obserwatorium Astronomiczne, Uniwersytet Jagielloński,
ul. Orla 171,
30-244
Kraków,
Poland
36
Centre for Astronomy, Faculty of Physics, Astronomy and Informatics, Nicolaus Copernicus University,
Grudziadzka 5,
87-100
Torun,
Poland
37
Department of Physics, University of the Free State,
PO Box 339,
Bloemfontein
9300,
South Africa
38
ITA, Universität Heidelberg,
Heidelberg,
Germany
39
Department of Physics, Rikkyo University,
3-34-1 Nishi-Ikebukuro,
Toshima-ku,
Tokyo
171-8501,
Japan
40
Kavli Institute for the Physics and Mathematics of the Universe, The University of Tokyo Institutes for Advanced Study, The University of Tokyo,
5-1-5 Kashiwa-no-Ha,
Kashiwa City,
Chiba
277-8583,
Japan
41
Department of Physics, The University of Tokyo,
7-3-1 Hongo,
Bunkyo-ku,
Tokyo
113-0033,
Japan
42
RIKEN,
2-1 Hirosawa,
Wako,
Saitama
351-0198,
Japan
43
Physik Institut,
Universität Zürich,
Winterthurerstrasse 190,
8057
Zürich,
Switzerland
Received:
28
September
2018
Accepted:
25
October
2018
Abstract
Context. We present a detailed view of the pulsar wind nebula (PWN) HESS J1825–137. We aim to constrain the mechanisms dominating the particle transport within the nebula, accounting for its anomalously large size and spectral characteristics.
Aims. The nebula was studied using a deep exposure from over 12 years of H.E.S.S. I operation, together with data from H.E.S.S. II that improve the low-energy sensitivity. Enhanced energy-dependent morphological and spatially resolved spectral analyses probe the very high energy (VHE, E > 0.1 TeV) γ-ray properties of the nebula.
Methods. The nebula emission is revealed to extend out to 1.5° from the pulsar, ~1.5 times farther than previously seen, making HESS J1825–137, with an intrinsic diameter of ~100 pc, potentially the largest γ-ray PWN currently known. Characterising the strongly energy-dependent morphology of the nebula enables us to constrain the particle transport mechanisms. A dependence of the nebula extent with energy of R ∝ Eα with α = −0.29 ± 0.04stat ± 0.05sys disfavours a pure diffusion scenario for particle transport within the nebula. The total γ-ray flux of the nebula above 1 TeV is found to be (1.12 ± 0.03stat ± 0.25sys) × 10−11 cm−2 s−1, corresponding to ~64% of the flux of the Crab nebula.
Results. HESS J1825–137 is a PWN with clearly energy-dependent morphology at VHE γ-ray energies. This source is used as a laboratory to investigate particle transport within intermediate-age PWNe. Based on deep observations of this highly spatially extended PWN, we produce a spectral map of the region that provides insights into the spectral variation within the nebula.
Key words: gamma rays: general / acceleration of particles / convection / diffusion / pulsars: general
Sky maps as FITS files and spectra are only available at the CDS via anonymous ftp to cdsarc.u-strasbg.fr (130.79.128.5) or via http://cdsarc.u-strasbg.fr/viz-bin/qcat?J/A+A/621/A116
Corresponding authors: H.E.S.S. Collaboration, e-mail: This email address is being protected from spambots. You need JavaScript enabled to view it.
Funded by EU FP7 Marie Curie, grant agreement No. PIEF-GA-2012-332350.
Heisenberg Fellow (DFG).
Deceased.
© ESO 2019
1 Introduction and multi-wavelength context
Pulsar wind nebulae (PWNe) are one of the largest Galactic source classes at very high energy (VHE, E > 0.1 TeV) γ-ray energies, as recently demonstrated by the H.E.S.S. (High Energy Stereoscopic System) Galactic Plane Survey (HGPS; H.E.S.S. Collaboration 2018a). The characteristics of the known VHE γ-ray PWNe were further explored in an associated PWNe population study, finding that these PWNe are associated with pulsars with a high spin-down luminosity (Ė > 1035 erg s−1; H.E.S.S. Collaboration 2018b).
Following a supernova explosion, PWNe may form around the pulsar PSR remnant of the progenitor star; the wind expands into the region that has been evacuated by the supernova ejecta. Pulsars have a strong induced electric field on their surface and generate a plasma of electrons and positrons through pair production in the magnetosphere (“Electrons” here refer to both electrons and positrons). This produces highly relativistic winds (with a frozen-in magnetic field) of electron–positron pairs that stream away from the pulsar region. Within this wind-dominated region, a significant proportion of the Poynting flux of the magnetic dipole radiation is converted into particle kinetic energy (Rees & Gunn 1974). The mechanisms by which this occurs remain an active area of research (Kirk & Skjæraasen 2003; Kirk et al. 2009; Porth et al. 2013). As the ram pressure of the magnetised wind reduces to the pressure of the surrounding medium, a termination shock forms at the front of the expanding supernova (Rees & Gunn 1974; Kennel & Coroniti 1984). Charged particles can be further accelerated at this shock, for example, by diffusive shock acceleration, as long as they remain confined to the shock region (Reynolds & Chevalier 1984). Relativistic particles downstream of the shock produce synchrotron and inverse Compton (IC) radiation that is detectable from radio through to X-rays and in the γ-ray region, respectively. Pulsars are expected to be major contributors to the leptonic cosmic ray flux measured at Earth (Shen 1970; Atoyan et al. 1995).
The expanding supernova shell slows down as it accumulates material in the surrounding interstellar medium (ISM); as the supernova enters the Sedov-Taylor phase, the shell comprises both a forward and reverse shock that eventually returns inwards (Truelove & McKee 1999). The reverse shock formed in such systems may interact with the termination shock of the expanding PWN, leading to a crushing effect in some systems (Reynolds & Chevalier 1984). As the pulsar continues to produce a wind-driven outflow, the system rebounds against crushing by the reverse shock with further PWN expansion. Complex reverberations follow, until over time, the system relaxes (Gaensler & Slane 2006). VHE γ-ray PWNe are often extended and offset from the associated pulsar because the supernova remnant (SNR) expands into an inhomogeneous medium, resulting in variation in reverse shock interaction times around the PWN (Gaensler & Slane 2006; de Jager & Djannati-Ataï 2009). This evolutionary scenario is typically invoked to account for the wide variety of PWN morphology seen in older, evolved systems, with multiple examples of unique morphology known (Aharonian et al. 2005a; H.E.S.S. Collaboration 2012a,b). When the SNR shell has dissipated, only the PWN remains detectable. Alternatively, PWN may interact with the supernova material and form a composite SNR–PWN system.
PSR B1823-13 (RA: 18h26m13.06s, Dec: − 13°34′48.1″, also known as PSR J1826-1334), is a young pulsar (characteristic spin-down age τ = 2.14 × 10⁴ yr) with a spin-down power of Ė = 2.8 × 1036 erg s−1 and a period of P = 0.1015 s, situated at a distance of approximately 4 kpc (Manchester et al. 2005). It therefore has the characteristics of a Vela-like pulsar (Aharonian et al. 2006a).The distance estimate to PSR B1823-13 has been revised multiple times in therange 3.6–4.2 kpc since (Aharonian et al. 2006b). We adopt a 4 kpc distance for the nebula in this paper.
X-ray observations of PSR B1823-13 with ROSAT revealed a point source surrounded by a compact nebula of ~ 20″ radius and a diffuse ~4′ region of extended emission (Finley et al. 1996). This X-ray detection of a synchrotron nebula was later confirmed by ASCA (Advanced Satellite for Cosmology and Astrophysics), who also found a point source with a surrounding diffuse nebula (Sakurai et al. 2001).
XMM-Newton (X-ray Multi-Mirror Mission) observations confirmed the identification in X-rays of both a compact core and a diffuse component to the nebula, extending to 30′′ and 5′, respectively. The morphology was found to be asymmetric, which was attributed to compression and distortion of the pulsar wind by an asymmetric reverse shock interaction (Gaensler et al. 2003). Subsequent observations by the X-ray satellites Chandra and Suzaku used multiple observation positions to cover the extended nebula. They consistently identified a compact core and extended component to the nebula, with Suzaku measurements finding diffuse X-ray emission up to 15′ (17pc) from the pulsar (Pavlov et al. 2008; Uchiyama et al. 2009). All X-ray observations consistently found a power-law spectrum, ϕ ∝ E−Γ, with spectral index around Γ ≈ 2 for the extended diffuse component, and a somewhat harder power-law index of Γ ≈ 1.3−1.6 for the compact core. Additionally, Pavlov et al. (2008) performed infrared (Spitzer GLIMPSE survey) and radio (NRAO – National Radio Astronomy Observatory; VLA – Very Large Array – Sky Survey) observations of the region at 8 μm, 24 μm and 1.4 GHz, but found no obvious counterparts to the nebula.
Radio observations of PSR B1823-13 with the VLA were used to derive its proper motion, finding a tangential velocity of v⊥ = (443 ± 46) km s−1 at the nominal 4 kpc distance. This corresponds to a total distance of 8.2′ travelled across the sky during the pulsar’s characteristic age τ of 21 kyr, interestingly, in a direction almost perpendicular to that in which the nebula extends. Pavlov et al. (2008) suggested that the large angle between the nebula extension and the pulsar’s proper motion trajectory lends credence to an evolutionary scenario where the nebula shape was influenced at early times by a reverse-shock interaction.
The H.E.S.S. experiment is an array of five imaging atmospheric Cherenkov telescopes (IACTs) and is situated in the Khomas highlands of Namibia (Hinton 2004). Comprised until 2012 of four 107 m2 mirror area IACTs (CT1-4), H.E.S.S. then entered a second phase of operation with the addition of a fifth 612 m2 mirror area IACT (CT5), which lowered the energy threshold (Holler et al. 2015; H.E.S.S. Collaboration 2017).
An associated VHE γ-ray nebula was discovered by H.E.S.S. in 2005 as part of the first H.E.S.S. Galactic plane survey (HGPS; Aharonian et al. 2005b) and was given the identifier HESS J1825–137, with an extent in VHE γ-rays of 0.5°; this exceeds that of the X-ray nebula. It was found to be one of the brightest sources in the Milky Way at these very high energies (Aharonian et al. 2006d). A further detailed study made by H.E.S.S. in 2006 explored the nebula properties at TeV energies; in particular, the nebula was shown to exhibit a strongly energy-dependent morphology (Aharonian et al. 2006b). In spatially resolved spectra, the spectral index was seen to soften with increasing distance from the pulsar, which implies that the population of electrons in the nebula had travelled and cooled out to large distances. That the low-energy electrons at large distances from the pulsar produce the softest spectrum was interpreted to mean that these are the oldest electrons in the system. Several mechanisms might account for this trend: radiative cooling of electrons as they propagate away from the pulsar and cause energy loss, energy-dependent transport mechanisms such as diffusion or advection, or a variation in the electron injection spectrum over time (Aharonian et al. 2006b).
Two other prominent γ-ray sources lie in close proximity to HESS J1825–137: the binary system LS 5039 to the south, and the unidentified hard-spectrum source HESSJ1826–130 to the north. Previously thought to be part of the HESS J1825–137 complex, HESS J1826–130 has since been identified as a separate source in the HGPS (H.E.S.S. Collaboration 2018a).
In 2011, HESS J1825–137 was detected by Fermi-LAT (Fermi Large Area Telescope) in the energy range 1–100 GeV. The best-fit rms extent with a Gaussian morphological model was σ = 0.56° ± 0.07° (Grondin et al. 2011). The emission is best described by a power law with spectral index Γ = 1.38 ± 0.12stat ± 0.16sys and flux consistent with that reported by H.E.S.S., with the peak of the GeV emission spatially offset by 0.32° from the TeV peak.
In the 2017 Fermi Galactic Extended Source Catalogue (FGES), a disc morphological model was adopted, with a somewhat larger radius of  . The spectrum obtained from 10 GeV to 2 TeV joined previous Fermi-LAT and H.E.S.S. results and confirmed that an IC peak occurs at around 100 GeV. A log-parabola spectral model was preferred over power-law models, with an index of Γ = 1.3 ± 0.1stat ± 0.4sys and an integrated flux from 10 GeV to 2 TeV of (19.59 ± 0.14stat ± 0.22sys) × 10−10 cm−2 s−1 with a curvature of β = 0.27 ± 0.05stat ± 0.07sys. The source FGES J1825.2-1359 alone in the FGES above 10 GeV has a log-parabola rather than power law as the best-fit spectral model (Ackermann et al. 2017).
The detection of an extended faint radio counterpart to the nebula in extended VLA (EVLA) observations at 1.4 GHz was made in 2012 by Castelletti et al. (2012), who also found a nearby molecular cloud with a density of ~ 400 cm−3. Investigation of interstellar gas properties (using molecular CO and atomic HI observations) revealed a dense molecular cloud north of the nebula, which is thought to help explain the apparent current asymmetric shape (Lemiere et al. 2005). At all wavelengths, the nebula emission lies predominantly south of the pulsar. It is thought that at early times, the outward-moving SNR shell interacted with and was slowed down by the nearby molecular cloud, leading to comparatively rapid formation of a reverse shock on the northern side of the nebula. The return of this reverse shock pushed the nebula towards the southern side; this preference has since remained in place, although the nebula has considerably broadened.
Recent studies of the surrounding region by Voisin et al. (2016) have claimed a potential association between the progenitor SNR of HESS J1825–137 and a Hα ridge-like structure found by Stupar et al. (2008). Using millimetre observations with the Mopra and Nanten telescopes, Voisin et al. (2016) identified six regions of interest that revealed several molecular gas clouds traced by a variety of spectral lines. Significant amounts of molecular gas were found towards HESS J1826–130 (in five of the six regions), with a sixth more southerly region of dense gas located within the γ-ray nebula.
Most recently, the HAWC (High Altitude Water Cherenkov) experiment detected highly significant emission coming from the HESS J1825–137 region as part of the HAWC Galactic Plane Survey, although due to its limited angular resolution, it was not possible to separately identify HESS J1825–137 and the neighbouring source HESS J1826–130. This led to the HAWC identifier 2HWC J1825–134 for the combined emission from the region (Abeysekara et al. 2017).
2 H.E.S.S. data and analysis
The H.E.S.S. dataset on the HESS J1825-137 region is considerably larger than that available to previous studies; together with improved analysis procedures, the sensitivity to weaker emission has been significantly enhanced by an increase in exposure of a factor of four with respect to Aharonian et al. (2006b). For the purpose of this study, the H.E.S.S. data were analysed using standard event selection cuts in two different combinations, A and B, according to the configuration of telescopes that was used (Aharonian et al. 2006a). Analysis A comprises all data in which at least three of the four original H.E.S.S. telescopes (CT1-4) participated for a total exposure of ~400 h from data taken between 2004 and 2016 (see Table 1). Analysis B only includes data in which CT5 participated in the trigger, for a total exposure time of ~140 h. All data were analysed in stereoscopic mode, that is, at least two telescopes contributed to each event. Consequently, most of the data comprising analysis B are also included in analysis A, but were analysed without CT5 for compatibility with the analysis of pre-2012 data. We note that ~226 h of the analysis A exposure stem from data post-2012; considerably more time than in analysis B, as CT5 was not always present in observations of this region. Analysis A has the advantage of deep exposure with good resolution, whilst analysis B, which always includes CT5, offers a lower energy threshold. The mean zenith angle of the observations in both analyses is given in Table 1. The energy threshold of H.E.S.S. II for a spectral analysis with analysis B is around 140 GeV, whilst the threshold is around 200 GeV for analysis A. These two thresholds are both much lower than the previous threshold of 270 GeV (Aharonian et al. 2006b). Unless otherwise specified, the results presented in this paper are from analysis A.
A sensitive likelihood-based template fitting analysis was used for this study (Parsons & Hinton 2014). All results from both analyses were cross-checked using an independent calibration and analysis chain (de Naurois & Rolland 2009), and were found to be consistent within systematic errors. In the case of H.E.S.S. I, the contributions to systematic errors that affect the spectral analysis are given in Aharonian et al. (2006a).
Two methods of background estimation were used in this analysis. For morphological studies and the generation of sky maps, the ring background method was applied, whilst for spectral analyses, the reflected background method was used. These methods and their comparative suitability for different types of analysis are discussed in Berge et al. (2007). Both methods designate a particular region within the field of view as the source ON region (the ON region may be called the “region of interest” in the case of potential sources) and an independent region within the field of view as being suitable for background estimation (the OFF region).
Summary of the data used in the two analyses, including the exposure and mean zenith angle θz of the observations.
3 VHE γ-ray nebula HESS J1825–137
Firstly, we present maps and spectra for comparison with previous H.E.S.S. results (Aharonian et al. 2006b). Excess count maps of the region, constructed with analyses A and B using the ring background method, are shown in Fig. 1, in which the binary system LS 5039 is clearly visible as an additional point-like source (Aharonian et al. 2006c). The colour scale of Fig. 1 is optimised for HESS J1825–137, such that the image of LS 5039 is saturated and appears larger than the point-spread function (PSF). The location of the more recently discovered hard-spectrum extended source HESS J1826–130 is indicated by a green dashed circle north of the nebula. The extended emission from this source overlaps with the larger region of spectral extraction, although the contributionto the flux is expected to be minor. The position of PSR B1823–13 is also shown. The PSF was modelled using a triple-Gaussian function; for the map in Fig. 1, the 68% containment radius of the PSF is 0.064°, whilst for analysis B, it is slightly larger at 0.077° as a result of the lower median energy. A correlation radius of 0.07° was used forall excess count maps, and the significance was calculated using the number of ON and OFF events, as described in Li & Ma (1983).
A spectrum of the nebula, shown in Fig. 2, was extracted from analyses A and B using a spectral extraction region with a radius of 0.8° that matches the spectrum used in Aharonian et al. (2006b), and it was centred on the best-fit position of the nebula obtained from their 2D Gaussian morphological fit (18h25m41s, − 13°50′21″). Below 1 TeV, the flux obtained with analysis B appears systematically lower than that of analysis A, although the two spectra are compatible within two standard deviations. This reduction in flux explains the comparatively harder spectral indices that are obtained with analysis B, and it may indicate difficulties with the background estimation at low energies.
Additionally, a spectrum was extracted from the core region (of 0.4° radius) of the nebula in order to characterise the spectrum of the brightest part of the nebula, which contains the peak and highest energy emission but decisively omits any contribution from HESS J1826–130. The results of the fits are given in Table 2. The fitted parameters agree reasonably well with those of Aharonian et al. (2006b). The residuals of the spectral points to the fit were calculated as (point – model) / model.
Curved spectral models are favoured over a power-law model for all three spectra shown in Table 2 at the 7σ level for analysis A and at 3σ for analysis B. At all energies, the flux from the core region of HESS J1825–137 dominates that from HESS J1826–130 (Angüner et al. 2017). Towards the highest energies, the emission from the core region with 0.4° radius of HESS J1825–137 converges towards the flux of the larger region of 0.8°, which indicates that the region contains all of the high-energy emission. The integral flux above a given energy from HESS J1826–130 was found never to exceed 20% of the flux from the 0.8° region, suchthat we may assume that any contamination of HESS J1825–137 by HESS J1826–130 due to overlapping regions is not significant compared to the errors shown. Towards lower energies and especially below ~ 1.5 TeV, the spectrum of HESS J1826–130 is considerably contaminated by HESS J1825–137. The level of contamination will be addressed by a forthcoming publication on HESS J1826–130.
For the regions of 0.8° radius, the χ2∕ndf indicates a marginal preference for a power law with an exponential cut-off over a log-parabola fit (Aharonian et al. 2006b), whilst there is no preference shown for the core region of 0.4° radius with analysis A. (Spectral points for all three spectra in Table 2 are available as part of the supplementary information.)
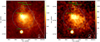 |
Fig. 1 Left panel: excess count map of the nebula using analysis A, with the Galactic plane indicated by the dashed white line and the locations of two energetic pulsars in the region indicated by green triangles. The two spectral extraction regions used in Fig. 2 are overlaid. The larger region with a radius of 0.8° slightly overlaps HESS J1826–130 (RA: 18h26m00s, Dec: − 13°02′02″), whose location and approximate extent is indicated by the green dashed circle, whereas the region with the smaller radius of 0.4° encompasses the core emission and peak of the nebula. Both regions are centred on the best-fit position of the nebula as determined by Aharonian et al. (2006b). Right panel: excess count map of the nebula using analysis B, shown for comparison with the region of 0.8° radius overlaid. The exposure times and telescope configurations for the two analyses are given in Table 1. A correlation radius of 0.07° was used forboth excess maps. |
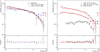 |
Fig. 2 Left panel: spectra extracted from the region with a radius of 0.8° shown in Fig. 1, encompassing the majority of the nebula emission. The fit parameters given in Table 2 for analyses A and B both agree well with the previously reported spectrum (Aharonian et al. 2006b). Right panel: comparison of spectra extracted from the regions of 0.8° and 0.4° radii shown in Fig. 1 together with a spectrum of HESS J1826–130 (Angüner et al. 2017). All spectra are shown with a best-fit model of a power law with exponential cut-off. |
Fit parameters for various fits to the nebula spectrum extracted from a symmetric region of 0.8° and 0.4° radius, respectively, with E0 = 1TeV and I0 in units of 10−12 cm−2 s−1 TeV−1.
4 Morphological analysis
Analysis A with the longer exposure (using CT1-4) was conducted in four energy bands, E < 1 TeV, 1 TeV < E <10 TeV, E > 10 TeV, and E > 32 TeV, in which the nebula size can be clearly seen to decrease with increasing energy, as shown in Fig. 3. This is supporting evidence that the emission is attributable to PSR B1823–13, and it provides some indication that the electron population cools over time asthe particles are transported away from the pulsar. The peak of the nebula emission is also seen to be offset from the pulsar position until energies above 32 TeV are reached.
Overall, the nebula morphology is highly asymmetric, extending a large distance away from the pulsar towards the south, but with only minor extension towards the north. The changing extent with energy is apparent in the excess count maps in different energy bands shown in Fig. 3. At the highest energies (E > 32 TeV), the nebula is significantly less extended and reduced to a small, almost symmetric emission region close to the pulsar. The presence of HESS J1826–130 becomes apparent in the medium-energy range, and the identification as an independent source is verified based on the spatial separation between HESS J1826–130 and HESS J1825–137 towards the highest energies, where an association of HESS J1826–130 with PSR J1826–1256 seems plausible (Angüner et al. 2017). PSR J1826–1256 is located at RA: 18h 26m08.5s, Dec: − 12°56′33″, with spin-down age τ = 1.44 × 10⁴ yr, a spin-down power of Ė = 3.6 × 1036 erg s−1 and a period of P = 0.110 s, situated at a distance of 1.55 kpc (Manchester et al. 2005). Whilst there are some indications for emission from the binary system LS 5039 at E > 32 TeV, this does not reach the 3σ level. It is notable that both HESS J1825–137 and HESS J1826–130 are, however, still present in the excess map above 32 TeV.
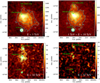 |
Fig. 3 Excess count maps of the HESS J1825–137 region in four different energy bands: E < 1 TeV, 1 TeV < E < 10 TeV, E > 10 TeV, and E > 32 TeV. The size of the source is clearly much reduced at high energies. Other sources within the field of view include the binary LS 5039 and the hard-spectrum source HESS J1826–130. The positions of the pulsars PSR B1823–13 associated with HESS J1825–137 and PSR J1826–1256 (which might be associated with HESS J1826–130) are also shown. Significance contours are shown at 5, 10, and 15σ for maps with energies below 10 TeV, and at 3, 5, and 10σ for maps with energies above 10 TeV. |
4.1 Azimuthal profile
To explore the nebula morphology in more detail, the distribution of emission in the nebula was profiled as a function of azimuthal angle around the pulsar position. The azimuthal angle was measured anti-clockwise around the pulsar from north, and the profile included excess emission out to a radius of 1.6° from the pulsar. Masks were applied to exclude the emission from the other sources in the region. This distribution hints at the existence of a preferred axis for the particle flow into the nebula, with some spread on either side of this. It was found that the azimuthal distribution of γ-ray counts per arcmin2 is well described by an asymmetric Gaussian, as shown in Fig. 4, which was used to find the major axis of the emission. The range of the fit was restricted to fall between two minima of the distribution, which we found using a weighted moving-average approach to be located at 63° and 315°, respectively.
The fitted mean was found to lie at a value of 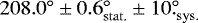 using analysis A, where the systematic error arises from the differences between analysis pipelines. For analysis B, the mean of the asymmetric Gaussian fit was found at an azimuthal angle of
  , well within the errors of the method. This angle was used to define the major axis of the emission that emanates south of the pulsar. The minor axis of the emission was subsequently defined to be perpendicular to this.
The orientation angle of  (measured anti-clockwise from north) found by Aharonian et al. (2006b) using a 2D Gaussian morphological fit agrees within the errors with the major axis found above, corresponding to an orientation angle of
  , taking into account the 180° change of reference.
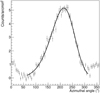 |
Fig. 4 Azimuthal profile of emission around the position of PSR B1823–13 out to a radial distance of 1.6°. The emission profile is well described by an asymmetric Gaussian between the two minima. |
4.2 Slice profiles
Slices were taken from the excess map along the major and minor axes of the emission (208° and 118°) as determined from the azimuthal profiles, with dimensions 3.5° × 0.5°. These slices are shown for analysis A in Fig. 5; the position of the pulsar is indicated by a dashed line. The orientation of the slices is serendipitously away from either of the neighbouring sources such that no masks were applied to these slices. Emission from the γ-ray source HESS J1826–130 may contribute, but it is clearly a minor contribution along the slice width and does not lead to any visible features in either slice.
In the north–south direction, the steepness of the drop in emission towards the north is clearly apparent, whilst the emission towards the south seems to extend farther in analysis A than was previously seen in Aharonian et al. (2006b). Towards the south, the emission profile becomes less steep from around − 0.5° to − 1° offset from the pulsar. This change in slope could be an indication of multiple components to the emission.
Gaussian fits to the excess slices were found to provide a poor fit to the total excess distribution along the slice, although this was improved slightly by an asymmetric Gaussian fit. This is particularly due to the increased steepness of the distribution from the peak of the emission towards the pulsar position. The rms of the distribution along the excess slices were  and
and  along the north–southand east–west directions, respectively, a factor of 1.2–1.3 larger than the Gaussian widths. (The Gaussian widths were
  and
and  along the north–south and east–west directions, respectively, although with an offset from the peak position.) In general, these profiles are consistent with the picture of a pulsar wind that continuously injects particles into the nebula that are then transported preferentially towards the south. The particle population spreads out primarily along this direction; with spreading along the east–west direction (although with a non-Gaussian profile) rather more symmetric.
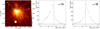 |
Fig. 5 Slices taken along the major and minor axes from the uncorrelated excess map using analysis A, centred on the peak position, with dimensions 3.5° × 0.5°. The location of the pulsar along the slice is indicated by a dashed line, and the emission peak is clearly offset towards the south, with the emission extending out to ~ 1.5° from the pulsar. In contrast, the emission drops off extremely steeply from the emission peak north of the pulsar. South and west are orientated towards lower right ascension values. |
4.3 Determining the peak location
The peak of the nebula emission is found to be at  ,
,  by using the excess slices to determine the location of the peak emission of the nebula in an iterative process as follows. Both slices were always centred at the same position, initially at the pulsar location. The slice profiles were fit with a Gaussian function in a small range (0.5° total) around the maximum; the offset of the fitted mean from the centre of each slice was the shift to the peak. In a first step, we found a shift of 0.20° ± 0.02° of the peak emission from the pulsar position along the north–south axis. After two iterations, there was no significant shift of the peak away from the centre of the slices along either axis. As shown in Fig. 5, the pulsar position is offset from the final peak location by 0.20° along the north–south axis and by − 0.09° along the east–west axis. For comparison, the best-fit position reported in Aharonian et al. (2006b) was
  ,
,  ; the two peak locations are compatible in Right Ascension and slightly offset in Declination, which may be a consequence of the different methods used to describe the morphology.
4.4 Nebula extent
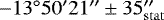
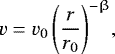
The radial extent of the nebula was measured using the radial profile of the emission in the southern half of the nebula (south of the minor axis along 118° as defined in Sect. 4.1), adopting an approach similar to that used in H.E.S.S. Collaboration (2018c). A mask of 0.25° radius was applied over LS 5039 (HESS J1826–148) to avoid contamination of the profile of the excess nebula emission, and the radial profile was taken from the current pulsar position. Rather than an immediate drop in emission away from the pulsar, the peak emission is roughly flat out to ~0.2° radial distance, as shown in Fig. 6. The extent of the emission was characterised by fitting a polynomial to the radial profile, in the range 0.2°−2.4°, according to
 (1)
(1)
such that with increasing r, the emission decreases out to a distance r0 at which it approaches a constant value, c. Whilst the parameter a simply provides the overall normalisation, to avoid a dependency on the order of the polynomial n, the radius at which the fitted function dropped to a fixed fraction of the peak value (1∕e, referred to as r1∕e) was used as a measure of the nebula extent and was found to be robust against the value of n, with n = 3 chosen arbitrarily. A moving-average approach along the excess emission profile was used to find the radial offset and value of the peak of the emission (as in Fig. 6), and the radial profile fitted from the peak out to large radii (~ 2.4°). The peak of the emission was found to vary with energy between 0° and 0.2° radius from the pulsar, shifting towards the pulsar at higher energies. The distance from the pulsar at which the fitted function evaluated to 1∕e of the peak value was found to be not strongly dependent on the functional form used. Results obtained using an exponential function to describe the radial profile of the emission were consistent with those obtained using the polynomial Eq. (1).
The characteristic size of the nebula over the full energy range was found to be  from analysis A (
 from analysis B), which, when we adopt a distance of 4 kpc to the nebula, corresponds to a physical extent of 46 pc. Over the full energy range, parameters a and c of Eq. (1) were (− 3.5 ± 0.2) arcmin−2 deg−n and (1.14 ± 0.08) arcmin−2 for analysis A ((− 1.0 ± 0.1) arcmin−2 deg−n and (− 0.13 ± 0.06) arcmin−2 for analysis B). On the northern side, when we adopt the same approach to characterise the extent, but with a mask of 0.4° radius over HESS J1826–130, the characteristic size of the nebula is found to be significantly smaller,
  from analysis A (
 from analysis B), but still extended, as suggested both by the excess slices in Fig. 5 and the significance contours in Fig. 3.
 |
Fig. 6 Semi-circular region (left panel), with the pulsar at the apex and a mask applied over LS 5039, was extracted from the excess maps to form a radial profile of the emission (right panel), shown here for the full energy range with analysis A. A mask was also applied over HESS J1826–130, which is particularly relevant for measuring the northern extent. The radial profile was fitted by a polynomial (Eq. (1)) to characterise the extent of the emission. Dashed and dotted lines mark the radial distance at which the emission drops to 1∕e and 10% of the peak value, respectively. |
5 Nebulaextent – implications for particle transport
Given the known energy-dependent morphology of the nebula, it is instructive to attempt to quantify this change in extent with energy morerigorously. To this end, we applied the extent-measuring approach outlined in Sect. 4.4 to radial profiles of the nebula emission extracted from independent energy bands. The high brightness and long exposure on the nebula enabled us to split the data into nine energy bands, six of which were common to analyses A and B (see Table 3). These bands were chosen such that each bound was twice the energy of the previous, with the highest and lowest bands for each analysis still containing statistically significant emission. The long exposure of analysis A enables a measurement at energies above 32 TeV to be included, whereas for the lower exposure analysis B that includes CT5, this was found not to be significant, and the highest energy band was kept at E > 16 TeV. Nevertheless, the lower energy threshold of analysis B, provided by CT5, enables the lowest energy band to be split into two: 125 < E < 250 GeV and E < 125 GeV. For analysis A, the lowest energy band is set at E < 250 GeV.
Measurements of the nebula extent were made in each energy range as listed in Table 3. We interpreted the extent-energy relationin terms of particle transport mechanisms within an energy range where transport mechanisms could plausibly dominate this dependence.
If energy-dependent diffusion is the dominating transport mechanism and no cooling losses occur (which may be assumed for young PWNe), then the nebula would be expected to increase in size with energy if all particles were injected at a single instance in time as a result of the energy dependence of the diffusion coefficient. However, where cooling losses play a role, the nebula would become more compact towards higher energies. A maximum extent of the nebula may be expected to occur at the γ-ray energy that corresponds to the energy of the parent particle population at which the cooling time becomes equal to the age of the nebula (Atoyan et al. 1995).
Advective transport mechanisms may also influence the transport. Several studies have shown that advective processes may dominate in the inner regions of pulsar wind nebulae, although both diffusion and advection are likely to contribute to the overall transport (Van Etten & Romani 2011; Tang & Chevalier 2012; Porth et al. 2016; Khangulyan et al. 2018).
This variation of extent with energy, shown in Fig. 7, may be described by a simple power-law relation within the energy range over which the nebula extent is expected to be dominated by particle cooling. This provides an insight into the particle transport processes within the nebula.
Extent measurements as a function of energy for analyses A and B, with statistical and systematic errors.
5.1 Determining the fit range
The following discussion of the energy dependence of the size of a PWN assumes that the electron population is cooled, with γ-rays produced by IC scattering, where  can be used to relate the γ-ray and electron energies. Within the Thomson regime, k = 2, whereas within the Klein-Nishina (KN) regime, Eγ ≈ Ee (Blumenthal & Gould 1970). Simulations of a cooling, radiating, and diffusing electron population with the EDGE code (Hahn 2015; Lopez-Coto et al. 2017) were used to validate the analytic estimates applied here and in the following in two models of the Galactic radiation fields (Porter et al. 2017; Popescu et al. 2017).
The radiation field model of Popescu et al. (2017) for the Galactic location of HESS J1825-137 can be approximated by four black-body components; the cosmic microwave background (CMB) with a temperature T of 2.7 K and an energy density ω of 0.25 eV cm−3; the far-infrared (FIR, dust, T ~ 40 K, ω ~ 1 eV cm−3); near-infrared (NIR, T ~ 500 K, ω ~ 0.4 eV cm−3), and visible light (VIS, T ~ 3500 K, ω ~ 1.9 eV cm−3). IC scattering in the TeV energy range was found to be dominated by the contribution from the FIR radiation field for both models. EDGE was used to generate radial profiles for the nebula extent as a function of energy for the two bounding cases in the diffusion scenario. A magnetic field strength of ~ 5 μG was adoptedfor the simulated points shown in Fig. 7, which include KN effects. No significant difference was found between the two Galactic radiation field models (Porter et al. 2017; Popescu et al. 2017) in the resulting simulated nebula extent variation.
The lower bound of the fit corresponds to the apparent turn-over in Fig. 7 from around 0.7 TeV, which would correspond to a cooling break energy in the electron population of around 4 TeV. This would require a magnetic field of ~ 12 μG, which is plausible for the earlier stages of nebula evolution, although X-ray measurements suggest a current magnetic field strength within the nebula closer to ~5 μG (Uchiyama et al. 2009).
The upper bound on the fit range is given by the transition from FIR- to CMB-dominated IC scattering (see also Sect. 7). Using recent models of the interstellar radiation fields (Porter et al. 2017; Popescu et al. 2017), we found that the  relation does not remain constant over the fitted energy range. IC scattering of electrons off the FIR radiation field occurs in the transition region between the Thomson and KN regimes.
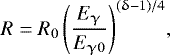
A power-law fit to the data was made, as shown in Fig. 7, between these two bounds, and the relation  was adopted. The conclusions were unchanged, regardless of whether the highest energy point was included or omitted in the fit. The regions of this extent against energy plot that would be compatible with diffusion or advection are indicated in Fig. 7 with shaded areas, which are arbitrarily normalised to the lowest energy point within the fitted range. These two scenarios are discussed in the following sections, and the validity of our assumptions is discussed in Sect. 8.
5.2 Diffusion
Diffusive processes may be expected to dominate the particle transport once the pressure within the nebula has reduced to that of the surrounding ISM and the particles are no longer strictly confined within the nebula and begin to diffuse into the surrounding medium. Under the assumption of diffusion and cooling losses, a power-law fit to Fig. 7 at energies above the maximum extent directly yields the diffusion index. Taking the radial extent R to vary with the diffusion coefficient D(E) and assuming that the cooling timescale τ is much less than the age of the nebula, we obtain

When we assume that cooling losses for synchrotron and IC scattering vary with energy as τ ∝ 1∕Ee, this yields a dependency of the nebula radius on the electron energy as  . Given that the energy of γ-ray photons, Eγ, produced via IC-scattering interactions, varies with the electron energy, Ee, as
  in the Thomson regime, the relation between R and Eγ applicable to Fig. 7 is
 (4)
(4)
where R0 is the normalisation radius at E0 = 1 TeV. Hence, from the fitted index α of the slope in Fig. 7 (where R ∝ Eα), the energy dependence of the diffusion coefficient is obtained directly as δ = 4α + 1. The diffusion index δ is expected to lie in the range 0.3−0.6, with extremes of energy-independent diffusion at δ = 0, and of Bohm diffusion at δ = 1. The gradient of the fit in Fig. 7 directly yields the diffusion index, whilst the constant relates to the radius R0.
The fitted and derived parameters are given in Table 4. The values of α from − 0.25 to 0 and from − 0.5 to 0 are compatible with diffusion in the Thomson and KN cases, respectively. Negative values of the diffusion index δ, as obtained forthe Thomson case, are incompatible with the variation in spatial extent, and the photon energy is due to a diffusion-dominated particle transport scenario.
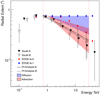 |
Fig. 7 Variation of radial extent with energy. Shaded regions indicate compatible transport scenarios for IC scattering in the Thomson regime with |


5.3 Advection
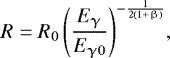
Bulk particle flow may, however, dominate the transport if the particle pressure within the nebula remains greater than the surrounding ISM pressure out to large distances, still with significant confinement. If advection is adopted as the dominant particle transport mechanism instead of diffusion, then a relation between the nebula radius R and γ-ray energy Eγ analogous to Eq. (4) can be obtained. During the particle outflow through the nebula, it is required that mass continuity is satisfied and that the flow follows a steady-state density profile  , such that the flow must preserve
 (5)
(5)
where A(r) is the area through which the particles flow, and the radial dependence of ρ(r), A(r), and v(r) is unknown. Assuming that the flow density ρ is independent of the radius, then  . Therefore, in the case of spherical symmetry, the area through which the flow travels is A(r) ∝ r2, and the flow velocity v(r) ∝ r−2. As the flow velocity is expected to vary with radius r due to pressure on the nebula from the ambient medium, this can be parameterised as
 (6)
(6)
where r0 and v0 are the initial radius and velocity of the nebula, respectively, and β describes the radial dependency required in order to yield a constant density profile. In extreme cases, β can take on values of 0 (for constant velocity expansion) or 2 in the case of constant density. By separation of variables and integrating over all radii and up to the cooling time, we obtain the proportionality relation  . Accounting for the dependance of the γ-ray energy on the electron energy,
  for the Thomson regime, this relation becomes
 (7)
(7)
where R0 is the normalisation radius at E0 = 1 TeV, such that the gradient of the power-law fit to Fig. 7 yields a measure of the radial dependency of  . The derived β obtained for the Thomson and KN cases is given in Table 4. Both cases indicate a significant dependence beyond the constant velocity case, with values of α from − 0.5 to − 1∕6 and from − 1 to − 1∕3 compatible with advection in the Thomson and KN cases, respectively. Under the Thomson assumption, a significant dependence beyond the constant velocity case is assumed, whilst for the pure KN case, a relation closer to a spherically expanding flow is found.
6 Spatially resolved spectral map
Given the considerable size of the nebula, which is much larger than the H.E.S.S. PSF of 0.064° (analysis A), it is appropriate to use the rich amount of information contained in this dataset through more detailed spectral analysis, rather than reducing studies to focus on the pulsar, the peak of the emission, or a primary direction. To this end, a grid of 0.26° × 0.26° boxes for which the size used in Aharonian et al. (2006b) was adopted, was defined based on the 5σ significance contour of the nebula emission, from which a spectral analysis was performed for each box. Serving to underline the enormous size of this nebula compared with other similar TeV sources, a total of 38 such boxes were identified, the first 12 of which are defined to coincide with those used in Aharonian et al. (2006b). Because of increased levels of background systematics encountered in the spectra at low energies, which can bias the spectral power-law fit, particularly towards the outer regions of the nebula, a higher energy threshold of ~ 300 GeV was adopted for this analysis (but otherwise, the same event selection cuts were used as before). For the majority of the spectral boxes, the flux was not sufficient for a reliable fit to curved spectral models, but for six of the innermost regions (boxes 4–9), curved models were preferred over a power-law fit at the 4σ level. In order to avoid a bias in the resulting spectral index, the spectra from each box were fitted with a power law within a limited range of 0.3−5 TeV. Fitting a power law to the entire energy range without an upper limit led to a systematic shift of 0.1 in spectral index, which biased the results towards reporting softer indices. Therefore, the fitted range was limited to 5 TeV, which was chosen such that this upper limit falls at an energy below all of the statistically significant cut-off energies. The integrated flux above 1 TeV was found to be consistent within errors of the integrated flux from 1− 5 TeV.
The results of a power-law fit to each box are shown in Fig. 8, where an additional five boxes covering HESS J1826–130 are shown for completeness. Significance contours at 5, 10, 30, and 50σ are shown, using in this case a larger correlation radius of 0.1°, that is, about half a box width, in order to better correspond to the resolution scale provided by the size of the spectral boxes.
By eye, a clear trend of softening of the spectral index with increasing distance from PSR B1823–13 (located at the centre of box 9) is visible. Towards HESS J1826–130, the spectral index can be seen to remain comparatively hard with respect to the rest of the nebula, with similar spectral indices across the boundary of the two sources on the resolution scale of the spectral regions defined. Over the HESS J1826–130 region (boxes I–V), the level of contamination of HESS J1826–130 by HESS J1825–137 may vary (a detailed study of the HESS J1826–130 region will be made in a forthcoming publication).
Moreover, the spectral index appears to remain harder along the major axis of the nebula. The power-law index does not only soften with distance along the major axis, but also with distance away from the axis on either side. The spectral properties of the nebula become softer towards the 5σ contour in all directions away from the neighbouring source HESS J1826–130.
The overall trend of spectral variation throughout the nebula is shown in Fig. 9, where the variation of spectral index and flux from 1 to 5 TeV (from a power-law fit) with distance and with each other is investigated. Spectral index and distance are strongly positively correlated, with a correlation coefficient of 0.89± 0.06stat. ± 0.17sys.. The flux from 1 to 5 TeV was found to be anti-correlated with both distance and spectral index, with correlation coefficients of − 0.83 ± 0.03stat. ± 0.01sys. and − 0.92 ± 0.03stat. ± 0.4sys., respectively (spectra for each of the 38 spectral boxes are available as part of the supplementary information).
Although it might be considered to add further regions to this grid, we found that when a 5σ significance contour would effectively divide a spectral box into two, a significant spectrum could not be obtained by either the primary analysis or the independent cross-check analysis; such regions were therefore not used in Figs. 8 and 9. All of the remaining spectral regions, with the majority of the area lying within the 5σ significance contours, have a significance greater than 5σ and can therefore be confidently included as contributing to the nebula emission. We note, however, that the systematic errors increase particularly towards the outer edges of the nebula (e.g. regions a–d and w–z, see Table 5). This corresponds to cases where the significance of the spectral box was close to 5σ in either the primary analysis or the independent cross-check analysis and increased background systematics are likely to contribute. The 38 0.26°× 0.26° boxes correspond to a total area of 2.57 square degrees, which provides a lower limit of the projected area of HESS J1825–137 on the sky.
Of particular interest are boxes a and d; these two regions lie comfortably within the 5σ significance contour, with spectral significances of 9σ and 6σ, respectively.The centres of both regions lie at distances in excess of 100 pc, as shown in Table 5 (assuming a 4 kpc distance), the largest distances of a spectral box from the pulsar, closely followed by the 98 pc distance to regions b and o. This means that HESS J1825–137 is one of the largest, if not the largest, γ-ray PWN(e) currently known in terms of its intrinsic size. This feature merits a dedicated study (Khangulyan et al. 2018).
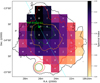 |
Fig. 8 Map of HESS J1825–137 showing the location and fitted power-law index of each of the 38 boxes used in independentspectral analyses. Boxes 1–12 are labelled to match the results in Aharonian et al. (2006b), whilst boxes a–z are new to this analysis. The fitted major axis used for the extent measurements is overlaid and the position of the pulsar (located at the centre of box 9) indicated. Significance contours shown correspond to 5, 10, 30, and 50σ, respectively. LS 5039 can be identified as a high-significance point source. Five spectral boxes (I–V) covering the HESS J1826–130 region are also shown. |
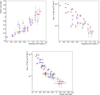 |
Fig. 9 Cooling of electrons within the pulsar wind nebula HESS J1825-137. Trend of fitted spectral power-law index with distance, flux from 1 to 5 TeV with distance, and of flux from 1 to 5 TeV with a power-law index from the power-law fits to the spectral boxes depicted in Fig. 8. Correlation coefficients of 0.89 ± 0.06stat. ± 0.17sys., − 0.83 ± 0.03stat. ± 0.01sys., and − 0.92 ± 0.03stat. ± 0.4sys. were found. |
Spectral parameters from a power-law fit to each of the 38 boxes independently.
7 Total nebula flux
The large size of HESS J1825–137, together with its complex morphology and the presence of multiple sources in the surrounding region mean that it is not effective to define (with respect to the pointing position of the telescopes) background extraction regions that are spatially symmetric with respect to the source region. In order to determine an overall spectrum for the entire nebula, we therefore combined the spectra from the individual boxes defined above. Similar approaches have previously been adopted by H.E.S.S., such as that used in H.E.S.S. Collaboration (2018c). However, in the case of HESS J1825–137, we encountered several problems with this approach. For example, many of the regions in the outer reaches of the nebula have soft spectra (power-law index ≳ 2.5) and only few high-energy events, E ≳ 20 TeV, such that despite the known presence of significant emission above 20 TeV close to the pulsar, the total spectrum flux over a much larger area is poorly estimated at E ≳ 20 TeV due to the increased statistical noise. To circumvent this, we gradually ceased to combine all boxes into the total spectrum, using a criterion based on the contribution of each region to the total flux, as described in Appendix A below. By combining regions throughout the nebula, we obtained the total flux, but we did not perform a single spectral fit to the spectrum.
For strongly energy-dependent sources, a simple spectral fit to the entire nebula that treats the nebula as a single-zone particle population is equivalent to taking the average of the spectral indices throughout the nebula, which may not be particularly informative, as Fig. 9 demonstrates. To this end, we do not interpret the total flux from the nebula in terms of any particular spectral model; rather, we present a total integrated flux of the nebula emission to interpret the overall source strength.
The resulting spectral flux obtained for the nebula from the summation of the 38 independent 0.26°× 0.26° spectral boxes is shown in Fig. 10. For illustration, the HESS J1825–137 spectrum obtained from Fermi-LAT (Grondin et al. 2011) is also shown, although we recall that the region from which this spectrum is obtained, based on a morphological symmetric Gaussian fit template to the Fermi data, does not fully correspond to the same spatial region. The 2011 analysis and the 3FGL (the third LAT Catalogue, 20 MeV to 300 GeV, Acero et al. 2015) both use a Gaussian with σ = 0.56° as the spatial template, whereas the 3FHL (the third LAT High-Energy Catalogue, 10 GeV to 2 TeV, Ajello et al. 2017) uses a Gaussian with σ = 0.75°, which is consistent with the Fermi Galactic Extended Source catalogue best-fit Gaussian with σ = 0.79 ± 0.04 (Ackermann et al. 2017). Whilst these templates are only approximations to the source morphology, in Fig. 10 the IC peak may be inferred to occur at around 200 GeV.
The total flux above 300 GeV was found to be (6.07 ± 0.13stat ± 0.07sys) × 10−11 cm−2 s−1, corresponding to ~54% of the flux of the Crab nebula. Above 1 TeV, a flux of (1.12 ± 0.03stat ± 0.25sys) × 10−11 cm−2 s−1 was obtained, such that the proportion relative to the Crab nebula increases slightly to ~ 64% of the Crab nebula flux. The source remains strong at ~61% of the Crab nebula flux above 10 TeV. It is impressive that the γ-ray flux is so strong given that the distance to HESS J1825–137 is approximately twice that of the Crab nebula (at 2 kpc), despite (or perhaps because of) the significantly older age of the system. Interestingly, as part of the second HAWC catalogue, it was found that the confused source associated with the combined emission from the region, 2HWC J1825–134, is brighter than the Crab nebula at 7 TeV (Abeysekara et al. 2017). This point is included in Fig. 10 and is compatible within the HAWC systematic errors of the total nebula spectrum from HESS J1825–137.
The total nebula spectrum could be well described by a simple model of IC scattering including CMB, FIR, IR, and VIS radiation fields in a parameterisation of Popescu et al. (2017) using the Naima modelling package (Zabalza 2015). An additional UV component was included for a more accurate parameterisation of the Galactic radiation field, but the contribution of this component to the total IC scattering was found to be negligible: it peaks below the scale of Fig. 10. The contribution from the FIR was found to dominate most of the energy range, with a transition to CMB dominance at a few tens of TeV. The electron spectrum could be described by a broken power law with low-energy index Γ1 = 1.4 ± 0.1, a high-energy index of Γ2 = 3.25 ± 0.02, and a break energy of Eb = 0.9 ± 0.1 TeV for a total energy in electrons of ~5.5 × 1048 erg. This phenomenological electron spectrum has no high-energy cut-off; the spectral curvature seen at the highest energies can therefore be entirely attributed to Klein-Nishina effects.
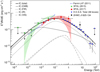 |
Fig. 10 Spectral energy distribution of HESS J1825–137 showing the total combined H.E.S.S. energy flux with statistical error bars, as determined with the method outlined in Sect. A. The Fermi-LAT spectral fit from Grondin et al. (2011) is also shown, together with spectra from the 3FGL and 3FHL catalogues (Acero et al. 2015; Ajello et al. 2017), both of which were best fit by a log-parabola spectral model. A plausible IC emission model with multiple contributing radiation fields is shown, using the parameterisation of the Popescu et al. (2017) radiation model and the Naima modelling package (Zabalza 2015). The emission is mostly dominated by the FIR field; the CMB becomes dominant at a few tens of TeV and below ~ 10 GeV. |
8 Discussion
HESS J1825–137 extends farther than has previously been seen at TeV energies (Aharonian et al. 2006b) because our analysis benefits from a better sensitivity to large areas of weaker, lower energy emission. In agreement with previous findings, the spectral index of the emission increases with increasing distance from the pulsar as a result of the cooling of the electrons over time. This causes the index to become softer and the high-energy flux to decrease.
For the circular regions with radii of 0.8° and 0.4°, curved spectral models are preferred over a pure power-law fit, which indicates the inherent cooling of particles within the nebula and potentially the presence of multiple particle populations of different ages along the line of sight. In the case of a power law with exponential cut-off fit, the cut-off energy provides some indication of the maximum particle energies reached (typically an order of magnitude higher than the γ-ray energy). A statistically significant spectral cut-off could be explained by a cut-off in the parent particle spectrum that arises from the acceleration and energy-loss mechanisms. Spatial variation with energy, or equivalently, spectral variation with position within the nebula, indicates that the nebula emission detected from Earth is the summation of the contributions from multiple particle populations with different spectral properties. Although the transitions between such populations may be smooth, Van Etten & Romani (2011) showed that a multi-zone modelling approach is more successful in reproducing the properties of the present-day nebula.
The major axis to the emission from the nebula was found to lie at 208° counter clockwise from north, almost perpendicular to (72° away from) the projected trajectory of the pulsar across the sky from its extrapolated birth position. If the direction of bulk particle motion were aligned with the particle wind, it would be expected that the emission were aligned with (but be opposite to) the proper motion in the case of young PWNe (Kaplan et al. 2008). Therefore, the non-alignment provides a strong indication that additional effects influence the evolution, such as the conditions of the ambient medium. The steep drop observed towards the north might be due to a combination of physical effects (such as asymmetric crushing by a reverse shock from the progenitor supernova) and projection effects, especially as the component of the pulsar velocity along the line of sight is not known.
A method of characterising the nebula extent was established and found the characteristic extent (r1∕e) a factor of 1.6 ± 0.1 larger towards the south than on the northern side of the nebula. Although the northern emission was also seen to decrease towards the highest energies, the variation in extent with energy was found to be less pronounced than in the southern direction and is compatible with no significant change.
Considering the changing nebula extent with energy, we fit by assuming a relationship of  as for the Thomson regime and found that a purely diffusive particle transport model was disfavoured, with some significant contributionfrom advective transport mechanisms likely. In this case, the motion can be described as a radial convective flow with diffusion occurring in directions perpendicular to this flow. We find that the bulk flow can be described by a velocity profile v(r)∝ r−0.7±0.2stat±0.3sys, under the assumption of constant flow density, although a variable density profile is not excluded.
This finding is in agreement with several previous models of this source. The suggestion that the nebula is particle dominated, with a particle pressure that is still significant against the surrounding ISM pressure, was made by de Jager & Djannati-Ataï (2009). This would imply that advective processes may still be playing a significant role in the nebula morphology. The velocity profile obtained from the H.E.S.S. data is in good agreement with the v(r)∝ r−0.5 velocity profile arising from the model of Van Etten & Romani (2011), whose best-fit model incorporated both advection and diffusive processes to describe the transport. In Sect. 5, we considered the Thomson regime dependency of  and the pure KN regime relation Eγ ~ Ee. Although IC scattering from the CMB radiation field is well within the Thomson regime, the total energy density also comprises significant contributions from dust (FIR), IR, and starlight (VIS) radiation fields. The dominant contributionto the IC scattering comes from the FIR field, for which KN effects are not negligible. Simulations using the EDGE (Lopez-Coto et al. 2017; Hahn 2015) modelling package indicate that including KN effects and a realistic model of the radiation fields leads to energy-dependent variations in the relation between Ee and Eγ. For the results shown in Fig. 7, a magnetic field strength of 5 μG was adopted; for the observed reduction in nebula size at lower energies, a magnetic field strength of ~ 12 μG would be necessary, which is not supported by X-ray measurements (Uchiyama et al. 2009), however. Fully accounting for all effects, that is, deriving γ-ray spectra from the full spatial and spectral convolution of electron spectra and the exact radiation cross-sections, as well as including the line-of-sight integration, would require more extensive modelling that is beyond the scope of this paper.
Throughout, we have assumed a characteristic age of 21 kyr, but if the pulsar has a braking index lower than 3, as suggested by several models, the estimated age of the nebula would increase. One example would be to decrease the braking index of the nebula to n = 2 or lower to account for the large size of the nebula, thereby doubling the estimated age to ~ 40 kyr, as suggested by Van Etten & Romani (2011). This would correspondingly alter the timescale for cooling losses, and the lower bound of the fit of the extent as a function of energy would be halved. This would introduce one extra point into the fit, and would change the fitted slope to become slightly less steep, which would yield a velocity profile for advection closer to v(r) ∝ r−1 and a diffusion index of δ ~ 0. Following this scenario, the slope lies on the edge of the overlap region that is compatible with diffusion and advection as dominant transport processes. Whilst in this case energy-independent diffusion cannot be ruled out, it remains likely that advective processes would continue to play a major role.
The nebula appears to shrink towards lower energies (below 700 GeV), although at around 200 GeV, measurements approach the H.E.S.S. energy threshold and background systematics become more influential, which is reflected by the increased uncertainties at these lowest energies. Analysis B is more sensitive in this region because CT5 is included. This yields an additional point at energies below ~ 125 GeV.
At energies below 700 GeV, the lifetime of the particles against cooling losses is longer than the 21 kyr age of the nebula, such that the size may be expected to increase with increasing energy, with a maximum size occurring at ~700 GeV (Atoyan et al. 1995). Energy-dependent extent measurements that cover energies below 700 GeV and extend below the H.E.S.S. energy range by complementary facilities would provide further insights into the dominant processes affecting HESS J1825–137, although no dramatic energy dependence of the morphology within this energy range was reported as part of the Fermi-LAT results (Grondin et al. 2011).
The overall extent of the nebula was found to reach an intrinsic diameter of ~ 100 pc (assuming a 4 kpc distance) as measured to the outermost spectral boxes, rendering HESS J1825–137 an exceptionally large PWN (H.E.S.S. Collaboration 2018b). The Hα ridge identified in Voisin et al. (2016) and Stupar et al. (2008) implies a supernova size of ~ 120 pc radius. Khangulyan et al. (2018) offer an explanation for the anomalously large extent of the nebula through significant energy injection by the pulsar at early times, such that the pulsar contribution dominates the kinetic energy of the supernova ejecta, invoking an initial spin-down period P0 ~ 1 ms with a surrounding density of n ≳ 1 cm−3 rather than the alternative of requiring an extremely low-density ambient medium a priori (n ≤ 10−2 cm−3) in the case of the Sedov solution. The PWN expansion occurs preferentially into low-density regions, which is supported by the observationsof multiple molecular clouds in the region, away from the peak of the TeV emission.
This scenario is supported by the best-fit model of Van Etten & Romani (2011), which incorporates a velocity profile, magnetic field profile, and diffusion and adopts an initial spin period of P0 ~ 13 ms with a braking index of n = 1.9 to provide adequate energy to power the nebula. In all cases, although advection is responsible for bulk flow within the nebula, a significant diffusive contribution is still expected, especially towards the outer reaches of the nebula and in order to account for the nebula breadth, rather than only the extent along the major axis. A diffusive scenario is compatible with our results; a 100 pc extent that is achieved within an approximately 21 kyr lifetime implies a diffusion coefficient of D0 ~ 1.4 × 1029 cm2 s−1, which is within the expected range for ISM diffusion at 1 TeV (Maurin et al. 2001). The flow velocity implied by this nebula size and assumed age is typically ~ 0.01c.
The spatially resolved spectral map of the nebula further illustrates the variation not only as a function of distance from the pulsar, but also more generally as a function of location within the nebula. The (anti-)correlation between the fitted spectral parameters (power-law index, flux from 1–5 TeV) and distance from the pulsar is high. However, the distance is always the projected distance; therefore the spectral properties are given as obtained from the superposition of emission along the line of sight. It is expected that multiple particle populations with differing ages and spectral properties are present in each region.
The total spectrum reduces the information that is available about the nebula to the total flux. Within the HGPS, it was found that the morphological description of the nebula was improved by using three Gaussian components rather than a single Gaussian to model the total VHE γ-ray emission, which is another indication that the nebula composition is very complex (H.E.S.S. Collaboration 2018a). As Fig. 9 suggests, new insights are more likely to be gained by approaches that incorporate multiple particle populations, such as that of Van Etten & Romani (2011).
The occurrence of the IC peak in Fig. 10 at around 100 GeV would correspond to a cooling of the electron spectrum at particle energies of around 1 TeV, in agreement with the IC model we showed. The contribution from the near-IR and optical photon fields (VIS) through background starlight to the total IC scattering was verified by a simple model to be negligible and KN suppressed (Zabalza 2015). The effects of KN losses on the total spectrum (Fig. 10) were found to be small, with a total energy in electrons of ~ 5.5 × 1048 erg. The total nebula γ-ray spectrum exhibits some spectral curvature at ~10 TeV and can be well described by a broken power-law electron spectrum without a spectral cut-off. This indicates that this curvature can be fully accounted for by KN effects.
The total γ-ray luminosity above 300 GeV that we obtained from the spectrum shown in Fig. 10 is Lγ = 3.1 × 1035 erg s−1 assuming a 4 kpc distance. For the nebula volume, it was assumed that the emission corresponding to each spectral box occupies a line-of-sight depth equivalent to 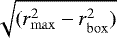 , where rmax is the distance to the outermost region and rbox is the distance of the centre of that box from the pulsar, such that the total volume is given by the sum of the projected box areas multiplied by the assumed depths. The total energy in electrons and total nebula volume yields an energy density throughout the whole nebula of ~0.1 eV cm−3.
For comparison, the innermost region of the nebula, box 9 in Fig. 8 centred on the pulsar, has a γ-ray luminosity above the threshold of Lγ = 2.0 × 1034 erg s−1. A total energy in electrons of  is obtained for box 9 using the same radiation field model as shown in Fig. 10 and fitting a broken power-law electron spectrum with the low index fixed to Γ1 = 1.4, that is, to the nebula value. As an edge case, we consider box a (at 106 pc from the pulsar) with a γ-ray luminosity above threshold of Lγ ≈ 6 × 1033 erg s−1 and total energy in electrons of
  . With fixed Γ1, it was found that the high index Γ2 was considerably softer and break energy lower for box a than for box 9, as expected for an electron population that cools with age and increasing distance from the pulsar.
This approximation for the line-of-sight depth to obtain the corresponding box volumes yields energy densities of ~ 0.06 eV cm−3 for box 9 and ~1 eV cm−3 for box a, a consequence of the assumption that the nebula expansion along the line-of-sight depth is far greater closer to the pulsar than in the outer reaches of the nebula. Nevertheless, this is only an approximation to the average value for each box. The true energy density is likely to vary within the nebula along the line of sight.
HESS J1825–137 serves as the archetypal example of a pulsar wind nebula with strong energy-dependent morphological properties, but it remains one of only a few known examples. Whether this is due to purely a fortuitous observation angle and to the age of the system, or if it is also influenced by the chance location and corresponding ambient conditions remains to be determined. Certainly, the evolution and history of the nebula play a significant role in determining the properties that are currently observed.
As demonstrated here, simple assumptions already lead to insights into the dominant particle transport processes. Simple particle population models including γ-ray data in conjunction with X-ray data can also lead to insights into the variation in magnetic field and particle energy density throughout the nebula, although caveats are associated with this approach. The physical extent of the nebula along the line of sight may be greater for the γ-ray nebula (less energetic electrons that undergo IC scattering) than for the X-ray nebula (more energetic electrons produce synchrotron radiation). When we assume that the physical extent of the nebula is the same for the X-ray and γ-ray data, the resulting magnetic field strengths are likely to be somewhat lower than expected, as an average field strength over the larger volume (occupied by the less energetic electrons that produce γ-ray emission) is obtained. Multi-zone modelling approaches may be able to overcome these difficulties by incorporating multiple zones that are superimposed along the line of sight.
The reported centroid of the HAWC emission 2HWC J1825–134 is closer to the previously reported location of HESS J1826–130 than to HESS J1825–137. This leads to an association by HAWC with the former source. However, in practice it is expected that the centroid of emission from HESS J1825–137 would appear farther north (towards the pulsar) than the H.E.S.S. peak because (i) the hardest spectra reported from H.E.S.S. for the source are those closest to the pulsar, and (ii) the energy threshold of HAWC is higher (~ 1−10 TeV; Abeysekara et al. 2017). By comparing our results to the HAWC catalogue, we find that the sum of the flux from the three H.E.S.S. sources in the region amounts to about two-thirds of the flux from the extended analysis of 2HWC J1825–134 (reported for a 0.9° region at 7 TeV) shown in Fig. 10, although the total flux from HESS J1825–137 alone is still compatible within the 50 % systematic error on the flux reported by HAWC (Aharonian et al. 2006c; Angüner et al. 2017).
Future observations of HESS J1825–137 with the forthcoming Cherenkov Telescope Array (CTA) could further our understanding of the physical processes within PWNe (Acharya et al. 2013; de Oña-Wilhelmi et al. 2013). In particular, the increased field of view will help to reduce background systematics that currently affect the outer regions, whilst the improved angular resolution will help to distinguish the multiple sources in the region and enable further investigations of the spectral variationthroughout the nebula, which is hinted at in the comparative spread of flux points in Fig. 9. Additionally, the wider energy range that becomes available with three telescope sizes will enable exploration of the extent of diffuse low-energy emission and the statistics of the innermost high-energy emission. With increased energy resolution, we can look forward to the unambiguous detection with CTA of energy-dependent morphology in multiple PWNe. As HESS J1825–137 is also one of the strongest Galactic TeV sources, the first data on the nebula with CTA may be anticipated as part of the first observations of the Galactic plane. Undoubtedly, this source still has much to offer as the TeV γ-ray field continues to make technical advancements.
Acknowledgements
The support of the Namibian authorities and of the University of Namibia in facilitating the construction and operation of H.E.S.S. is gratefully acknowledged, as is the support by the German Ministry for Education and Research (BMBF), the Max Planck Society, the German Research Foundation (DFG), the Helmholtz Association, the Alexander von Humboldt Foundation, the French Ministry of Higher Education, Research and Innovation, the Centre National de la Recherche Scientifique (CNRS/IN2P3 and CNRS/INSU), the Commissariat à l’énergie atomique et aux énergies alternatives (CEA), the UK Science and Technology Facilities Council (STFC), the Knut and Alice Wallenberg Foundation, the National Science Centre, Poland grant no. 2016/22/M/ST9/00382, the South African Department of Science and Technology and National Research Foundation, the University of Namibia, the National Commission on Research, Science & Technology of Namibia (NCRST), the Austrian Federal Ministry of Education, Science and Research and the Austrian Science Fund (FWF), the Australian Research Council (ARC), the Japan Society for the Promotion of Science and by the University of Amsterdam. We appreciate the excellent work of the technical support staff in Berlin, Zeuthen, Heidelberg, Palaiseau, Paris, Saclay, Tübingen and in Namibia in the construction and operation of the equipment. This work benefited from services provided by the H.E.S.S. Virtual Organisation, supported by the national resource providers of the EGI Federation.
Appendix A: Method of combining spectra
In order to determine the total spectrum, the flux was combined from the 38 box-shaped spectral extraction regions as follows. The independent spectrum for each box was determined first using fixed energy binning.
The total flux Φn for each energy bin n was found by summing the flux overall boxes i, determined as follows. The flux expectation, ϕi,n, is calculatedfrom the fitted power law for each box:
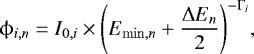 (A.1)
(A.1)
where I0,i is the flux normalisation at 1 TeV for box i, Emin,n the minimum energy of the bin n and Γi the fitted power-law index.
The expected flux was normalised by the ratio of the excess counts measured (Excessi,n) to the expected number of excess counts (ExpExcessi,n), given by
 (A.2)
(A.2)
for an effective area Ai, exposure time ti, and bin width dEi for each energy bin n and each box i. These parameters are given as a result of the spectral analysis of each box.
The error on the total flux was obtained by combining the statistical uncertainties that are due to the number of ON and OFF events (σ(NON,i,n) and σ(NOFF,i,n)) separately, assuming that NON and NOFF follow a normal distribution. Errors on the number of counts in individual bins were estimated as 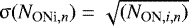 , and analogously for the NOFF.
Assuming that the ON errors are fully uncorrelated between spectral boxes, these error terms are summed in quadrature for each energy bin over all boxes, such that σ2 (NON,n) = ∑iσ2(NON,i,n). However, given the number and proximity of the box regions, it is certainly possible that some OFF events used for background estimation from non-excluded regions are additionally used in the spectral analyses of nearby boxes. The level of overall correlation of OFF events between all boxes was found by constructing a correlation matrix with elements filled by the fraction of unique OFF events between each pair of spectral boxes. The fraction of shared events between each pair was found based on the shared time-stamps of events. This led to an additional term being added to the uncorrelated error for each energy bin taking this correlation matrix into account, such that the total OFF error is then given by
 (A.3)
(A.3)
where ρi,j is the OFF event correlation matrix element between boxes i and j.
Finally, these contributions were combined to give an error for each flux point of
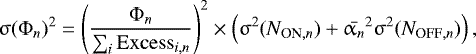 (A.4)
(A.4)
where  is the weighted average αn over all boxes;
  and αi,n is the ratio of the ON exposure to OFF exposure for each box i and energy bin n.
In forming the total spectrum, the changing size of the nebula with energy needs to be accounted for in a robust way to avoid adding multiple non-significant boxes at the highest energies, which can lead to greater statistical uncertainties in the flux. To this end, the flux from a given box region was not included when the relative contribution dropped below 1% of the total of the fitted power-law models. Boxes for which this condition occurred were omitted at all energies above the lowest energy at which the contributionwas found to be lower than 1%.
References
- Abeysekara, A. U., Albert, A., Alfarco, R., et al. 2017, ApJ, 843, 40 [NASA ADS] [CrossRef] [Google Scholar]
- Acero, F., Ackermann, M., Ajello, M., et al. 2015, ApJS, 218, 23 [Google Scholar]
- Acharya, B. S., Actisf, M., Aghajani, T., et al. 2013, Astropart. Phys., 43, 3 [Google Scholar]
- Ackermann, M., Ajello, M., Baldini, L., et al. 2017, ApJ, 843, 139 [NASA ADS] [CrossRef] [Google Scholar]
- Aharonian, F., Akhperjanian, A. G., Aye, K.-M., et al. 2005a, A&A, 435, L17 [NASA ADS] [CrossRef] [EDP Sciences] [Google Scholar]
- Aharonian, F., Akhperjanian, A. G., Bazer-Bachi, A. R., et al. 2005b, A&A, 442, L25 [NASA ADS] [CrossRef] [EDP Sciences] [Google Scholar]
- Aharonian, F., Akhperjanian, A. G., Bazer-Bachi, A. R., et al. 2006a, A&A, 457, 899 [NASA ADS] [CrossRef] [EDP Sciences] [Google Scholar]
- Aharonian, F., Akhperjanian, A. G., Bazer-Bachi, A. R., et al. 2006b, A&A, 460, 365 [NASA ADS] [CrossRef] [EDP Sciences] [Google Scholar]
- Aharonian, F., Akhperjanian, A. G., Bazer-Bachi, A. R., et al. 2006c, A&A, 460, 743 [NASA ADS] [CrossRef] [EDP Sciences] [Google Scholar]
- Aharonian, F., Akhperjanian, A. G., Bazer-Bachi, A. R., et al. 2006d, ApJ, 636, 777 [NASA ADS] [CrossRef] [Google Scholar]
- Ajello, M., Atwood, W. B., Baldini, L., et al. 2017, ApJS, 232, 18 [NASA ADS] [CrossRef] [Google Scholar]
- Angüner, E. O., Casanova, S., Oya, I., et al. 2017, 35th Int. Cosmic Ray Conf., Proc. Science, 301, 686 [NASA ADS] [CrossRef] [Google Scholar]
- Atoyan, A. M., Aharonian, F. A., & Völk, H. J. 1995, Phys. Rev. D, 52, 3265 [NASA ADS] [CrossRef] [Google Scholar]
- Berge, D., Funk, S., & Hinton, J. 2007, A&A, 466, 1219 [NASA ADS] [CrossRef] [EDP Sciences] [Google Scholar]
- Blumenthal, G. R., & Gould, R. J. 1970, Rev. Mod. Phys., 42, 237 [NASA ADS] [CrossRef] [Google Scholar]
- Castelletti, G., Giacani, E., & Dubner, G. 2012, Boletín de la Asociación Argentina de Astronomía La Plata Argentina, 55, 179 [NASA ADS] [Google Scholar]
- de Jager, O. C., & Djannati-Ataï, A. 2009, Astrophys. Space Sci. Lib., 357, 451 [NASA ADS] [CrossRef] [Google Scholar]
- de Naurois, M., & Rolland, L. 2009, Astropart. Phys., 32, 231 [NASA ADS] [CrossRef] [Google Scholar]
- de Oña-Wilhelmi E., Rudak, B., Barrio, J. A., et al., 2013, Astropart. Phys., 43, 287 [NASA ADS] [CrossRef] [Google Scholar]
- Finley, J. P., Srinivasan, R., & Park, S. 1996, ApJ, 466, 938 [NASA ADS] [CrossRef] [EDP Sciences] [Google Scholar]
- Gaensler, B. M., & Slane, P. O. 2006, ARA&A, 44, 17 [NASA ADS] [CrossRef] [Google Scholar]
- Gaensler, B. M., Schulz, N. S., Kaspi, V. M., Pivovaroff, M. J., & Becker, W. E. 2003, ApJ, 588, 441 [NASA ADS] [CrossRef] [Google Scholar]
- Grondin, M.-H., Funk, S., Lemoine-Goumard, M., et al. 2011, ApJ, 738, 42 [NASA ADS] [CrossRef] [Google Scholar]
- Hahn, J. 2015, Proc. 34th Int. Cosmic Ray Conf., 917 [Google Scholar]
- H.E.S.S. Collaboration (Abramowski, A. et al.) 2012a, A&A, 548, A38 [NASA ADS] [CrossRef] [EDP Sciences] [Google Scholar]
- H.E.S.S. Collaboration (Abramowski, A. et al.) 2012b, A&A, 548, A46 [NASA ADS] [CrossRef] [EDP Sciences] [Google Scholar]
- H.E.S.S. Collaboration (Abdalla, H. et al.) 2017, A&A, 600, A89 [NASA ADS] [CrossRef] [EDP Sciences] [Google Scholar]
- H.E.S.S. Collaboration (Abdalla, H. et al.) 2018a, A&A, 612, A1 [NASA ADS] [CrossRef] [EDP Sciences] [Google Scholar]
- H.E.S.S. Collaboration (Abdalla, H. et al.) 2018b, A&A, 612, A2 [NASA ADS] [CrossRef] [EDP Sciences] [Google Scholar]
- H.E.S.S. Collaboration (Abdalla, H. et al.) 2018c A&A, 612, A6 [NASA ADS] [CrossRef] [EDP Sciences] [Google Scholar]
- Hinton, J. A. 2004, New Astron. Rev., 48, 331 [NASA ADS] [CrossRef] [Google Scholar]
- Holler, M., Berge, D., van Eldik, C., et al. 2015, Proc. 34th Int. Cosmic Ray Conf., 847 [Google Scholar]
- Kaplan, D. L., Chatterjee, S., Gaensler, B. M., & Anderson, J. 2008, ApJ, 677, 1201 [NASA ADS] [CrossRef] [Google Scholar]
- Kennel, C. F.,& Coroniti, F. V. 1984, ApJ, 283, 694 [NASA ADS] [CrossRef] [Google Scholar]
- Khangulyan, D., Koldoba, A. V., Ustyugova, G. V., Bogovalov, S. V., & Aharonian, F. 2018, ApJ, 860, 59 [NASA ADS] [CrossRef] [Google Scholar]
- Kirk, J. G., & Skjæraasen, O. 2003, ApJ, 591, 366 [NASA ADS] [CrossRef] [Google Scholar]
- Kirk, J. G., Lyubarsky, Y., & Petri, J. 2009, Astrophys. Space Sci. Lib., 357, 421 [NASA ADS] [CrossRef] [Google Scholar]
- Lemiere, A., Terrier, R., & Djannati-Ataï, A. 2005, Proc. 29th Int. Cosmic Ray Conf., 4, 105 [NASA ADS] [Google Scholar]
- Li, T.-P., & Ma, Y.-Q. 1983, ApJ, 272, 317 [NASA ADS] [CrossRef] [Google Scholar]
- Lopez-Coto, R., Hahn, J., Hinton, J., et al. 2017, Proc. 35th Int. Cosmic Ray Conf., 301, 735 [NASA ADS] [CrossRef] [Google Scholar]
- Manchester, R. N., Hobbs, G. B., Teoh, A., & Hobbs, M. 2005, AJ, 129, 1993 [NASA ADS] [CrossRef] [Google Scholar]
- Maurin, D., Donato, F., Taillet, R., & Salati, P. 2001, ApJ, 555, 585 [NASA ADS] [CrossRef] [Google Scholar]
- Parsons, R. D., & Hinton, J. A. 2014, Astropart. Phys., 56, 26 [NASA ADS] [CrossRef] [Google Scholar]
- Pavlov, G. G., Kargaltsev, O., & Brisken, W. F. 2008, ApJ, 675, 683 [NASA ADS] [CrossRef] [Google Scholar]
- Popescu, C. C., Yang, R., Tuffs, R. J., et al. 2017, MNRAS, 470, 2539 [NASA ADS] [CrossRef] [Google Scholar]
- Porter, T. A., Jóhannesson, G., & Moskalenko, I. V. 2017, ApJ, 846, 67 [NASA ADS] [CrossRef] [Google Scholar]
- Porth, O., Komissarov, S. S., & Keppens, R. 2013, MNRAS, 431, L48 [NASA ADS] [CrossRef] [Google Scholar]
- Porth, O., Vorster, M. J., Lyutikov, M., & Engelbrecht, N. E. 2016, MNRAS, 460, 4135 [NASA ADS] [CrossRef] [Google Scholar]
- Rees, M. J., & Gunn, J. E. 1974, MNRAS, 167, 1 [NASA ADS] [CrossRef] [Google Scholar]
- Reynolds, S. P., & Chevalier, R. A. 1984, ApJ, 278, 630 [NASA ADS] [CrossRef] [Google Scholar]
- Sakurai, I., Kawai, N., Torii, K., & Shibata, S. 2001, in New Century of X-ray Astronomy, eds. H. Inoue & H. Kunieda, ASP Conf. Ser., 251, 408 [NASA ADS] [Google Scholar]
- Shen, C. S. 1970, ApJ, 162, L181 [NASA ADS] [CrossRef] [Google Scholar]
- Stupar, M., Parker, Q. A., & Filipović, M. D. 2008, MNRAS, 390, 1037 [NASA ADS] [CrossRef] [Google Scholar]
- Tang, X., & Chevalier, R. A. 2012, ApJ, 752, 83 [NASA ADS] [CrossRef] [Google Scholar]
- Truelove, J. K., & McKee, C. F. 1999, ApJS, 120, 299 [NASA ADS] [CrossRef] [Google Scholar]
- Uchiyama, H., Matsumoto, H., Tsuru, T. G., Koyama, K., & Bamba, A. 2009, PASJ, 61, S189 [NASA ADS] [CrossRef] [Google Scholar]
- Van Etten, A., & Romani, R. W. 2011, ApJ, 742, 62 [Google Scholar]
- Voisin, F., Rowell, G., Burton, M. G., et al. 2016, MNRAS, 458, 2813 [NASA ADS] [CrossRef] [Google Scholar]
- Zabalza, V. 2015, Proc. 34th Int. Cosmic Ray Conf., 922 [Google Scholar]
All Tables
Summary of the data used in the two analyses, including the exposure and mean zenith angle θz of the observations.
Fit parameters for various fits to the nebula spectrum extracted from a symmetric region of 0.8° and 0.4° radius, respectively, with E0 = 1TeV and I0 in units of 10−12 cm−2 s−1 TeV−1.
Extent measurements as a function of energy for analyses A and B, with statistical and systematic errors.
All Figures
|
Fig. 1 Left panel: excess count map of the nebula using analysis A, with the Galactic plane indicated by the dashed white line and the locations of two energetic pulsars in the region indicated by green triangles. The two spectral extraction regions used in Fig. 2 are overlaid. The larger region with a radius of 0.8° slightly overlaps HESS J1826–130 (RA: 18h26m00s, Dec: − 13°02′02″), whose location and approximate extent is indicated by the green dashed circle, whereas the region with the smaller radius of 0.4° encompasses the core emission and peak of the nebula. Both regions are centred on the best-fit position of the nebula as determined by Aharonian et al. (2006b). Right panel: excess count map of the nebula using analysis B, shown for comparison with the region of 0.8° radius overlaid. The exposure times and telescope configurations for the two analyses are given in Table 1. A correlation radius of 0.07° was used forboth excess maps. |
| In the text | |
|
Fig. 2 Left panel: spectra extracted from the region with a radius of 0.8° shown in Fig. 1, encompassing the majority of the nebula emission. The fit parameters given in Table 2 for analyses A and B both agree well with the previously reported spectrum (Aharonian et al. 2006b). Right panel: comparison of spectra extracted from the regions of 0.8° and 0.4° radii shown in Fig. 1 together with a spectrum of HESS J1826–130 (Angüner et al. 2017). All spectra are shown with a best-fit model of a power law with exponential cut-off. |
| In the text | |
|
Fig. 3 Excess count maps of the HESS J1825–137 region in four different energy bands: E < 1 TeV, 1 TeV < E < 10 TeV, E > 10 TeV, and E > 32 TeV. The size of the source is clearly much reduced at high energies. Other sources within the field of view include the binary LS 5039 and the hard-spectrum source HESS J1826–130. The positions of the pulsars PSR B1823–13 associated with HESS J1825–137 and PSR J1826–1256 (which might be associated with HESS J1826–130) are also shown. Significance contours are shown at 5, 10, and 15σ for maps with energies below 10 TeV, and at 3, 5, and 10σ for maps with energies above 10 TeV. |
| In the text | |
|
Fig. 4 Azimuthal profile of emission around the position of PSR B1823–13 out to a radial distance of 1.6°. The emission profile is well described by an asymmetric Gaussian between the two minima. |
| In the text | |
|
Fig. 5 Slices taken along the major and minor axes from the uncorrelated excess map using analysis A, centred on the peak position, with dimensions 3.5° × 0.5°. The location of the pulsar along the slice is indicated by a dashed line, and the emission peak is clearly offset towards the south, with the emission extending out to ~ 1.5° from the pulsar. In contrast, the emission drops off extremely steeply from the emission peak north of the pulsar. South and west are orientated towards lower right ascension values. |
| In the text | |
|
Fig. 6 Semi-circular region (left panel), with the pulsar at the apex and a mask applied over LS 5039, was extracted from the excess maps to form a radial profile of the emission (right panel), shown here for the full energy range with analysis A. A mask was also applied over HESS J1826–130, which is particularly relevant for measuring the northern extent. The radial profile was fitted by a polynomial (Eq. (1)) to characterise the extent of the emission. Dashed and dotted lines mark the radial distance at which the emission drops to 1∕e and 10% of the peak value, respectively. |
| In the text | |
|
Fig. 7 Variation of radial extent with energy. Shaded regions indicate compatible transport scenarios for IC scattering in the Thomson regime with |
| In the text | |
|
Fig. 8 Map of HESS J1825–137 showing the location and fitted power-law index of each of the 38 boxes used in independentspectral analyses. Boxes 1–12 are labelled to match the results in Aharonian et al. (2006b), whilst boxes a–z are new to this analysis. The fitted major axis used for the extent measurements is overlaid and the position of the pulsar (located at the centre of box 9) indicated. Significance contours shown correspond to 5, 10, 30, and 50σ, respectively. LS 5039 can be identified as a high-significance point source. Five spectral boxes (I–V) covering the HESS J1826–130 region are also shown. |
| In the text | |
|
Fig. 9 Cooling of electrons within the pulsar wind nebula HESS J1825-137. Trend of fitted spectral power-law index with distance, flux from 1 to 5 TeV with distance, and of flux from 1 to 5 TeV with a power-law index from the power-law fits to the spectral boxes depicted in Fig. 8. Correlation coefficients of 0.89 ± 0.06stat. ± 0.17sys., − 0.83 ± 0.03stat. ± 0.01sys., and − 0.92 ± 0.03stat. ± 0.4sys. were found. |
| In the text | |
|
Fig. 10 Spectral energy distribution of HESS J1825–137 showing the total combined H.E.S.S. energy flux with statistical error bars, as determined with the method outlined in Sect. A. The Fermi-LAT spectral fit from Grondin et al. (2011) is also shown, together with spectra from the 3FGL and 3FHL catalogues (Acero et al. 2015; Ajello et al. 2017), both of which were best fit by a log-parabola spectral model. A plausible IC emission model with multiple contributing radiation fields is shown, using the parameterisation of the Popescu et al. (2017) radiation model and the Naima modelling package (Zabalza 2015). The emission is mostly dominated by the FIR field; the CMB becomes dominant at a few tens of TeV and below ~ 10 GeV. |
| In the text | |
Current usage metrics show cumulative count of Article Views (full-text article views including HTML views, PDF and ePub downloads, according to the available data) and Abstracts Views on Vision4Press platform.
Data correspond to usage on the plateform after 2015. The current usage metrics is available 48-96 hours after online publication and is updated daily on week days.
Initial download of the metrics may take a while.