Fig. 10
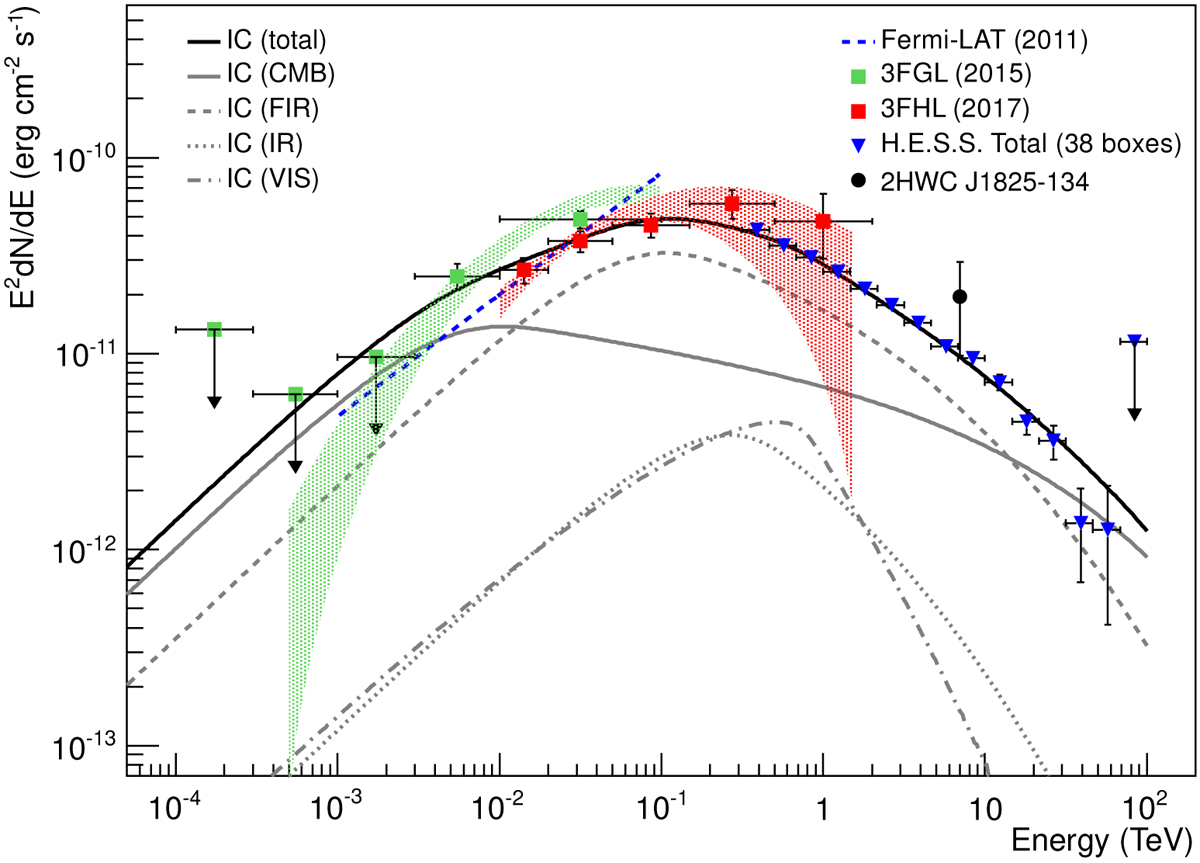
Spectral energy distribution of HESS J1825–137 showing the total combined H.E.S.S. energy flux with statistical error bars, as determined with the method outlined in Sect. A. The Fermi-LAT spectral fit from Grondin et al. (2011) is also shown, together with spectra from the 3FGL and 3FHL catalogues (Acero et al. 2015; Ajello et al. 2017), both of which were best fit by a log-parabola spectral model. A plausible IC emission model with multiple contributing radiation fields is shown, using the parameterisation of the Popescu et al. (2017) radiation model and the Naima modelling package (Zabalza 2015). The emission is mostly dominated by the FIR field; the CMB becomes dominant at a few tens of TeV and below ~ 10 GeV.
Current usage metrics show cumulative count of Article Views (full-text article views including HTML views, PDF and ePub downloads, according to the available data) and Abstracts Views on Vision4Press platform.
Data correspond to usage on the plateform after 2015. The current usage metrics is available 48-96 hours after online publication and is updated daily on week days.
Initial download of the metrics may take a while.