Fig. 8
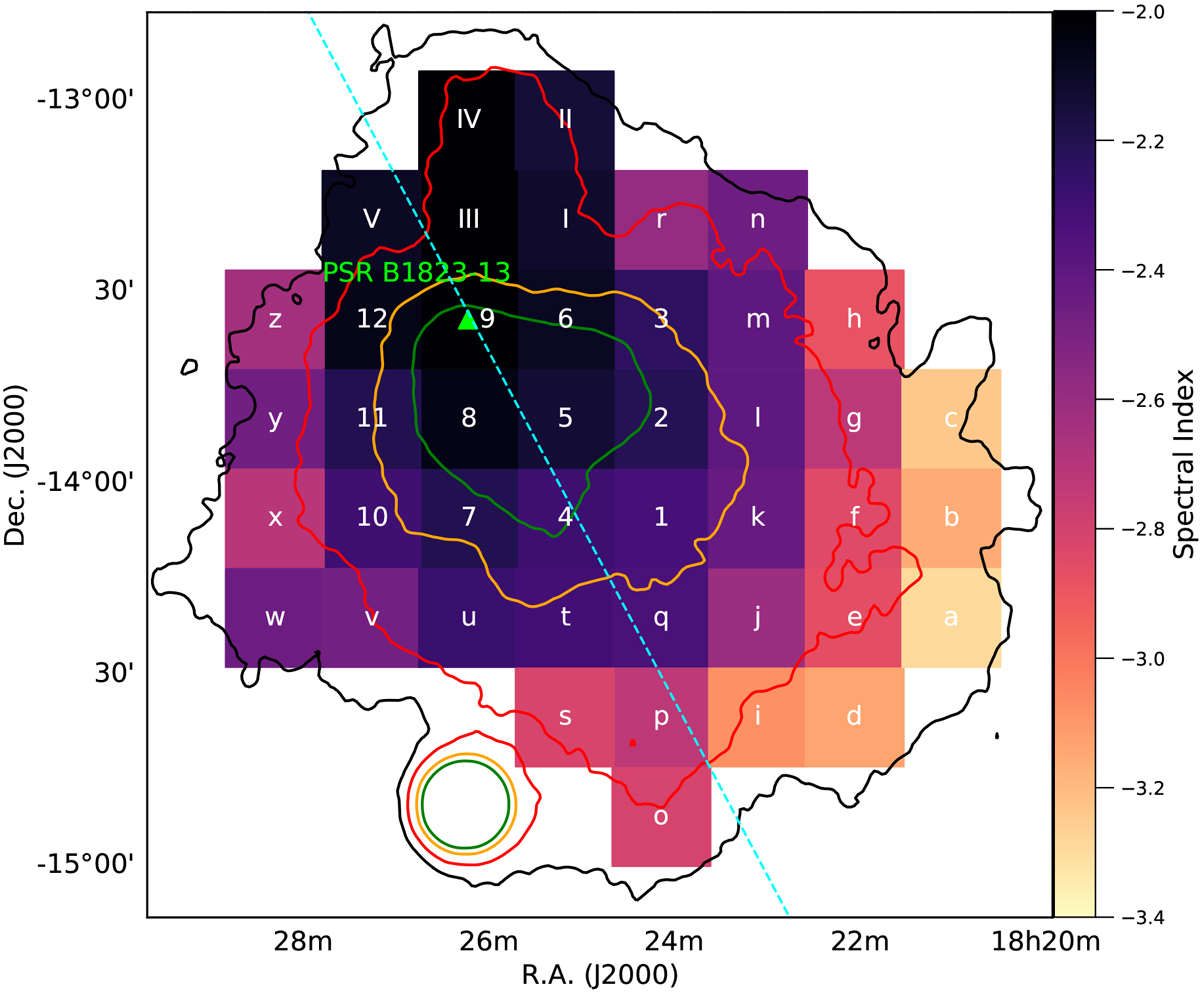
Map of HESS J1825–137 showing the location and fitted power-law index of each of the 38 boxes used in independentspectral analyses. Boxes 1–12 are labelled to match the results in Aharonian et al. (2006b), whilst boxes a–z are new to this analysis. The fitted major axis used for the extent measurements is overlaid and the position of the pulsar (located at the centre of box 9) indicated. Significance contours shown correspond to 5, 10, 30, and 50σ, respectively. LS 5039 can be identified as a high-significance point source. Five spectral boxes (I–V) covering the HESS J1826–130 region are also shown.
Current usage metrics show cumulative count of Article Views (full-text article views including HTML views, PDF and ePub downloads, according to the available data) and Abstracts Views on Vision4Press platform.
Data correspond to usage on the plateform after 2015. The current usage metrics is available 48-96 hours after online publication and is updated daily on week days.
Initial download of the metrics may take a while.