Fig. 2
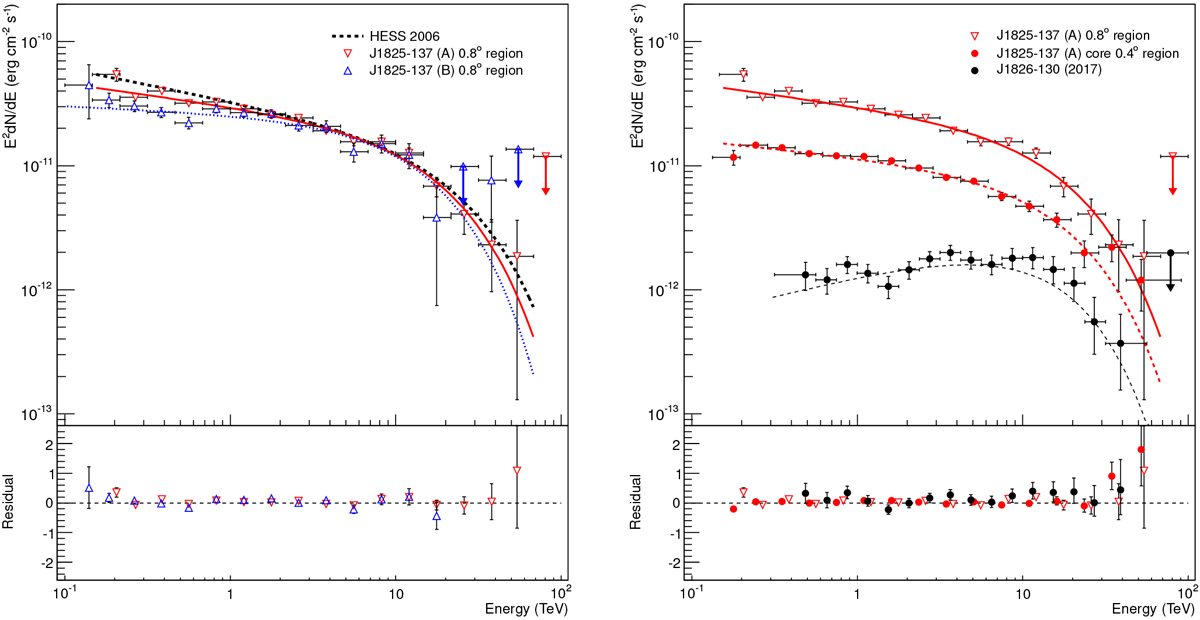
Left panel: spectra extracted from the region with a radius of 0.8° shown in Fig. 1, encompassing the majority of the nebula emission. The fit parameters given in Table 2 for analyses A and B both agree well with the previously reported spectrum (Aharonian et al. 2006b). Right panel: comparison of spectra extracted from the regions of 0.8° and 0.4° radii shown in Fig. 1 together with a spectrum of HESS J1826–130 (Angüner et al. 2017). All spectra are shown with a best-fit model of a power law with exponential cut-off.
Current usage metrics show cumulative count of Article Views (full-text article views including HTML views, PDF and ePub downloads, according to the available data) and Abstracts Views on Vision4Press platform.
Data correspond to usage on the plateform after 2015. The current usage metrics is available 48-96 hours after online publication and is updated daily on week days.
Initial download of the metrics may take a while.