Fig. 5
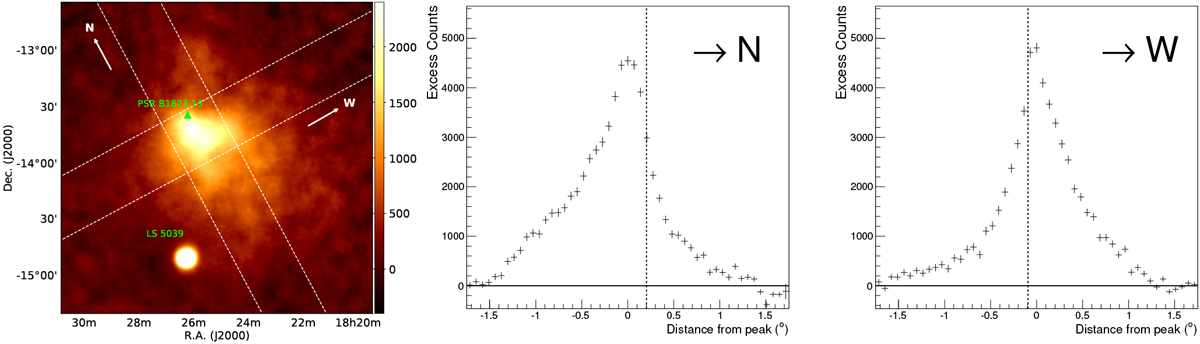
Slices taken along the major and minor axes from the uncorrelated excess map using analysis A, centred on the peak position, with dimensions 3.5° × 0.5°. The location of the pulsar along the slice is indicated by a dashed line, and the emission peak is clearly offset towards the south, with the emission extending out to ~ 1.5° from the pulsar. In contrast, the emission drops off extremely steeply from the emission peak north of the pulsar. South and west are orientated towards lower right ascension values.
Current usage metrics show cumulative count of Article Views (full-text article views including HTML views, PDF and ePub downloads, according to the available data) and Abstracts Views on Vision4Press platform.
Data correspond to usage on the plateform after 2015. The current usage metrics is available 48-96 hours after online publication and is updated daily on week days.
Initial download of the metrics may take a while.