Fig. 1
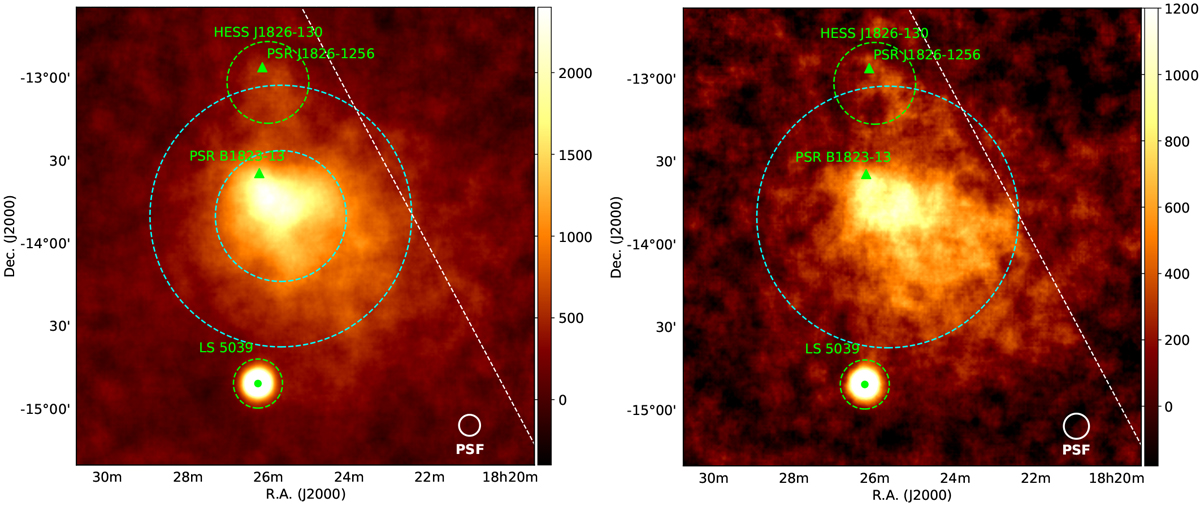
Left panel: excess count map of the nebula using analysis A, with the Galactic plane indicated by the dashed white line and the locations of two energetic pulsars in the region indicated by green triangles. The two spectral extraction regions used in Fig. 2 are overlaid. The larger region with a radius of 0.8° slightly overlaps HESS J1826–130 (RA: 18h26m00s, Dec: − 13°02′02″), whose location and approximate extent is indicated by the green dashed circle, whereas the region with the smaller radius of 0.4° encompasses the core emission and peak of the nebula. Both regions are centred on the best-fit position of the nebula as determined by Aharonian et al. (2006b). Right panel: excess count map of the nebula using analysis B, shown for comparison with the region of 0.8° radius overlaid. The exposure times and telescope configurations for the two analyses are given in Table 1. A correlation radius of 0.07° was used forboth excess maps.
Current usage metrics show cumulative count of Article Views (full-text article views including HTML views, PDF and ePub downloads, according to the available data) and Abstracts Views on Vision4Press platform.
Data correspond to usage on the plateform after 2015. The current usage metrics is available 48-96 hours after online publication and is updated daily on week days.
Initial download of the metrics may take a while.