| Issue |
A&A
Volume 617, September 2018
|
|
|---|---|---|
| Article Number | A124 | |
| Number of page(s) | 19 | |
| Section | Interstellar and circumstellar matter | |
| DOI | https://doi.org/10.1051/0004-6361/201833386 | |
| Published online | 27 September 2018 | |
The optical properties of dust: the effects of composition, size, and structure
1
Institut d’Astrophysique Spatiale, CNRS, Univ. Paris-Sud, Université Paris-Saclay,
Bât. 121,
91405
Orsay cedex, France
e-mail: This email address is being protected from spambots. You need JavaScript enabled to view it.
2
Institut de Recherche en Astrophysique et Planétologie, CNRS, Université de Toulouse,
9 avenue du Colonel Roche,
31028
Toulouse Cedex 4, France
Received:
7
May
2018
Accepted:
12
June
2018
Abstract
Context. Dust grains are determinant for setting the chemical, physical, dynamical, and radiative properties of all the media in which they are present. Their influence depends on the grain composition, size, and geometrical structure which vary throughout the life cycle of dust. In particular, grain growth arises in dense molecular clouds and protoplanetary disks as traced by an enhancement of the dust far-IR emissivity and by the effects of cloudshine and coreshine.
Aims. Our aim is to investigate the imprint of the grain characteristics on the dust unpolarised optical properties from the visible to the far-IR wavelengths for isolated grains as well as for aggregates.
Methods. Using optical constants for both carbonaceous and silicate materials, we have derived the absorption and scattering efficiencies, the asymmetry factor of the phase function, the single scattering albedo, and the mass opacity for isolated grains and aggregates, using either the Mie theory or the discrete dipole approximation (DDA). We investigated the effects of the size, porosity, and shape of the grains, and of the monomers constituting the aggregates, on the optical properties. Besides this, for aggregates we studied the influence of the number of monomers and of mixing monomer sizes.
Results. Grain structure changes result in optical property variations at all wavelengths. Porosity, grain elongation, as well as aggregation all produce an increase in the far-IR opacity. The spectral dependence of this increase depends on the nature of the material composing the grain: it is independent of the wavelength for insulators but not for conductors. In the case of aggregates, the far-IR increase does not depend on the monomer size and saturates for aggregates containing six or more monomers. In the visible and near-IR, the aggregate behaviour is reminiscent of a compact sphere of the same mass whereas at longer wavelengths, it is closer to the effect of porosity. Finally, for silicates, the mid-IR spectral feature at 18 μm is more sensitive to the details of the grain structure than the 10 μm feature.
Conclusions. Dust optical properties, from the visible to the far-IR, are highly dependent upon the grain composition, size, and structure. This study provides a basis for understanding the range of variations achievable as a result of varying the grain characteristics. It emphasises the importance of considering the detailed grain structure in determining the dust optical properties and of using exact methods because approximate methods cannot reproduce the entire range of the observed variations at all wavelengths.
Key words: dust, extinction / evolution
© ESO 2018
1 Introduction
Dust grains are ubiquitous in all astrophysical environments, from the solar system and protoplanetary disks to interstellar and intergalatic clouds, and their influence on the radiative properties of all these very diverse media is always significant through the absorption, scattering, and (non)thermal re-emission of starlight. Dust grains are also a major player in the determination of the interstellar gas temperature through photoelectric emission or gas-grain collisions (e.g. Hollenbach 1989; Weingartner & Draine 2001). Similarly, grains have a great influence on the chemical complexity in the interstellar medium (ISM): indeed, the role of grain-surface reactions is crucial to understand the formation of some very common molecules, such as H2, and of more complex molecules (see, for instance, Williams 2005; Wakelam et al. 2017). The grain radiative properties and their catalytic efficiency are, at least, reliant on the grain size distribution and chemical composition. A long-standing issue is their detailed geometrical structure: Are they isolated particles or aggregates? Are the monomers spherical or spheroidal? Are the monomers porous or compact? Is their surface smooth or rough? These structural properties are known to greatly influence the grain optical properties as already demonstrated by many studies of interstellar dust (e.g. Bazell & Dwek 1990; Kozasa et al. 1992; Stognienko et al. 1995; Fogel & Leung 1998; Voshchinnikov et al. 2000; Shen et al. 2008; Koehler et al. 2011, 2015; Ormel et al. 2011; Köhler et al. 2012; Kataoka et al. 2014; Min et al. 2016), cometary dust (e.g. Okamoto & Xu 1998; Kimura et al. 2003, 2016), or terrestrial aerosols of interest in the study of climate change (e.g. Kemppinen et al. 2015; Liu et al. 2015; Wu et al. 2016; Doner & Liu 2017). The aim of the present paper is to systematically, if not exhaustively, investigate the imprint of grain structure on the dust unpolarised optical properties from the visible to the far-IR wavelengths for isolated grains as well as aggregates. Variations observed in the optical properties with grain structure are also known to depend on whether the considered material is highly absorbing or not (e.g. Bohren & Huffman 1998; Voshchinnikov et al. 2000). Our study will thus use both insulating and conducting materials.
The aim of this study is not to provide an advanced grain model directly applicable to the dense ISM medium or protoplanetary disks but to understand in detail which parameters are capable of modifying the dust optical properties and are therefore at the origin of the variations in the astronomical dust observables. These variations include a decrease in grain temperature, an increase in the far-IR emissivity, and variations in the spectral index which are usually explained by increasing the grain size and/or fluffiness, surface irregularity, coagulation, and ice coating (e.g. Ossenkopf 1993; Stepnik et al. 2003; Ridderstad & Juvela 2010; Ormel et al. 2011; Ysard et al. 2013; Koehler et al. 2015; Min et al. 2016). These variations are often accompanied by an increase in the scattering efficiency from the visible to the mid-IR known as cloudshine and coreshine (e.g. Mattila 1970; Lehtinen & Mattila 1996; Foster & Goodman 2006; Pagani et al. 2010; Paladini 2014).
This paper is organised as follows. Section 2 describes the grain compositions, sizes, and structures considered and how their optical properties are calculated. Section 3 explores the effect of changing all these parameters on the extinction efficiency and dust mass opacity. In Sect. 4, changes in the silicate mid-IR features are discussed. Albedo variations are discussed in Sect. 5. Section 6 presents the comparison between exact calculations of the optical properties and approximate methods. Concluding remarks are given in Sect. 7.
2 Grain description
The dust optical properties (absorption and scattering efficiencies or cross–sections) and mass opacity (extinction cross–section per unit mass) depend on three parameters: (i) the material complex refractive index m = n+ ik (optical constants); (ii) the grain size; and (iii) the grain structure (core/mantle, multi-layer, aggregate, etc.). In this section, we describe all the variations in these parameters which are considered in this study and the methods used to translate them into optical properties (absorption and scattering efficiencies).
2.1 Optical constants
Our starting point is the global dust modelling framework THEMIS1 (The Heterogeneous dust Evolution Model for Interstellar Solids), which is briefly summarised in Jones et al. (2017)2. Two main sets of optical constants are included in THEMIS: amorphous magnesium-rich silicates with metallic iron and iron sulphide nano-inclusions and amorphous hydrocarbon grains.
As described in Koehler et al. (2014), the silicates are assumed to be a 50–50% mixture of grains with the normative compositions of forsterite and enstatite, the main difference between these two materials being the 10 and 20 μm band profiles. As the differences are small, we only consider forsterite-type amorphous silicates in this study, which have a density of 2.95 g cm−3. In the following, grains built with these optical constants will be referred to as a-SilFe,FeS grains (see green lines in Fig. 1).
The THEMIS hydrocarbon dust component, a-C(:H), is described in Jones (2012a,b,c). The optical constants of these semi-conducting materials are built using the extended random covalent network (eRCN) and the defective graphite (DG) models. These two models allow us to derive the complex refractive indices of a-C(:H) as a function of their Tauc band gap, Eg, and the particle size, a3. In order to show the biggest possible variations, we used the optical properties of two extreme cases in this study: (i) H-poor and aromatic-rich a-C grains with Eg = 0.1 eV (blue lines in Fig. 1) and (ii) H-rich and aliphatic-rich a-C:H grains with Eg = 2.5 eV (fuchsia lines in Fig. 1). According to Jones (2012c), the a-C(:H) material density can be related to the band gap through the following relation: ρ(Eg) ≈ 1.3 + 0.4 exp[−(Eg + 0.2)] g cm−3, leading to ρ = 1.60 and 1.33 g cm−3 for the a-C and a-C:H materials, respectively. Of course, the growth of pure big a-C(:H) carbon grains in the ISM seems highly improbable as we would instead expect mixing with the silicate dust component but our primary aim here is to investigate whether the variations in the optical properties due to grain shape are subordinate to the material nature or not.
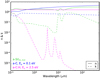 |
Fig. 1 Optical constants of silicates (green), a-C with Eg = 0.1 eV (blue), and a-C:H with Eg = 2.5 eV (fuchsia). The real, n, and complex, k, parts of the complex refractive index are showed by the solid and dashed lines, respectively. |
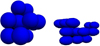 |
Fig. 2 Two examples of aggregate shapes (arbitrary scales). Left panel: aggregate made of N = 12 compact spherical monomers with a0 = 0.1 μm. Right panel: aggregate made of N = 16 compact prolate monomers with a0 = 0.05 μm and aspect ratios of 2. |
2.2 Grain sizes and structures
The size and structure of interstellar grains are still a matter of debate for the various ISM phases. To be as exhaustive as possible, we consider as many variations in these two parameters as possible. Our calculations can be split in two main grain types: isolated grains and aggregates.
For the isolated grains, we consider three types of variations:
-
compact spherical grains with grain radii a = 0.05 – 5 μm;
-
porous spherical grains with a = 0.1 μm and a porosity degree P = 10, 20, 30, 40, and 50% where a porosity degree of x% corresponds to the random removal of x% of the material composing a compact sphere of the same radius4;
-
compact oblate and prolate grains with aspect ratios of two: the principal axis of the grains has a length of 2a and the two other axes of 2b with b∕a = 2 for oblates and b∕a = 1∕2 for prolates, corresponding to volume equivalent radii aV = 0.05, 0.1, and 1 μm, where
 .
.
For the aggregates, we followed the approach of Koehler et al. (2011). These authors considered aggregates made of N compact spherical monomers of constant radius a0 = 0.1 μm located on a cubic grid, composed of amorphous silicates or carbons. They studied the influence of the number N of monomers composing the aggregates and of the contact area between the monomers on the grain near to far-IR extinction efficiency. They found an increase in efficiency when increasing the contact area up to a diameter of about the monomer radius. Increasing further the contact area had no further effect. Similar results were also found by Xing & Hanner (1997) for amorphous silicates and glassy carbons and by Yon et al. (2015) and Doner et al. (2017) for soot aggregates in the near-IR. In the following, in order to maximise the variations in the optical properties, we always assume the contact area of maximum effect for all the considered aggregates with N = [2, 4, 6, 8, 10, 12, 14, 16]:
-
aggregates made of N compact spherical monomers of radius a0 = 0.05, 0.1, 0.5, and 1 μm;
-
aggregates made of N porous spherical monomers of radius a0 = 0.1 μm with P = 20%;
-
aggregates made of N compact spheroid monomers of mass/volume equivalent radius aV = 0.05 μm: we consider oblate and prolate monomers, both with aspect ratios of two, and for the sake of simplicity, all the spheroids have their principal axes aligned along the same axis;
-
aggregates made of four compact spherical monomers with two different radii: a1 = 0.05 μm and a2 = 0.1 or 0.5 μm.
Aggregates with more than two monomers can have several structures. In this study, following Koehler et al. (2011), we average our results over ten randomly chosen aggregate shapes for N ≥ 6 and exclude the most compact and most elongated shapes when N = 4. One way of characterising the shape is through the grain fractal dimension Df, which can be defined as (Bazell & Dwek 1990; Jones 2011) follows:
 (1)
(1)
where N(r) and M(r) are the number and mass, respectively, of particles within a given radius r measured from a reference point (the mass centre of the aggregate in our case). If Df = 1, the aggregate is linear and if Df = 3, it is compact. As explained in Kozasa et al. (1992) two extreme cases of aggregates can be considered: Ballistic Particle Cluster Aggregates (BPCA) with Df = 3 and Ballistic Cluster Cluster Aggregates (BCCA) with Df = 2. In their simulations, the aggregates were produced by “shooting projectiles onto a target randomly one at a time” (Kozasa et al. 1992): in the BPCA case, the projectile was a constituent particle, whereas in the BCCA case, the projectile was an aggregate of the same mass as the target but of different shape. In order to reduce the computation time, we only consider an intermediate case in our study and build the aggregates so that they obey Df ~ 2.5. Aggregate shape examples are shown in Fig. 2.
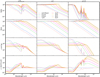 |
Fig. 3 Influence of grain size for compact spherical a-SilFe,FeS (left panels), a-C (middle panels), and a-C:H (right panels) grains with radius a = 0.05, 0.1, 0.5, 1, 2, 3, 4, and 5 μm plotted in pink, blue, green, fuchsia, red, yellow, brown, and orange, respectively. Top bottom panels: Qabs (a, λ), Qsca (a, λ), κ(a, λ), and the ratioof the latter to κ(a = 0.1 μm, λ). |
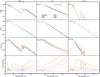 |
Fig. 4 Influence of porosity for spherical a-SilFe,FeS (left panels), a-C (middle panels), and a-C:H (right panels) grains with radius a = 0.1 μm and a porosity degree P = 0, 10, 20, 30,40, and 50% plotted in blue, green, pink, red, yellow, and brown, respectively. Top bottom panels: Qabs (P, λ), Qsca (P, λ), κ(P, λ), and the ratioof the latter to κ(compact, λ) for a compact grain with same mass. |
2.3 Optical property calculations
Two methods are used to derive the optical properties from the optical constants. For compact spherical grains, we use the Fortran 90 version of the Mie theory routine BHMIE described in Bohren & Huffman (1998). For more complex grains, we use the Discrete Dipole Approximation (DDA; Purcell & Pennypacker 1973; Draine 1988) utilising the publicly available ddscat routine5 described in Draine & Flatau (1994). In DDA, the grain is assumed to be well represented by an assembly of point-like electric dipole oscillators. Draine & Flatau (1994) advise that the dipole size, δ, has to be chosen according to the following criterion: |m|2πδ∕λ < 1∕2. This criterion is met by all grains used in our calculations and described in Sect. 2.2. Both BHMIE and ddscat provide the dimensionless absorption and scattering efficiencies, Qabs and Qsca, respectively, and the scattering phase function g = ⟨cosθ⟩, as a function of wavelength. With Qabs and Qsca, the dust mass opacity can be determined:
![Mathematical equation: \begin{equation*} \kappa [\textrm{cm}^2\textrm{g}^1] = \frac{3}{4\rho} \frac{Q_{\textrm{abs}} + Q_{\textrm{sca}}}{a}, \end{equation*}](/articles/aa/full_html/2018/09/aa33386-18/aa33386-18-eq3.png) (2)
(2)
where a is either the grain radius for isolated grains or the volume equivalent radius for aggregates. The single scattering albedo can also be determined: Qsca∕(Qabs + Qsca). When considering non-spherical particles, the optical properties have to be averaged over several grain orientations relative to the incident radiation. Mishchenko & Yurkin (2017) made a thorough study of the conditions under which such calculations provide rigorous results. The ddscat routine has been constructed in order to facilitate the computation of orientational averages and meets the criteria given by Mishchenko & Yurkin (2017) provided enough grain orientations are considered (see Sect. 20 of Draine & Flatau 2013). In the following, when using ddscat, the optical properties have been averaged over 125 grain orientations as discussed in Köhler et al. (2012), which allows relatively fast calculations and gives sufficient accuracy for our purposes.
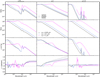 |
Fig. 5 Influence of grain shape for compact spherical (dotted lines), oblate (dashed lines), and prolate (solid lines) a-SilFe,FeS (left panels), a-C (middle panels), and a-C:H (right panels) grains with radius aV = 0.05, 0.1, and 1 μm plotted in black, blue, and fuchsia, respectively. Top bottom panels: Qabs(shape, λ), Qsca (shape, λ), κ(shape, λ), and the ratioof the latter to κ(sphere, λ) for a compact spherical grain with same mass. |
3 Extinction efficiency and dust mass opacity
In this section, we explore the effects of changing the dust size, composition, and structure on the absorption and scattering efficiencies and on the dust mass opacity. A few key parameters describing these quantities will be used. First, what will be called the threshold wavelength, which corresponds to the visible to near-IR wavelength above which the absorption efficiency sharply decreases. Second, variations in the spectral indices of Qabs, Qsca, and κ are discussed, all of them referring to the slope of the efficiencies between 100 and 500 μm. Finally, the dust mass opacities of altered grain structures are compared to that of a reference, volume-equivalent, compact sphere unless otherwise stated. The variations in the optical properties discussed in this section impact the dust temperature and far-IR emission (emissivity and spectral index).
3.1 Isolated grains
In this section we explore the size, porosity, and shape effects on the optical properties of isolated grains made of a-SilFe,FeS, a-C, and a-C:H materials. These results are then used as a reference point for aggregate dust properties.
3.1.1 Size effects
To explore the effect of grain size, we consider compact spheres with a = 0.05, 0.1, 0.5, 1, 2, 3, 4, and 5 μm (Fig. 3). The three material absorption efficiencies tend towards one at short wavelengths and decrease sharply beyond a certain threshold wavelength, which depends on both the material and the grain size. For a-C:H grains, it stagnates at 0.5 μm regardless of the size. This insulator-like behaviour is typical of high Eg semi-conductors, the band gap energy of which is high enough that there is no free-carrier absorption and the interband absorption occurs only at frequencies higher than the gap frequency: E(hν) > Eg(a-C:H) = 2.5 eV ⇔ λg ~ 0.5 μm. For a-C grains, the threshold wavelength varies from λ ~ 2πa to 2πa × 1.25 for 0.05 ≤ a ≤ 5 μm, independent of Eg (a-C) = 0.1 eV. In this case, the band gap energy is low and the grains can be considered as conductors for which free carrier absorption is important. The case of a-SilFe,FeS grains is intermediate. Indeed, the silicates used in the optical property calculations are rather insulating but they are doped by the inclusion of conductive Fe/FeS nano-particles6.
In the far-IR, as predicted by Mie theory, the three Qabs are proportional to a, whereas the Qsca are proportionalto a4 with Qabs(a-SilFe,FeS) ~ Qabs(a-C) ~ 105Qabs(a-C:H) and Qsca(a-SilFe,FeS) ~ Qsca(a-C) ~ 5Qsca(a-C:H). This agrees with the fact that insulators are not very reflective in the far-IR whereas conductors are rather bright. Figure 3 also presents the dust mass opacity κ normalised to that of a 0.1 μm sphere. For a-SilFe,FeS and a-C, there are almost no variations in the far-IR: Qabs ∝ a ≫ Qsca ∝ a4 and so κ ~ Qabs∕a does not depend on the grain size. On the contrary, for a-C:H, Qsca ≫ Qabs, meaning that κ(a-C:H) is proportional to a3 leading to strong variations.
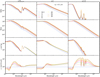 |
Fig. 6 Influence of the number of monomers for a-SilFe,FeS (left panels), a-C (middle panels), and a-C:H (right panels) aggregates made of compact spherical monomers with radius a0 = 0.1 μm and N = 1, 2, 4, 6, 8, 10, 12, 14, and 16 monomers plotted in blue, pink, green, fuchsia, red, yellow, silver, brown, and orange, respectively. Top bottom panels: Qabs (N, λ), Qsca (N, λ), the ratio of the latter to κ(N = 1, λ) for an isolated compact spherical grain with a = a0. |
3.1.2 Porosity effects
The effect of assuming porosity in a 0.1 μm spherical grain is shown in Fig. 4 for P = 0, 10, 20, 30, 40, and 50%. For the three materials, the threshold wavelength is shifted to shorter wavelengths, an effect already measured for semi-conductors and explained by quantum confinement in pores (Vorobiev et al. 2012). The global spectral variations of a-SilFe,FeS and a-C:H grains are similar. For wavelengths shorter than the threshold wavelength Qabs increases with P, whereas for longer wavelengths, in the visible range, Qabs decreases, an effect already observed for 1 μm silicate grains by Kirchschlager & Wolf (2013). The dust mass opacity increases at all wavelengths (Jones 1988) and we note that the far-IR spectral index does not depend on P. For P > 0%, linear relations between P and the increase in the far-IR κ can thus be found for these two materials (λ ≳ 100 μm):
![Mathematical equation: \begin{align}&\frac{\kappa[\textrm{porous \; a-Sil_{\textrm{Fe,FeS}}]}}{\kappa[\textrm{compact \; a-Sil_{\textrm{Fe,FeS}}}]} \sim 5.3 P + 0.9, \\ &\frac{\kappa[\textrm{porous \; a-C:H]}}{\kappa[\textrm{compact \; a-C:H}]} \sim 2.4 P + 0.9. \end{align}](/articles/aa/full_html/2018/09/aa33386-18/aa33386-18-eq4.png)
For a-C grains, the results are quite different. First, the effect of porosity is the same as for a-SilFe,FeS and a-C:H for wavelengths shorter than the threshold wavelength but it has almost no effect in the visible. Second, the far-IR spectral index of Qabs, Qsca, and κ does depend on porosity leading to a wavelength-dependent increase. This is due to the fact that, contrary to the two other materials, the real part of the a-C refractive index n is not constant in the mid- to far-IR.
3.1.3 Shape effects
Shape effects are shown in Fig. 5. Prolate and oblate compact grains with aspect ratio of two and aV = 0.05, 0.1, and 1 μm are compared to compact spheres of the same mass. Whatever the material, the threshold wavelength does not depend on the grain shape. For silicates, the dust mass opacity of spheroids at λ ≤ 10 μm increases by ~ 10% compared to spheres and by ~30% and ~35% for prolate and oblate grains, respectively, at longer wavelengths. Similar results were already found in previous studies (see, for instance, Voshchinnikov et al. 2000). Similarly, an increase is obtained for a-C grains, the main difference being the intensity of the increase and the fact that the far-IR spectral index of Qabs, Qsca, and κ does depend on the shape (lower index for spheroids than for spheres) leading to a wavelength-dependent increase. In the a-C:H case, the results are different: a small increase of ~5%, which does not depend on the size or wavelength, is found. The smaller amplitude of the increase can be attributed to the insulating behaviour of a-C:H grains compared to the conductor-like behaviour of a-C and a-SilFe,FeS grains (see Chap. 12 of Bohren & Huffman 1998 for detailed explanations).
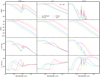 |
Fig. 7 Influence of monomer size for a-SilFe,FeS (left panels), a-C (middle panels), and a-C:H (right panels) aggregates of 16 compact spherical monomers with radius a0 = 0.05 μm in green, 0.1 μm in blue, 0.5 μm in fuchsia, and 1 μm in orange. Top bottom panels: Qabs(a0, λ), Qsca (a0, λ), κ(a0, λ), and the ratioof the latter to κ(a0, λ) for an isolated compact spherical grain with the same radius as the monomers composing the aggregate. |
3.2 Aggregates
In this section, we explore the effects of the number, size, porosity, and shape of the monomers composing an aggregate.
3.2.1 Monomer number effects
Figure 6 presents the optical properties of aggregates made of 2 ≤ N ≤ 16 compact spherical monomers with a0 = 0.1 μm. Behaviours already described in Sect. 3.1 are found. Firstly, for a-SilFe,FeS and a-C aggregates, the Qabs threshold wavelength increases with N up to the threshold wavelength of the compact mass-equivalent sphere7. Second, for the insulating a-C:H aggregates, the threshold wavelength stalls at λg = 0.5 μm ⇔ Eg = 2.5 eV as for compact spheres. However, the κ increase in the far-IR appears to be more reminiscent of the porous spheres: indeed, the increase is at constant spectral index for a-SilFe,FeS and a-C:H in contrast to a-C. It should be possible to draw a parallel between the “intrinsic” porosity of the spheres, P, and the “false” porosity induced by coagulation,  . Following the definition of aggregate porosity given by Kozasa et al. (1992), for N = 4,
  ~ 35% and for 6 ≤ N ≤ 16,
  ~ 50–60%. Comparing Figs. 4 and 6, the increase in κ seems much smaller for aggregates than for porous spheres. This is just the consequence of the different material densities used in the κ ∝ 1∕ρ calculations:for the aggregates we used the bulk material density, whereas for porous spheres it is reduced by the porosity. So the far-IR increase seems to be dominated by induced porosity effects while the behaviour at short wavelengths appears to depend on the mass equivalent size of the aggregate. In particular, there is no blueshift of the threshold wavelength between an isolated grain and an aggregate.
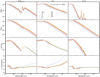 |
Fig. 8 Influence of porosity for a-SilFe,FeS (left panels), a-C (middle panels), and a-C:H (right panels) aggregates made of porous spherical monomers with radius a0 = 0.1 μm, P = 20%, and N = 1, 2, 4, 6, 8, 10, 12, 14, and 16 monomers plotted in blue, pink, green, fuchsia, red, yellow, silver, brown, and orange, respectively. Top bottom panels: Qabs (N, λ), Qsca (N, λ), κ(N, λ), and the ratioof the latter to κ(N, λ, P = 0%) for aggregates made of compact spherical monomers with radius a0 = 0.1 μm. |
3.2.2 Monomer size effects
Figure 7 shows the optical properties of aggregates made of 16 monomers with a0 = 0.05, 0.1, 0.5, and 1 μm. The absorption threshold wavelength depends on the mass equivalent size of the aggregates for all monomer sizes and materials. We note that for a-SilFe,FeS and a-C aggregates, the κ increase in the far-IR, dominated by the increase in absorption, is a direct reflection of the porosity induced by coagulation. For a-C:H, in the case of the biggest monomers Qabs ≪ Qsca and the κ increase becomes size dependent.
3.2.3 Porous monomers effects
Figure 8 shows the optical properties of aggregates made of 0.1 μm porous monomers (P = 20%) for N = 1–16 compared toaggregates of compact monomers. The results are almost the same as for porous vs. compact isolated grains with similar enhancement factors for the far-IR dust mass opacity.
3.2.4 Monomer shape effects
The influence of monomer shapes on aggregate optical properties is presented in Fig. 9. Wu et al. (2016) have already studied the optical properties of soot aggregated with spheroidal monomers in the visible wavelength range, 0.44≤ λ ≤ 1 μm, for a0 = 0.01, 0.02, and 0.03 μm, aspect ratios from 1/3 to 3, N = 100, and Df = 1.8–2.8. Wu et al. (2016) found differences between aggregates made of spheroidal and spherical monomers: an increase in both Qabs and Qsca by ~ 5% for aspect ratios of 1/2 and 2. We confirm this trend in the visible wavelength range for both oblate and prolate monomers.
At longer wavelengths, Qabs and Qsca are higher for aggregates made of prolate monomers than oblates. However, when comparing the dust mass opacities of aggregates of spheroids and aggregates of spheres, strong variations are found. First, for aggregates made of prolate monomers, an increase is found in thefar-IR (see also Sect. 3.3 and Fig. 11 for a detailed discussion about κ variations at 250 μm). This increase can be explained by two factors. As seen in the previous section, isolated prolate grains have higher κ in the far-IR than isolated spherical grains so it not surprising to again find this characteristic when the grains are aggregated. Then, aggregates made of prolate monomers have higher false porosities than aggregates made of spheres:  40–50% for spheres and 50–60% for prolates. We also notice that the increase between aggregates of spheres and aggregates of prolates is lower than the increase between isolated spheres and prolates. Indeed, on average, aggregates have a smaller eccentricity than isolated prolates and it has been shown that this difference increases with eccentricity (e.g. Voshchinnikov et al. 2000). Second, for aggregates made of oblate monomers, a decrease is found in the far-IR compared to aggregates of spheres (see also Sect. 3.3 and Fig. 11), even though they exhibit high
  values from 70% to 80%. Following Kozasa et al. (1992), a surface-area equivalent radius can be estimated as
 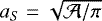 , where
  is defined as the projected area of the aggregate averaged over three orthogonal directions. Compared to aggregates of spheres, aS for aggregates of prolate monomers are ~10% smaller while they are ~30% bigger for aggregates of oblate monomers. Since κ is proportional to Qext which is itself proportional to
  , this explains why aggregates of oblates have lower dust mass opacities. Nonetheless the big differences due to variations in monomer shapes should, be mitigated. Indeed, since in our aggregates the monomer principal axes are all aligned (see Sect. 2.2), and all the monomers have the same axis ratio, the variations emphasised here represent upper limits of the effect of having non-spherical monomers in the aggregates.
A final interesting point concerns the spectral index of κ in the far-IR for a-C grains, which is dominated by absorption. As seen in Figs. 6 and 7, the coagulation of spheres leads to a flattening of κ. Figure 9 shows that this also remains true for spheroids but that this flattening is weaker. For 100 ≤ λ ≤ 200 μm, the difference in slopes is ~0.05 and 0.1 for a-C prolate and oblate monomers, respectively.
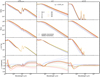 |
Fig. 9 Influence of the monomer shape for a-SilFe,FeS (left panels), a-C (middle panels), and a-C:H (right panels) aggregates made of compact spheroidal monomers with aV = 0.05 μm, aspect ratiosof 2, and N = 1, 2, 4, 6, 8, 10, 12, 14, and 16 monomers plotted in blue, pink, green, fuchsia, red, yellow, silver, brown, and orange, respectively. Solid lines show aggregates made of oblate monomers and dashed lines of prolate monomers. Top bottom panels: Qabs (N, λ), Qsca (N, λ), κ(N, λ), and the ratioof the latter to κ(N) for aggregates made of compact spherical monomers with radius a0 = 0.05 μm. |
3.2.5 Mixed monomer size effects
Finally, Fig. 10 shows the effect of building an aggregate out of monomers with different radii. A similar study was already undertaken by Liu et al. (2015) in which soot aggregates composed of 50–500 monomers with a0 ~ 33(45) ± 1.3(1.1) nm with Df = 1.8 were considered. The calculations were made in the visible (λ = 0.65 μm) and showed that, even if the monomers had very close sizes, both the scattering and absorption efficiencies were higher than in the case of aggregates made of monomers of same size with the same total mass. Köhler et al. (2012) consider the case of aggregates composed of one big a0 = 60 nm monomer surrounded by 250–2000 smaller monomers with a0 = 3.5 nm. Their results were similar to those of Liu et al. (2015) with an increase in the absorption efficiency both in the visible and far-IR wavelength ranges. Figure 10 presents the case where there are only four monomers but of larger sizes: a1 = 0.05 μm and a2 = 0.1 or 0.5 μm. In the a2∕a1 = 10 case, the smallest monomers always represent less than 1% of the total aggregate volume for all the structures considered and in the a2 ∕a1 = 2 case, they represent 4–27% of the volume, proportions close to those in Köhler et al. (2012) and Liu et al. (2015). As in the two previous studies, both Qabs and Qsca are increased and the increase is larger when more small monomers are incorporated into the aggregate which can be likened to an increase of the monomer surface irregularity. This result holds for all three of the aggregate compositions considered.
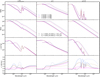 |
Fig. 10 a-SilFe,FeS (left panels), a-C (middle panels), and a-C:H (right panels) aggregates made of compact spherical monomers with radius a1 = 0.05 μm and a2 = 0.1 (solid lines) or 0.5 μm (dashed lines), and N = 4. Plotted in blue are the results for aggregates made of three grains with a0 = a1 and one grain with a0 = a2, in fuchsia one grain with a0 = a1 and three grains with a0 = a2, and in green two grains of each radius. Top to bottom panels: Qabs(a2, λ), Qsca (a2, λ), κ(a2, λ), and the ratioof the latter to κ(a = a2) for an isolated compact spherical grain with radius a = a2. |
3.3 Far-IR dust mass opacity
A far-IR dust mass opacity (emissivity) enhancement is observed towards many dense molecular clouds where dust growth is expected (Martin et al. 2012; Suutarinen et al. 2013; Roy et al. 2013; Rawlings et al. 2013; Remy et al. 2017, among many others). Mass opacity estimates from models are also commonly used to derive dust masses and temperatures from astronomical far-IR data. As κ depends on the dust composition, size, and structure, we investigate the influence of these three parameters. Figure 11 shows dust mass opacities at 250 μm for aggregates made of compact and porous spherical monomers, and of oblate and prolate compact monomers, as a function of the number of monomers.
For aggregates made of compact spheres, we see that for a-SilFe,FeS and a-C grains, the increase in κ does not depend on the monomer size a0 but only on the number of monomers N. The surface-volume ratio of the aggregates can be estimated by aS∕aV and is found to depend only on N, not on a0. Then, similar to Koehler et al. (2011), we find that the increase in κ for N ≥ 6−8 saturates at ~1.8 ± 0.2 for a-SilFe,FeS grains and ~3.3 ± 0.7 for a-C grains, which means that the aggregate total opacity is not proportional to the sum of the monomer opacities. The threshold at N ~ 6−8 matches the monomer number above which aS < aV, and thus the saturation is explained by the shadowing effects of the aggregate cross sections as described in Jones (2011). The “intensity” of the shadowing is roughly proportional to the number of monomers. In the case of aggregates made of a-C:H grains, the results are similar for a0 = 0.05 and 0.1 μm with a κ increase ~1.1 ± 0.1 for N ≥ 6−8. However, for larger monomer radius, a strong increase in the far-IR κ is found which is due to the subordination of the absorption to the scattering efficiency as already shown in Fig. 7.
When porous monomers are considered, the behaviour of the increase in κ as a function of N is similar to the case of compact monomers consistent with the behaviour for N > 6 observed in Fig. 11 for aggregates made of porous vs. compact monomers. The κ increase is ~ 1.45 ± 0.25, ~ 2.1 ± 0.5, and ~ 1.3 ± 0.2, for a-SilFe,FeS, a-C, and a-C:H aggregates, respectively. This matches the increase found between isolated compact and porous spheres presented in Fig. 4.
For aggregates made of compact spheroids compared to aggregates made of compact spheres, as shown in Sect. 3.2, the variations depend on the shape of the monomers. For aggregates made of prolate monomers, we find an increase of ~ 1.3 ± 0.1, ~ 1.3 ± 0.2, and ~ 1.05 ± 0.05 for a-SilFe,FeS, a-C, and a-C:H grains, respectively. For aggregates made of oblate monomers, a decrease of ~ 0.8 ± 0.1, ~ 0.8 ± 0.1, and 1.00 ± 0.02 is found for a-SilFe,FeS, a-C, and a-C:H grains, respectively. Consequently, if the aggregates were built out of a distribution of spheroids and not only prolate or oblate monomers, on average their far-IR dust mass opacities would be close to that of an aggregate made of spheres in the far-IR.
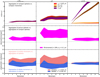 |
Fig. 11 a-SilFe,FeS (left panels), a-C (middle panels), and a-C:H (right panels) aggregate normalised dust mass opacities at 250 μm as a functionof the number of monomers composing the aggregates, N. Top row: κ(a0, N) for a0 = 0.05 (red), 0.1 (orange), 0.5 (brown), and 1 μm (purple) normalised to κ(a0, N = 1). Middle row: κ(a0 = 0.1 μm, N, P = 20%) normalised to κ(a0 = 0.1 μm, N, P = 0%). Bottom row:κ(oblate monomers, N) in blue and κ(prolate monomers, N) in pink normalised to κ(spherical monomers, N). The filled areas show the scatter of the dust mass opacities for ten randomly chosen aggregate shapes (see Sect. 2.2). |
4 Silicate mid-IR spectral features
The amorphous silicate mid-IR spectral features (10 μm Si–O stretching mode and 18 μm O–Si–O bending mode) are often used as a diagnostic to determine the dust composition and size in a variety of astronomical environments, ranging from the diffuse ISM to the Galactic centre, as well as from AGB star envelopes to protoplanetary disk (see, for instance, the review by Henning 2010). First, if aV ≥ 1 μm, the contrast between the continuum and the two features decreases strongly, as can be seen in Figs. 3 and 7, independent of the detailed grain structure (aggregate or isolated grain). Consequently, it would be very hard to detect and thus to use observations of the silicate bands in absorption to prove the presence of grains larger than 2 μm in dense media. However, the detailed study of the peak positions, shapes and ratio of the two bands may be used to constrain the population of grains with a ~ 0.5−1 μm, together with complementary observations of light scattering by grains at shorter wavelengths. Second, Fig. 12 shows the peak positions, λ10 and λ18, and the full widths at half maximum, FWHM10 and FWHM18, of the 10 and 18 μm silicate extinction features8, respectively, for the isolated grains and aggregates described in this study. Also shown are the ratios of the κ values at the peak positions of the two features, R10∕18 = κ(λ10)∕κ(λ18). Both λ and FWHMdepend strongly on the grain structure as already shown by various authors with different descriptions of grain irregularities: distributions of hollow spheres, Gaussian random field particles, porous grains, spheroidal grains, spherical or spheroidal grains with increasing sizes (Bouwman et al. 2001; Kemper et al. 2004; Min et al. 2007; van Breemen et al. 2011, among others).
For isolated spherical grains, both λ10 and FWHM10 are almost constant as long as a < 1 μm and increase for larger particles. Indeed, above a ~ 1 μm, the extinction band has a significant contribution from the scattering (Qsca ~ Qabs), whereas at smaller sizes the band profile depends only on the absorption. For non-spherical grains, the feature is red-shifted with a slightly smaller FWHM10. A red-shift of the feature with increasing porosity is also observed at constant FWHM10. Interestingly, because the aggregate far-IR κ can be related to the aggregate false porosity (Sect. 3.2), so can the increase in λ10 of aggregates relative to λ10 for the mass equivalent spheres. Moreover, as for isolated grains, the aggregate λ10 and FWHM10 are almost constant as long as the aggregate mass equivalent sizes are smaller than 1 μm but increase for larger sizes. However, both increases are smaller in the case of aggregates than in the case of isolated grains with Δ λ10 = −0.4 μm and Δ FWHM10 = −0.25 μm for aV = 2 μm. The shape of the monomers composing the aggregates has little influence on the 10 μm feature shape with a shift smaller than ~0.05 μm of the peak position for all aV and no variations in FWHM10.
Variations in λ18 and FWHM18 are appreciably different. For isolated spherical grains, λ18 increases when a > 1 μm but FWHM18 decreases for a ≥ 0.5 μm with a shift Δ FWHM18 ~−0.3 μm from a = 0.1 to 1 μm. Contrary to the 10 μm feature, the scattering contribution to the 18 μm extinction feature remains negligible even at a= 1 μm. A decrease is also found for spheroids with Δ FWHM18 ~−0.5 μm for aV = 0.05–1 μm. As for the 10 μm feature, a red-shift and a broadening of the 18 μm feature with increasing porosity is observed. However, the variations are stronger with Δ λ18 ~ 0.6 μm and Δ FWHM18 ~ 3 μm for P = 0–50%. For aggregates, there is a clear difference in the variations in the two features, the strongest one being the dependence of both λ18 and FWHM18 on the monomer size a0 rather than on the mass equivalent size aV. For a0 = 0.05 and 0.1 μm, the peak position λ18 does not vary significantly and can be related to the aggregate false porosity as can be λ10. But when larger monomers are considered, the increase in λ18 is no longer monotonous with aV. The dependence of FWHM18 on the monomer size is conspicuous for all a0 considered. Monomer shapes also influence the feature: when compared to aggregates of spheres, in the case of prolate monomers Δ λ18 ~ 0.4 μm and Δ FWHM18 ~ 2 μm for aV = 0.1 μm but Δ λ18 ~ 0 μm and Δ FWHM18 ~−0.7 μm in the case of oblate monomers for the same aV. The O–Si–O 18 μm bending mode is thus more dependent on the grain detailed structure than the Si–O 10 μm stretching mode, both in peak position and width or spectral shape (see Figs. 6, 7, and 9).
For isolated grains, the ratios of the κ values at the peak positions of the two mid-IR features, R10∕18, are almost constant for the smallest grains: variations of less than 5% are found for 0.05 ≤ a ≤ 0.5 μm, less than 3% when porosity is introduced (P = 10 to 50%), and less than 2% when oblate and prolate grains are considered instead of spheres. For larger grains, the variations are stronger and not monotonous. For compact spheres with a = 1−3 μm, increases of 17%, 18%, and 9% are found, respectively, with respect to a 0.05 μm sphere. The results are similar for aggregates: R10∕18 varies only by ~3–5%, in comparison with a 0.05 μm sphere, for monomers with a0 = 0.05 and 0.1 μm, porous or compact, spherical or spheroidal. Significant variations appear for larger monomers: an increase of ~ 10% for a0 = 0.5 μm spherical monomers, and for a0 = 1 μm, an increase up to 15% when N = 2 and down to 2% for N = 16. As λ18 and FWHM18, R10∕18 thus depends on the monomer size. The increase in R10∕18 for large aV comes from the increasing contribution of scattering tothe 10 μm extinction feature. The decreasing ratios found with increasing aV and a for the largest aggregates and isolated grains considered are due to the fact that for these sizes the 20 μm feature keeps on increasing, whereas the 10 μm feature saturates.
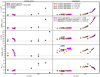 |
Fig. 12 Peak positions, λ10 and λ18 (first and third rows), full widths at half maximum, FWHM10 and FWHM18 (second and fourth rows), and ratios of the dust mass opacities of the mid-IR silicate features, R10∕18 (bottom row), for isolated grains (left column) and aggregates (right column). λ, FWHM, andR10∕18 are plotted as a function of the radius of a compact sphere with same mass for compact spheres (black circles), porous spheres (fuchsia squares), prolate grains (blue triangles), oblate grains (coral triangles), and aggregates of compact spheres with a0 = 0.05 (red circles), 0.1 (orange circles), 0.5 (brown circles), 1 μm (purple circles), aggregates of porous spheres with P = 20% and a0 = 0.1 μm (fuchsia squares), aggregates of prolate monomers with a0 = 0.05 μm (blue triangles), and aggregates of oblate monomers with a0 = 0.05 μm (coral triangles). The horizontal black dashed lines show λ, FWHM, andR10∕18 of the smallest isolated compact sphere. |
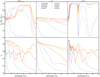 |
Fig. 13 Influence of size for compact spherical a-SilFe,FeS (left panels), a-C (middle panels), and a-C:H (right panels) grains with radius a = 0.05, 0.1, 0.5, 1, 2, 3, 4, and 5 μm plotted in pink, blue, green, fuchsia, red, yellow, brown, and orange, respectively. Top panels: albedo Qsca ∕(Qabs + Qsca). Bottom panels: asymmetry factor of the phase function g = ⟨cos θ⟩. |
5 Albedo and asymmetry factor
One way of probing grain growth in dense interstellar media is the measure of scattered light from the visible to the near- and mid-IR, known as cloudshine and coreshine. The amount of scattered light reaching an observer depends, at least, on the dust albedo and phase function. In this section, we focus on the grain scattering properties, showing single scattering albedos, Qsca∕Qext, and the asymmetry factors of the phase function, g = ⟨cos θ⟩, for isolated grains and aggregates of a-SilFe,FeS, a-C, and a-C:H.
Figure 13 shows the scattering properties of compact spherical grains. For a-SilFe,FeS grains, at very short wavelengths the albedo is about 0.5, reflecting the fact that absorption and scattering efficiencies are each close to one. A sharp increase in the albedo occurs at a given wavelength corresponding to the first interference peak position in the scattering efficiency (“bump” in the Qsca plots related to interference between incident light and backward-scattered light). This wavelength depends on both grain size and composition. For the a-SilFe,FeS grains, it goes from ~0.2 to 7 μm for 0.05 ≤ a ≤ 5 μm. For a ≥ 0.5 μm, the albedo remains rather high before decreasing due to absorption in the 10 μm band. For a-C grains, absorption and scattering have similar amplitudes and no spectral features from the near- to mid-IR for a ≥ 0.5 μm so the albedo stays around 0.5 over the entire wavelength range. For a-C:H grains, the extinction is dominated by scattering and the albedo is equal to one except at the mid-IR band positions in the 3.3–3.4 μm and 7–9 μm regions. As detailed in Jones et al. (2016, see their Sect. 2.2), the subordination of absorption to scattering can be explained by Anderson localisation of absorbing electrons which occurs in disordered (amorphous) materials (Anderson 1958).
For the three materials, the asymmetry parameter variations with grain size are classical: isotropic scattering for the smallest grains and dominant forward scattering for the biggest for λ ≥ 1 μm. The effect of porosity for isolated grains is very small with only a 0.1 μm blueshift of the sharp increase in albedo (Fig. 14), which matches the shift observed in the absorption efficiency when P goes from 0 to 50% (Fig. 4). Figure 15 shows albedos and asymmetry factors for spheroids, which are very similar to those of spheres. This is consistent with the findings of Mishchenko et al. (1996) for low-k materials and extends it to highly absorbing materials such as a-C. Our results also agree with Voshchinnikov et al. (2000) who showed that the difference in albedo between spheres and spheroids remains small in the visible as long as k∕n ≳ 0.2−0.3, even for aspect ratios up to ten.
The scattering properties of aggregates made of compact spheres are shown in Fig. 16. Aggregate albedos are almost exactly the same as albedos of compact spheres with same mass and do not depend on the monomer size. For instance, aggregates made of two 0.1 (1) μm monomers and of sixteen 0.05 (0.5) μm monomers have the same mass, and thus the same aV, and exhibit very similar albedos (see orange squares and pink triangles, respectively, in Fig. 16). On the contrary, the asymmetry factor of the phase function depends on the monomer size: two aggregates of same mass but with different monomer radius have a ~0.1 difference ing values in favour of more forward scattering for the aggregate with the smallest monomers. Figure 17 shows albedos and asymmetry factors for aggregates made of compact spheroids. From the visible to the near-IR, the albedos of aggregates made of spherical, oblate, and prolate monomers do not differ by more than 5%. Variations in the asymmetry factors are bigger with an increase of ~5% and 10% at λ = 0.55 μm for aggregates of prolate and oblate monomers, respectively, and of ~25% and 10% at λ = 1.63 μm. Our results agree with the results of Wu et al. (2016) for Df = 2.8 at λ= 0.87 μm (green curves in their Fig. 7).
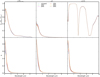 |
Fig. 14 Influence of porosity for spherical a-SilFe,FeS (left panels), a-C (middle panels), and a-C:H (right panels) grains with radius a = 0.1 μm and porosity degree P = 10, 20, 30, 40, and 50% plotted in blue, green, pink, red, yellow, and brown, respectively. Top panels: Qsca ∕(Qabs + Qsca). Bottom panels: g = ⟨cos θ⟩. |
6 DDA vs. approximate light scattering models
The DDA method is very convenient thanks to its high flexibility in terms of grain geometry and composition but computation time can be quite long. It is thus always convenient to be able to minimise at least part of the calculations using approximate methods such as an effective medium theory (EMT). Mishchenko et al. (2016a,b) already showed that EMT can provide accurate estimates of the scattering matrix and absorption cross-section of heterogeneous grains (i.e. grains with inclusions or porous grains) if two criteria are met: both the size parameter of the inclusions and the refractive index contrast between thehost material and the inclusions have to be small. In this section, we compare our results for aggregates with results obtained for spheres with average dielectric functions estimated using the Maxwell Garnett (MG) mixing rules(Bohren & Huffman 1998; Maxwell Garnett 1904) and Mie theory, referred to as MG+Mie in the following9. We assume that a grain consists of a sphere of a-SilFe,FeS, a-C, or a-C:H, with spherical vacuum inclusions. The MG sphere radius, aC, is defined as the radius of the homogeneous sphere with the same radius of gyration, Rg, as the corresponding aggregate (Kozasa et al. 1992):

where r0 is the position vector of the aggregate mass centre and ri is the position vector of the ith monomer centre. The vacuum inclusion fraction or porosity can then be defined as
 (7)
(7)
Figure 18 shows the example of MG+Mie calculations with two aggregates made of eight compact spherical monomers with a0 = 0.1 and 1 μm calculates using DDA. The MG+Mie spheres have aC = 0.28 and 2.9 μm and  = 60 and 65%, respectively. Also shown are the optical properties for compact spheres with the same mass, with aV = 0.2 and 2 μm, respectively, which reproduce correctly both the threshold wavelength and the shape of the 10 μm silicate band but are not good analogues otherwise (similar results in, e.g., Tazaki & Tanaka 2018).
For a-SilFe,FeS aggregates, the MG+Mie grains reproduce almost perfectly the far-IR Qabs but underestimate Qsca by 30–40% in this same wavelength range. Similar discrepancies, up to a few tens of percent depending on the wavelength range, were found by Min et al. (2016) for aggregates made of spherical monomers with aV = 0.2–4 μm. The MG+Mie grains also fail to reproduce the mid-IR spectral features which was expected according to Fig. 12 and the threshold wavelengths which are blueshifted. This shift due to the inclusion of porosity in the MG+Mie grain matches the shifts observed in Fig. 4 for isolated porous grains. This results in an underestimate of Qabs by factors greater than 1.5 for 0.2 ≤ λ ≤ 1 μm and a0 = 0.1 μm and greater than 2 for 2 ≤ λ ≤ 8 μm and a0 = 1 μm. The scattering efficiency is also underestimated even if to a lesser extent. The MG+Mie grain albedos are close to aggregate albedos in the mid-IR when a0 = 0.1 μm but overestimated by ~20% when a0 = 1 μm. Similarly, for the smallest monomer size, the asymmetry parameter is well estimated by MG+Mie but for bigger monomers, it is overestimated by ~ 40% in the 2–4 μm wavelength range, and by 15–20% at longer mid-IR wavelengths. For a-C and a-C:H aggregates, the discrepancies are similar except for the far-IR Qabs, which is not as well reproduced by MG+Mie as for a-SilFe,FeS grains and is underestimated by 10–50%, and we even note differences in the spectral index for a-C grains. Differences in the spectral index can be explained by the inclusion of porosity, as described in Sect. 3.1 (Fig. 4).
Over the years, many approximate methods have been developed and tested against numerically exact calculations such as DDA or the T-matrix method (TMM; Mackowski & Mishchenko 1996). A thorough comparison of many of these methods was recently undertaken by Tazaki & Tanaka (2018) for silicate aggregates. Seven usual approximate methods were confronted: the Rayleigh–Gans–Debye theory (Tazaki et al. 2016), the mean field theory (Berry & Percival 1986; Botet et al. 1997), the MG+Mie theory (Mukai et al. 1992; Kataoka et al. 2014), the Mie theory with aggregate polarisability mixing rules (APMR Mie; Min et al. 2008), the MG+Mie with the simple percolation model (Henning & Stognienko 1996), the distribution of hollow spheres (DHS; Jones 1988; Min et al. 2016), and the continuous distribution of ellipsoids (CDE; Bohren & Huffman 1998). All these methods suffer from discrepancies when compared to DDA or TMM calculations (see Figs. 5and 10 in Tazaki & Tanaka 2018). In particular, they all fail to reproduce κabs and/or κsca at short wavelengths, implying a poor resemblance of the albedo from the visible to the mid-IR range. To lift these inconsistencies, Tazaki & Tanaka (2018) developed a modified mean field theory (MMF) which accounts for both κabs and κsca at λ ≲ 20 μm. At longer wavelengths, Tazaki & Tanaka (2018) point out that approximate methods underestimate the far-IR to submm opacity, except the DHS and APMR Mie approaches which slightly overestimate it. The underestimate is simply explained by the fact that in the approximate methods, the emissivity enhancement due to grain-grain contact area in aggregates (Koehler et al. 2011) is not taken into account. The overestimate of the DHS and APMR Mie methods is to be nuanced as this mostly depends on the contact surface area chosen in the exact calculations that were used to calibrate the approximate calculations.
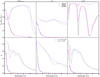 |
Fig. 15 Influence of shape for spherical (black), oblate (blue), and prolate (magenta) a-SilFe,FeS (left panels), a-C (middle panels), and a-C:H (right panels) grains with radius aV = 0.1 and 1 μm, solid and dashed lines, respectively. Top panels: Qsca∕(Qabs + Qsca). Bottom panels: g = ⟨cos θ⟩. The asymmetry factor curves appear smoother because the calculations were made for lesser wavelength points. |
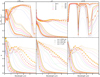 |
Fig. 16 Influence of monomer size and number for a-SilFe,FeS (left panels), a-C (middle panels), and a-C:H (right panels) aggregates made of compact spherical monomers with radius a0 = 0.05 (dotted lines), 0.1 (solid lines), 0.5 (dashed lines), and 1 μm (dot-dashed lines) and N = 1, 2, 4, 6, 8, 10, 12, 14, and 16 monomers plotted in blue, pink, green, fuchsia, red, yellow, silver, brown, and orange, respectively. Top panels: Qsca∕(Qabs + Qsca). Bottom panels: g = ⟨cos θ⟩. Aggregates with N = 16 and a0 = 0.05 and 0.5 μm are also highlighted with triangles, while aggregates with N = 2 and a0 = 0.1 and 1 μm are highlighted with squares. |
7 Conclusion
The aim of this paper is to investigate the effects of varying the dust grain structure, the starting point being the perfect compact sphere, on the unpolarised optical properties for grains of a-SilFe,FeS, a-C, and a-C:H. We find that these changes affect the entire wavelength range, from the visible to the far-IR, either by increasing or decreasing the extinction efficiency, spectrally shifting the threshold wavelength above which the absorption efficiency sharply decreases, changing the far-IR dust mass opacity spectral index, all of these effects depend on the material type and the grain structure.
For instance, in the case of isolated compact spherical grains, the threshold wavelength does not only depend on the grain size but also on the insulator or conductor-like behaviour of the material. When porosity is introduced into the grain, whatever the grain composition, for wavelengths shorter than the threshold wavelength Qabs increases while the dust mass opacity increases over the entire wavelength range. For materials having the real part n of their refractive index constant in the far-IR (a-SilFe,FeS and a-C:H), the increase does not depend on the wavelength and varies linearly with P. For material with increasing n in the far-IR (a-C), the dust mass opacity becomes flatter as P increases. The influence of porosity on the albedo remains small for all materials. Similarly, non-sphericity has no influence on the albedo. However, it results in an increase in the dust mass opacity at all wavelengths for the three materials considered, this increase being stronger for conductors than for insulators.
In the case of aggregates made of compact spherical monomers, the threshold wavelength depends on aV, the radius of a compact sphere with same mass, whereas the far-IR dust mass opacity increase is a reflection of the porosity induced by coagulation. For a-SilFe,FeS and a-C grains, the κ increase does not depend on the monomer size a0 but only on the number of monomers N and saturates for N ≥ 6−8, which can be explained by shadowing effects of the aggregate cross-sections. For a-C:H aggregates, the subordination of absorption to scattering implies that the far-IR κ increase depends on both N and a0. For all grain compositions, the albedo does not depend on a0 but on aV, whereas on the contrary the asymmetry factor of the phase function g depends on a0, with more forward scattering for smaller monomers. If the aggregates are composed of spheroids instead of spheres, both Qabs and Qsca increases in the visible. The strongest differences between aggregates made of spheres and spheroids are found in the far-IR. For prolate monomers, κ increases whereas for oblate monomers, it decreases, which can be explained by different surface shadowing effects. Albedo is not significantly affected by the monomer shape from the visible to the near-IR but the asymmetry factor varies by 5–25% in this same wavelength range. Then, in the case of aggregates made of spheres with different radii, the increases in Qabs and Qsca are stronger than in the case where the monomers have the same radius. The increases are enhanced for more numerous and smaller monomers, which can be seen in terms of increasing the aggregate surface irregularity.
Finally, the silicate mid-IR features at 10 and 18 μm depend on the grain structure. For isolated grains, starting from compact spherical grains, both features are redshifted and broadened for increasing grain size as long as a ≥ 1 μm and for increased porosity irrespective of their size. Isolated oblate and prolate grains also see their features redshifted but the 10 μm feature is broadened whereas the 18 μm is narrowed. In the case of aggregates of increasing aV, we find again the limit of aV ≥ 1 μm for significant changes in the features to appear. Then, the 10 μm feature characteristics depend only on aV, whereas the 18 μm feature depends alsoon a0. Monomer shapes do not influence the 10 μm feature but can change both the peak position and width of the 18 μm feature. Both the peak position and the width/spectral shape of the 18 μm feature are more dependent on the grain detailed structure than the 10 μm feature.
Making use of the results of this study, a new realistic aggregate dust model based on THEMIS (Jones et al. 2017), including ice mantles and material mixing, will be the object of a forthcoming paper in line with the model presented in Koehler et al. (2015). To conclude, we would like to stress the importance of taking into account the detailed grain structures for optical property calculations. Even if some promising approximate methods do exist, none of them is able to mimic the entire range of variations at all wavelengths induced by structural variations.
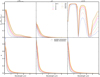 |
Fig. 17 Influence of monomer shape for a-SilFe,FeS (left panels), a-C (middle panels), and a-C:H (right panels) aggregates made of compact spheroidal monomers with radius a0 = 0.05 μm, aspect ratiosof 2, and N = 1, 2, 4, 6, 8, 10, 12, 14, and 16 monomers plotted in blue, pink, green, fuchsia, red, yellow, silver, brown, and orange, respectively. Solid lines show aggregates made of oblate monomers, dashed lines of prolate monomers, and dotted lines made of spherical monomers. Top panels: Qsca ∕(Qabs + Qsca). Bottom panels: g = ⟨cos θ⟩. |
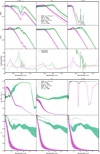 |
Fig. 18 Comparison of the optical properties of an aggregate made of 8 monomers calculated with DDA and with an equivalent using Mie theory using EMT (see Sect. 6 for details) for a-SilFe,FeS (left panels), a-C (middle panels), and a-C:H (right panels) grains. From top to bottom panels: Qabs, Qsca, the ratio of the two previous quantities calculated with DDA vs. EMT, the albedo, and the asymmetry factor of the phase function. The solid lines are the DDA optical properties for a0 = 0.1 (magenta) and 1 μm (green). The filled areas show the scatter of the dust properties for ten randomly chosen aggregate shapes (see Sect. 2.2). The crosses show the Mie calculations for the compact sphere of equivalent mass (a = aV). The empty circles show the Mie calculations using optical constants obtained through EMT. |
Acknowledgements
We would like to thank L. Verstraete for fruitful discussions about dust optical properties. We also thank B. Draine and V. Ossenkopf for making their sofwares for optical property calculations publicly available. Finally, we thank our referee, M. Mishchenko, for his careful reading and interesting remarks and comments that helped to improve the manuscript. This research was, in part, made possible through the EU FP7 funded project DustPedia (grant No. 606847). It was also supported by the Programme National PCMI of CNRS/INSU with INC/INP co-funded by CEA and CNES.
References
- Anderson, P. W. 1958, Phys. Rev., 109, 1492 [NASA ADS] [CrossRef] [Google Scholar]
- Bazell, D., & Dwek, E. 1990, ApJ, 360, 142 [NASA ADS] [CrossRef] [Google Scholar]
- Berry, M. V., & Percival, I. C. 1986, Opt. Acta, 33, 577 [NASA ADS] [CrossRef] [Google Scholar]
- Bohren, C. F., & Huffman, D. R. 1998, Absorption and Scattering of Light by Small Particles (New York: John Wiley-VCH Verlag GmbH), 544 [Google Scholar]
- Botet, R., Rannou, P., & Cabane, M. 1997, Appl. Opt., 36, 8791 [NASA ADS] [CrossRef] [Google Scholar]
- Bouwman, J., Meeus, G., de Koter, A., et al. 2001, A&A, 375, 950 [NASA ADS] [CrossRef] [EDP Sciences] [Google Scholar]
- Doner, N., & Liu, F. 2017, J. Quant. Spectr. Rad. Transf, 187, 10 [NASA ADS] [CrossRef] [Google Scholar]
- Doner, N., Liu, F., & Yon, J. 2017, Aerosol Sci. Technol., 51, 532 [NASA ADS] [CrossRef] [Google Scholar]
- Draine, B. T. 1988, ApJ, 333, 848 [NASA ADS] [CrossRef] [Google Scholar]
- Draine, B. T., & Flatau, P. J. 1994, J. Opt. Soc. Am. A, 11, 1491 [NASA ADS] [CrossRef] [Google Scholar]
- Draine, B. T., & Flatau, P. J. 2013, ArXiv e-prints [arXiv:1305.6497] [Google Scholar]
- Fogel, M. E., & Leung, C. M. 1998, ApJ, 501, 175 [NASA ADS] [CrossRef] [Google Scholar]
- Foster, J. B., & Goodman, A. A. 2006, ApJ, 636, L105 [NASA ADS] [CrossRef] [Google Scholar]
- Henning, T. 2010, ARA&A, 48, 21 [NASA ADS] [CrossRef] [Google Scholar]
- Henning, T., & Stognienko, R. 1996, A&A, 311, 291 [NASA ADS] [Google Scholar]
- Hollenbach, D. 1989, in Interstellar Dust, eds. L. J. Allamandola & A. G. G. M. Tielens, IAU Symp., 135, 227 [NASA ADS] [Google Scholar]
- Jones, A. P. 1988, MNRAS, 234, 209 [NASA ADS] [Google Scholar]
- Jones, A. P. 2011, A&A, 528, A98 [NASA ADS] [CrossRef] [EDP Sciences] [Google Scholar]
- Jones, A. P. 2012a, A&A, 540, A1 [NASA ADS] [CrossRef] [EDP Sciences] [Google Scholar]
- Jones, A. P. 2012b, A&A, 540, A2 [NASA ADS] [CrossRef] [EDP Sciences] [Google Scholar]
- Jones, A. P. 2012c, A&A, 542, A98 [NASA ADS] [CrossRef] [EDP Sciences] [Google Scholar]
- Jones, A. P., Fanciullo, L., Koehler, M., et al. 2013, A&A, 558, A62 [NASA ADS] [CrossRef] [EDP Sciences] [Google Scholar]
- Jones, A. P., Köhler, M., Ysard, N., et al. 2016, A&A, 588, A43 [NASA ADS] [CrossRef] [EDP Sciences] [Google Scholar]
- Jones, A. P., Köhler, M., Ysard, N., Bocchio, M., & Verstraete, L. 2017, A&A, 602, A46 [NASA ADS] [CrossRef] [EDP Sciences] [Google Scholar]
- Kataoka, A., Okuzumi, S., Tanaka, H., & Nomura, H. 2014, A&A, 568, A42 [NASA ADS] [CrossRef] [EDP Sciences] [Google Scholar]
- Kemper, F., Vriend, W. J., & Tielens, A. G. G. M. 2004, ApJ, 609, 826 [NASA ADS] [CrossRef] [Google Scholar]
- Kemppinen, O., Nousiainen, T., & Lindqvist, H. 2015, J. Quant. Spectr. Rad. Transf., 150, 55 [NASA ADS] [CrossRef] [Google Scholar]
- Kimura, H., Kolokolova, L., & Mann, I. 2003, A&A, 407, L5 [NASA ADS] [CrossRef] [EDP Sciences] [Google Scholar]
- Kimura, H., Kolokolova, K., & Lebreton, J. 2016, in Light Scattering Reviews (Berlin: Springer), 11 [Google Scholar]
- Kirchschlager, F., & Wolf, S. 2013, A&A, 552, A54 [NASA ADS] [CrossRef] [EDP Sciences] [Google Scholar]
- Koehler, M., Guillet, V., & Jones, A. 2011, A&A, 528, A96 [NASA ADS] [CrossRef] [EDP Sciences] [Google Scholar]
- Koehler, M., Jones, A., & Ysard, N. 2014, A&A, 565, L9 [NASA ADS] [CrossRef] [EDP Sciences] [Google Scholar]
- Koehler, M., Ysard, N., & Jones, A. P. 2015, A&A, 579, A15 [NASA ADS] [CrossRef] [EDP Sciences] [Google Scholar]
- Köhler, M., Stepnik, B., Jones, A. P., et al. 2012, A&A, 548, A61 [NASA ADS] [CrossRef] [EDP Sciences] [Google Scholar]
- Kozasa, T., Blum, J., & Mukai, T. 1992, A&A, 263, 423 [NASA ADS] [Google Scholar]
- Lehtinen, K., & Mattila, K. 1996, A&A, 309, 570 [NASA ADS] [Google Scholar]
- Liu, C., Yin, Y., Hu, F., Jin, H., & Sorensen, C. M. 2015, Aerosol Sci. Technol., 49, 928 [NASA ADS] [CrossRef] [Google Scholar]
- Mackowski, D. W., & Mishchenko, M. I. 1996, J. Opt. Soc. Am. A, 13, 2266 [NASA ADS] [CrossRef] [Google Scholar]
- Martin, P. G., Roy, A., Bontemps, S., et al. 2012, ApJ, 751, 28 [NASA ADS] [CrossRef] [Google Scholar]
- Mattila, K. 1970, A&A, 9, 53 [NASA ADS] [Google Scholar]
- Maxwell Garnett, J. 1904, Roy. Soc. London Philos. Trans. Ser. A, 1904, 203 [Google Scholar]
- Min, M., Waters, L. B. F. M., de Koter, A., et al. 2007, A&A, 462, 667 [NASA ADS] [CrossRef] [EDP Sciences] [Google Scholar]
- Min, M., Hovenier, J. W., Waters, L. B. F. M., & de Koter A. 2008, A&A, 489, 135 [NASA ADS] [CrossRef] [EDP Sciences] [Google Scholar]
- Min, M., Rab, C., Woitke, P., Dominik, C., & Ménard, F. 2016, A&A, 585, A13 [NASA ADS] [CrossRef] [EDP Sciences] [Google Scholar]
- Mishchenko, M. I., & Yurkin, M. A. 2017, Opt. Lett., 42, 494 [NASA ADS] [CrossRef] [Google Scholar]
- Mishchenko, M. I., Travis, L. D., & Mackowski, D. W. 1996, J. Quant. Spectr. Rad. Transf., 55, 535 [NASA ADS] [CrossRef] [Google Scholar]
- Mishchenko, M. I., Dlugach, J. M., & Liu, L. 2016a, J. Quant. Spectr. Rad. Transf., 178, 284 [NASA ADS] [CrossRef] [Google Scholar]
- Mishchenko, M. I., Dlugach, J. M., Yurkin, M. A., et al. 2016b, Phys. Rep., 632, 1 [NASA ADS] [CrossRef] [Google Scholar]
- Mukai, T., Ishimoto, H., Kozasa, T., Blum, J., & Greenberg, J. M. 1992, A&A, 262, 315 [NASA ADS] [Google Scholar]
- Okamoto, H., & Xu, Y.-l. 1998, Earth Planets Space, 50, 577 [NASA ADS] [CrossRef] [Google Scholar]
- Ormel, C. W., Min, M., Tielens, A. G. G. M., Dominik, C., & Paszun, D. 2011, A&A, 532, A43 [NASA ADS] [CrossRef] [EDP Sciences] [Google Scholar]
- Ossenkopf, V. 1993, A&A, 280, 617 [NASA ADS] [Google Scholar]
- Pagani, L., Steinacker, J., Bacmann, A., Stutz, A., & Henning, T. 2010, Science, 329, 1622 [NASA ADS] [CrossRef] [PubMed] [Google Scholar]
- Paladini, R. 2014, in The Labyrinth of Star Formation, eds. D. Stamatellos, S. Goodwin, & D. Ward-Thompson, Astrophys. Space Sci. Proc., 36, 299 [NASA ADS] [CrossRef] [Google Scholar]
- Purcell, E. M., & Pennypacker, C. R. 1973, ApJ, 186, 705 [NASA ADS] [CrossRef] [Google Scholar]
- Rawlings, M. G., Juvela, M., Lehtinen, K., Mattila, K., & Lemke, D. 2013, MNRAS, 428, 2617 [NASA ADS] [CrossRef] [Google Scholar]
- Remy, Q., Grenier, I. A., Marshall, D. J., & Casandjian, J. M. 2017, A&A, 601, A78 [NASA ADS] [CrossRef] [EDP Sciences] [Google Scholar]
- Ridderstad, M., & Juvela, M. 2010, A&A, 520, A18 [NASA ADS] [CrossRef] [EDP Sciences] [Google Scholar]
- Roy, A., Martin, P. G., Polychroni, D., et al. 2013, ApJ, 763, 55 [NASA ADS] [CrossRef] [Google Scholar]
- Shen, Y., Draine, B. T., & Johnson, E. T. 2008, ApJ, 689, 260 [NASA ADS] [CrossRef] [Google Scholar]
- Stepnik, B., Abergel, A., Bernard, J.-P., et al. 2003, A&A, 398, 551 [NASA ADS] [CrossRef] [EDP Sciences] [Google Scholar]
- Stognienko, R., Henning, T., & Ossenkopf, V. 1995, A&A, 296, 797 [NASA ADS] [Google Scholar]
- Suutarinen, A., Haikala, L. K., Harju, J., et al. 2013, A&A, 555, A140 [NASA ADS] [CrossRef] [EDP Sciences] [Google Scholar]
- Tazaki, R., & Tanaka, H. 2018, ApJ, 860, 79 [NASA ADS] [CrossRef] [Google Scholar]
- Tazaki, R., Tanaka, H., Okuzumi, S., Kataoka, A., & Nomura, H. 2016, ApJ, 823, 70 [NASA ADS] [CrossRef] [Google Scholar]
- van Breemen, J. M., Min, M., Chiar, J. E., et al. 2011, A&A, 526, A152 [NASA ADS] [CrossRef] [EDP Sciences] [Google Scholar]
- Vorobiev, Y. V., Horley, P. P., Hernández-Borja, J., et al. 2012, Nanoscale Res. Lett., 7, 483 [NASA ADS] [CrossRef] [Google Scholar]
- Voshchinnikov, N. V., Il’in, V. B., Henning, T., Michel, B., & Farafonov, V. G. 2000, J. Quant. Spectr. Rad. Transf., 65, 877 [NASA ADS] [CrossRef] [Google Scholar]
- Wakelam, V., Bron, E., Cazaux, S., et al. 2017, Mol. Astrophys., 9, 1 [Google Scholar]
- Weingartner, J. C., & Draine, B. T. 2001, ApJS, 134, 263 [NASA ADS] [CrossRef] [MathSciNet] [Google Scholar]
- Williams, D. A. 2005, J. Phys. Conf. Ser., 6, 1 [NASA ADS] [CrossRef] [Google Scholar]
- Wu, Y., Cheng, T., Zheng, L., & Chen, H. 2016, J. Quant. Spectr. Rad. Transf., 168, 158 [NASA ADS] [CrossRef] [Google Scholar]
- Xing, Z., & Hanner, M. S. 1997, A&A, 324, 805 [NASA ADS] [Google Scholar]
- Yon, J., Bescond, A., & Liu, F. 2015, J. Quant. Spectr. Rad. Transf., 162, 197 [NASA ADS] [CrossRef] [Google Scholar]
- Ysard, N., Abergel, A., Ristorcelli, I., et al. 2013, A&A, 559, A133 [NASA ADS] [CrossRef] [EDP Sciences] [Google Scholar]
- Ysard, N., Köhler, M., Jones, A., et al. 2015, A&A, 577, A110 [NASA ADS] [CrossRef] [EDP Sciences] [Google Scholar]
- Ysard, N., Köhler, M., Jones, A., et al. 2016, A&A, 588, A44 [NASA ADS] [CrossRef] [EDP Sciences] [Google Scholar]
For the full details of the model, see Jones (2012a,b,c); Jones et al. (2013, 2016); Koehler et al. (2014, 2015) and Ysard et al. (2015, 2016).
In this study, we only consider grains with sizes ≥0.1 μm for which size effects on optical constants are negligible.
Following the grain structure definition required by the ddscat routine (Draine & Flatau 1994; see Sect. 2.3 for details), porosity is modelled by removing one dipole at a time, not an adjacent group of dipoles.
If the Fe/FeS inclusions are removed from the silicates, results similar to those for a-C:H are found, with a threshold wavelength of 0.2 μm corresponding to Eg ~ 7 eV.
For an aggregate composed of 0.1 μm spheres, aV = 0.13, 0.16, 0.18, 0.20, 0.22, 0.23, 0.24, and 0.25 μm for N = 2, 4, 6, 8, 10, 12, 14, and 16, respectively.
Both the peak position and FWHM are calculated directly from the unnormalised dust mass opacity. Contrary to what is usually done when analysing astonomical observations, we do not subtract any continuum nor normalise the curves. As a result, FWHM cannot be defined when the features become very wide, explaining the “missing points” in Fig. 12 for large aV.
The computations were done using the publicly available emc routine of V. Ossenkopf: https://hera.ph1.uni-koeln.de/~ossk/Jena/pubcodes.html.
All Figures
|
Fig. 1 Optical constants of silicates (green), a-C with Eg = 0.1 eV (blue), and a-C:H with Eg = 2.5 eV (fuchsia). The real, n, and complex, k, parts of the complex refractive index are showed by the solid and dashed lines, respectively. |
| In the text | |
|
Fig. 2 Two examples of aggregate shapes (arbitrary scales). Left panel: aggregate made of N = 12 compact spherical monomers with a0 = 0.1 μm. Right panel: aggregate made of N = 16 compact prolate monomers with a0 = 0.05 μm and aspect ratios of 2. |
| In the text | |
|
Fig. 3 Influence of grain size for compact spherical a-SilFe,FeS (left panels), a-C (middle panels), and a-C:H (right panels) grains with radius a = 0.05, 0.1, 0.5, 1, 2, 3, 4, and 5 μm plotted in pink, blue, green, fuchsia, red, yellow, brown, and orange, respectively. Top bottom panels: Qabs (a, λ), Qsca (a, λ), κ(a, λ), and the ratioof the latter to κ(a = 0.1 μm, λ). |
| In the text | |
|
Fig. 4 Influence of porosity for spherical a-SilFe,FeS (left panels), a-C (middle panels), and a-C:H (right panels) grains with radius a = 0.1 μm and a porosity degree P = 0, 10, 20, 30,40, and 50% plotted in blue, green, pink, red, yellow, and brown, respectively. Top bottom panels: Qabs (P, λ), Qsca (P, λ), κ(P, λ), and the ratioof the latter to κ(compact, λ) for a compact grain with same mass. |
| In the text | |
|
Fig. 5 Influence of grain shape for compact spherical (dotted lines), oblate (dashed lines), and prolate (solid lines) a-SilFe,FeS (left panels), a-C (middle panels), and a-C:H (right panels) grains with radius aV = 0.05, 0.1, and 1 μm plotted in black, blue, and fuchsia, respectively. Top bottom panels: Qabs(shape, λ), Qsca (shape, λ), κ(shape, λ), and the ratioof the latter to κ(sphere, λ) for a compact spherical grain with same mass. |
| In the text | |
|
Fig. 6 Influence of the number of monomers for a-SilFe,FeS (left panels), a-C (middle panels), and a-C:H (right panels) aggregates made of compact spherical monomers with radius a0 = 0.1 μm and N = 1, 2, 4, 6, 8, 10, 12, 14, and 16 monomers plotted in blue, pink, green, fuchsia, red, yellow, silver, brown, and orange, respectively. Top bottom panels: Qabs (N, λ), Qsca (N, λ), the ratio of the latter to κ(N = 1, λ) for an isolated compact spherical grain with a = a0. |
| In the text | |
|
Fig. 7 Influence of monomer size for a-SilFe,FeS (left panels), a-C (middle panels), and a-C:H (right panels) aggregates of 16 compact spherical monomers with radius a0 = 0.05 μm in green, 0.1 μm in blue, 0.5 μm in fuchsia, and 1 μm in orange. Top bottom panels: Qabs(a0, λ), Qsca (a0, λ), κ(a0, λ), and the ratioof the latter to κ(a0, λ) for an isolated compact spherical grain with the same radius as the monomers composing the aggregate. |
| In the text | |
|
Fig. 8 Influence of porosity for a-SilFe,FeS (left panels), a-C (middle panels), and a-C:H (right panels) aggregates made of porous spherical monomers with radius a0 = 0.1 μm, P = 20%, and N = 1, 2, 4, 6, 8, 10, 12, 14, and 16 monomers plotted in blue, pink, green, fuchsia, red, yellow, silver, brown, and orange, respectively. Top bottom panels: Qabs (N, λ), Qsca (N, λ), κ(N, λ), and the ratioof the latter to κ(N, λ, P = 0%) for aggregates made of compact spherical monomers with radius a0 = 0.1 μm. |
| In the text | |
|
Fig. 9 Influence of the monomer shape for a-SilFe,FeS (left panels), a-C (middle panels), and a-C:H (right panels) aggregates made of compact spheroidal monomers with aV = 0.05 μm, aspect ratiosof 2, and N = 1, 2, 4, 6, 8, 10, 12, 14, and 16 monomers plotted in blue, pink, green, fuchsia, red, yellow, silver, brown, and orange, respectively. Solid lines show aggregates made of oblate monomers and dashed lines of prolate monomers. Top bottom panels: Qabs (N, λ), Qsca (N, λ), κ(N, λ), and the ratioof the latter to κ(N) for aggregates made of compact spherical monomers with radius a0 = 0.05 μm. |
| In the text | |
|
Fig. 10 a-SilFe,FeS (left panels), a-C (middle panels), and a-C:H (right panels) aggregates made of compact spherical monomers with radius a1 = 0.05 μm and a2 = 0.1 (solid lines) or 0.5 μm (dashed lines), and N = 4. Plotted in blue are the results for aggregates made of three grains with a0 = a1 and one grain with a0 = a2, in fuchsia one grain with a0 = a1 and three grains with a0 = a2, and in green two grains of each radius. Top to bottom panels: Qabs(a2, λ), Qsca (a2, λ), κ(a2, λ), and the ratioof the latter to κ(a = a2) for an isolated compact spherical grain with radius a = a2. |
| In the text | |
|
Fig. 11 a-SilFe,FeS (left panels), a-C (middle panels), and a-C:H (right panels) aggregate normalised dust mass opacities at 250 μm as a functionof the number of monomers composing the aggregates, N. Top row: κ(a0, N) for a0 = 0.05 (red), 0.1 (orange), 0.5 (brown), and 1 μm (purple) normalised to κ(a0, N = 1). Middle row: κ(a0 = 0.1 μm, N, P = 20%) normalised to κ(a0 = 0.1 μm, N, P = 0%). Bottom row:κ(oblate monomers, N) in blue and κ(prolate monomers, N) in pink normalised to κ(spherical monomers, N). The filled areas show the scatter of the dust mass opacities for ten randomly chosen aggregate shapes (see Sect. 2.2). |
| In the text | |
|
Fig. 12 Peak positions, λ10 and λ18 (first and third rows), full widths at half maximum, FWHM10 and FWHM18 (second and fourth rows), and ratios of the dust mass opacities of the mid-IR silicate features, R10∕18 (bottom row), for isolated grains (left column) and aggregates (right column). λ, FWHM, andR10∕18 are plotted as a function of the radius of a compact sphere with same mass for compact spheres (black circles), porous spheres (fuchsia squares), prolate grains (blue triangles), oblate grains (coral triangles), and aggregates of compact spheres with a0 = 0.05 (red circles), 0.1 (orange circles), 0.5 (brown circles), 1 μm (purple circles), aggregates of porous spheres with P = 20% and a0 = 0.1 μm (fuchsia squares), aggregates of prolate monomers with a0 = 0.05 μm (blue triangles), and aggregates of oblate monomers with a0 = 0.05 μm (coral triangles). The horizontal black dashed lines show λ, FWHM, andR10∕18 of the smallest isolated compact sphere. |
| In the text | |
|
Fig. 13 Influence of size for compact spherical a-SilFe,FeS (left panels), a-C (middle panels), and a-C:H (right panels) grains with radius a = 0.05, 0.1, 0.5, 1, 2, 3, 4, and 5 μm plotted in pink, blue, green, fuchsia, red, yellow, brown, and orange, respectively. Top panels: albedo Qsca ∕(Qabs + Qsca). Bottom panels: asymmetry factor of the phase function g = ⟨cos θ⟩. |
| In the text | |
|
Fig. 14 Influence of porosity for spherical a-SilFe,FeS (left panels), a-C (middle panels), and a-C:H (right panels) grains with radius a = 0.1 μm and porosity degree P = 10, 20, 30, 40, and 50% plotted in blue, green, pink, red, yellow, and brown, respectively. Top panels: Qsca ∕(Qabs + Qsca). Bottom panels: g = ⟨cos θ⟩. |
| In the text | |
|
Fig. 15 Influence of shape for spherical (black), oblate (blue), and prolate (magenta) a-SilFe,FeS (left panels), a-C (middle panels), and a-C:H (right panels) grains with radius aV = 0.1 and 1 μm, solid and dashed lines, respectively. Top panels: Qsca∕(Qabs + Qsca). Bottom panels: g = ⟨cos θ⟩. The asymmetry factor curves appear smoother because the calculations were made for lesser wavelength points. |
| In the text | |
|
Fig. 16 Influence of monomer size and number for a-SilFe,FeS (left panels), a-C (middle panels), and a-C:H (right panels) aggregates made of compact spherical monomers with radius a0 = 0.05 (dotted lines), 0.1 (solid lines), 0.5 (dashed lines), and 1 μm (dot-dashed lines) and N = 1, 2, 4, 6, 8, 10, 12, 14, and 16 monomers plotted in blue, pink, green, fuchsia, red, yellow, silver, brown, and orange, respectively. Top panels: Qsca∕(Qabs + Qsca). Bottom panels: g = ⟨cos θ⟩. Aggregates with N = 16 and a0 = 0.05 and 0.5 μm are also highlighted with triangles, while aggregates with N = 2 and a0 = 0.1 and 1 μm are highlighted with squares. |
| In the text | |
|
Fig. 17 Influence of monomer shape for a-SilFe,FeS (left panels), a-C (middle panels), and a-C:H (right panels) aggregates made of compact spheroidal monomers with radius a0 = 0.05 μm, aspect ratiosof 2, and N = 1, 2, 4, 6, 8, 10, 12, 14, and 16 monomers plotted in blue, pink, green, fuchsia, red, yellow, silver, brown, and orange, respectively. Solid lines show aggregates made of oblate monomers, dashed lines of prolate monomers, and dotted lines made of spherical monomers. Top panels: Qsca ∕(Qabs + Qsca). Bottom panels: g = ⟨cos θ⟩. |
| In the text | |
|
Fig. 18 Comparison of the optical properties of an aggregate made of 8 monomers calculated with DDA and with an equivalent using Mie theory using EMT (see Sect. 6 for details) for a-SilFe,FeS (left panels), a-C (middle panels), and a-C:H (right panels) grains. From top to bottom panels: Qabs, Qsca, the ratio of the two previous quantities calculated with DDA vs. EMT, the albedo, and the asymmetry factor of the phase function. The solid lines are the DDA optical properties for a0 = 0.1 (magenta) and 1 μm (green). The filled areas show the scatter of the dust properties for ten randomly chosen aggregate shapes (see Sect. 2.2). The crosses show the Mie calculations for the compact sphere of equivalent mass (a = aV). The empty circles show the Mie calculations using optical constants obtained through EMT. |
| In the text | |
Current usage metrics show cumulative count of Article Views (full-text article views including HTML views, PDF and ePub downloads, according to the available data) and Abstracts Views on Vision4Press platform.
Data correspond to usage on the plateform after 2015. The current usage metrics is available 48-96 hours after online publication and is updated daily on week days.
Initial download of the metrics may take a while.