Fig. 12
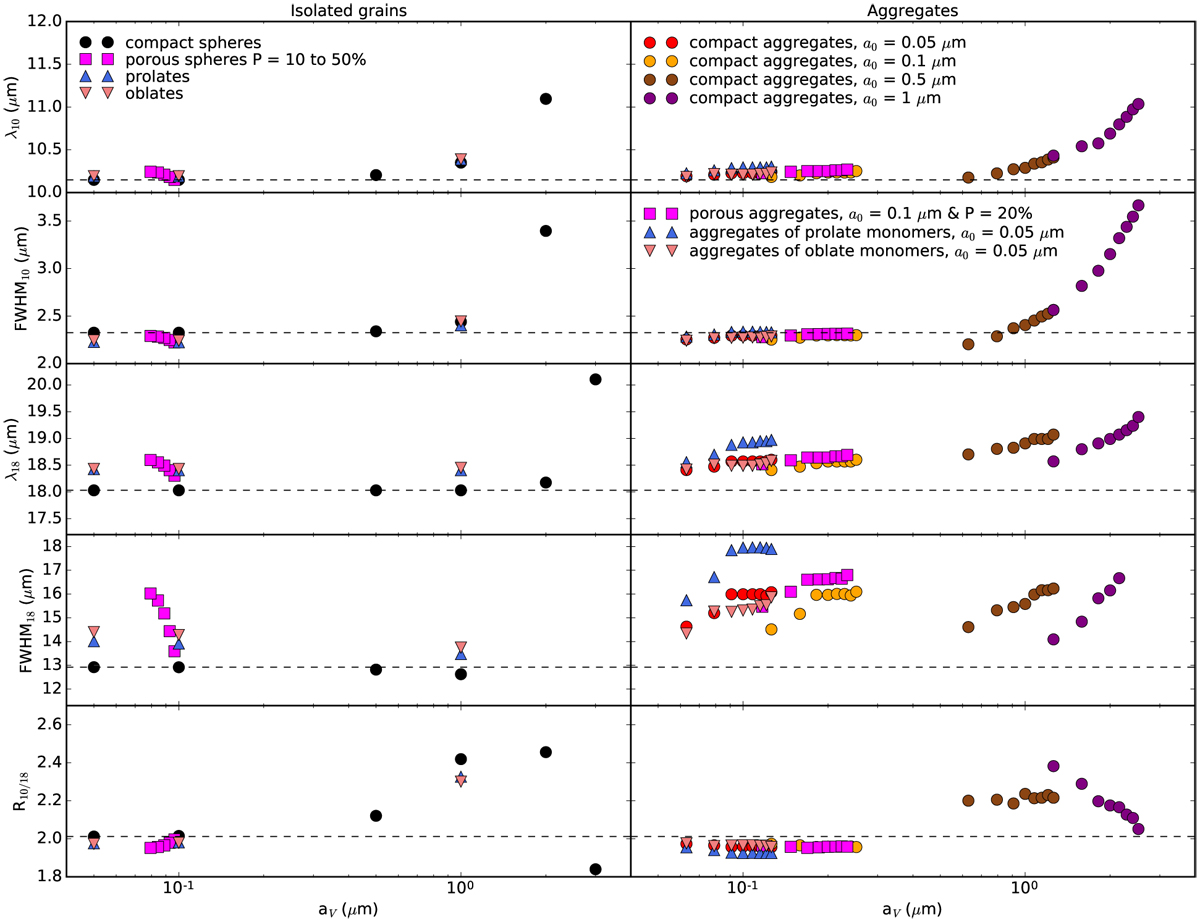
Peak positions, λ10 and λ18 (first and third rows), full widths at half maximum, FWHM10 and FWHM18 (second and fourth rows), and ratios of the dust mass opacities of the mid-IR silicate features, R10∕18 (bottom row), for isolated grains (left column) and aggregates (right column). λ, FWHM, andR10∕18 are plotted as a function of the radius of a compact sphere with same mass for compact spheres (black circles), porous spheres (fuchsia squares), prolate grains (blue triangles), oblate grains (coral triangles), and aggregates of compact spheres with a0 = 0.05 (red circles), 0.1 (orange circles), 0.5 (brown circles), 1 μm (purple circles), aggregates of porous spheres with P = 20% and a0 = 0.1 μm (fuchsia squares), aggregates of prolate monomers with a0 = 0.05 μm (blue triangles), and aggregates of oblate monomers with a0 = 0.05 μm (coral triangles). The horizontal black dashed lines show λ, FWHM, andR10∕18 of the smallest isolated compact sphere.
Current usage metrics show cumulative count of Article Views (full-text article views including HTML views, PDF and ePub downloads, according to the available data) and Abstracts Views on Vision4Press platform.
Data correspond to usage on the plateform after 2015. The current usage metrics is available 48-96 hours after online publication and is updated daily on week days.
Initial download of the metrics may take a while.