| Issue |
A&A
Volume 614, June 2018
|
|
|---|---|---|
| Article Number | A114 | |
| Number of page(s) | 62 | |
| Section | Atomic, molecular, and nuclear data | |
| DOI | https://doi.org/10.1051/0004-6361/201732114 | |
| Published online | 25 June 2018 | |
Atlas of new and revised high-resolution spectroscopy of six CO isotopologues in the 101–115 nm range
Transition energies of the v′ = 0, 1, 2, and 3 to v′′ = 0 bands of the B1Σ+, C1Σ+, and E1Π to X1Σ+ states, related term values, and molecular constants
1
Institut des Sciences Moléculaires d’Orsay (ISMO), CNRS – Université Paris-Sud (UMR 8214),
91405
Orsay, France
e-mail: jean-louis.lemaire@u-psud.fr
2
Observatoire de Paris, LERMA, UMR 8112 du CNRS,
Meudon, France
3
Université Versailles St-Quentin, Sorbonne Universités, UPMC Paris 06, CNRS/INSU, LATMOS-IPSL,
78280
Guyancourt, France
4
Department of Physics, Wellesley College,
Wellesley,
MA
02481, USA
5
Department of Physics and Astronomy, University of Toledo,
Toledo,
OH
43606,
USA
6
School of Earth and Space Exploration, Arizona State University,
Tempe,
AZ
85281, USA
7
DESIRS Beam Line, Synchrotron SOLEIL,
Saint Aubin, France
Received:
17
October
2017
Accepted:
15
November
2017
Our knowledge of astronomical environments containing CO depends on accurate molecular data to reproduce and interpret observed spectra. The recent and future improvements of ultraviolet space instrumentation, both in sensitivity and resolution, require increasingly detailed laboratory molecular spectroscopy as a reference. As part of a long-term experimental campaign at the SOLEIL Synchrotron facility, we have acquired gas-phase absorption spectra of six CO isotopologues in the vacuum ultraviolet. These spectra are recorded using the Fourier-transform spectrometer installed on the DESIRS beamline, providing a unique resolving power up to 106 in the 8–13 eV range. We have used resolutions in the 300 000–450 000 range for this campaign, which enable the analysis of individual line positions. We report new measurements on neighboring Rydberg states in the 101–115 nm range that could also be used as f-value calibrators, namely B1Σ+, C1Σ+, and E1Π, for six CO isotopologues. This range encompasses the absorption transitions B(v′ = 0, 1, and 2), C(v′ = 0, 1, 2, and 3), and E(v′ = 0, 1, 2, and 3) from X1Σ+(v′′ = 0). Higher resolution laser-based measurements of CO isotopologues from the literature are used to improve the absolute calibration and accuracy of our data. The overall uncertainty of the great majority of the line positions presented in this atlas is estimated to be 0.01 cm−1. In addition, some of the data derived from transition energies measurements, such as term values and molecular constants, are obtained for the first time, and others are improvements on previous sparser or lower spectral resolution datasets.
Key words: molecular data / methods: laboratory: molecular / techniques: spectroscopic / techniques: interferometric
© ESO 2018
1 Introduction
This work is part of a larger effort to catalog, interpret, and model the photoabsorption spectrum of CO in the 90–155 nm wavelength region. These measurements are performed at the third-generation SOLEIL synchrotron facility in Saint-Aubin, France. We employ the Fourier-transform spectrometer (FTS) installed on the DESIRS beam line, a unique instrument that combines high spectral resolution and a high signal-to-noise ratio (S/N) in the vacuum ultraviolet (VUV) wavelength range.
In the course of our earlier work (2008–2015) on CO photoabsorption spectroscopy in the 90–155 nm region, we were mainly interested in oscillator strengths and perturbations for several CO isotopologues. A large part of this work concerned the Rydberg W–X bands and Rydberg complexes in the 92.5–97.5 nm range: Eidelsberg et al. (2012, 2014, 2017) for 12C16O, 13C16O, 12C18O, and 13C18O, respectively, and perturbations in the W–X bands (Heays et al. 2014) and the f-value measurements of the lowest VUV states (Stark et al. 2014), while another part dealt with the A–X bands for 13 C16O (Gavilan et al. 2013) and 13 C18O (Lemaire et al. 2016). The common goal of these studies was the accurate determination of oscillator strengths, with an absolute calibration made by reference to the unperturbed B1 Σ +(v′ = 0)–X1Σ+(v′′ = 0) band that was previously well characterized by high-resolution (0.14 cm−1) laser-based measurements (Stark et al. 1999) and by synchrotron-based measurements (Federman et al. 2001). The B1 Σ +–X1Σ+ bands were already extensively investigated for four isotopologues (12 C16O, 13 C16O, 12 C18O, and 13 C18O) in both absorption and emission (Eidelsberg et al. 1987) using the Observatoire de Paris (Meudon, France) 10 m VUV grating spectrograph. In that work, term values were derived for the B00, B10, and B20 absorption bands. The uncertainty on the absolute wavenumbers was estimated to be ±0.1 cm−1.
Throughout this paper, the notation is simplified as follows: states are designed by their symmetry (e.g., X1 Σ + or E1 Π), while a band is denoted E1 Π (v′)–X1Σ+(v′′) or for brevity EXv′v′′, for example, EX20 for v′ = 2 and v′′ = 0, or shorter: E20. The notation indicating the isotopologues is also simplified in tables and figures, where we write, for example, 1216 for 12 C16O, etc.
The current investigation describes our high-resolution measurements of the B1 Σ +, C1 Σ +, and E1Π states for six CO isotopologues in the 101–115 nm range. This range encompasses the following absorption transitions: B(v′ = 0, 1 and 2), C(v′ = 0, 1, 2 and 3), and E(v′ = 0, 1, 2 and 3) from the fundamental electronic state X(v′′ = 0).
This work revisits and completes, 25 yr later, part of the CO atlas of transition frequencies started by the Paris-Meudon Observatory team (Eidelsberg et al. 1991; Le Floch 1992), and initiated by the work of Letzelter et al. (1987) and Viala et al. (1988) on the photoabsorption and photodissociation cross sections, either measured or calculated for the four isotopologues 12 C16O, 12 C18O, 13 C16O, and 13 C18O. It improves and completes calculations derived from the combination of earlier low-resolution measurements of term values and molecular constants of B00 and B10 for 12 C16O (Le Floch & Amiot 1985), of C00 and E00 for 12 C16O (Le Floch 1992), and of B00, B10, C00 and E00 for 12 C18O and 13 C18O (Haridass et al. 1994). Line positions of B20 for 12 C16O have been studied by Baker & Launay (1994).
This work also revisits and completes earlier experimental work at low resolution on E00 and E10 (Baker et al. 1993, 1994). Higher resolution work (Cacciani et al. 1995, 2001; Cacciani & Ubachs 2004; Drabbels et al. 1993a,b; Ubachs et al. 1995, 2000) is discussed in detail in Sect. 2.1 as these data are used in this work for the absolute calibration of our data.
It is also worth mentioning the extensive work of Morton & Noreau (1994), which provides a compilation of electronic transitions (including BX00 to BX20, CX00 to CX30, and EX00 to EX20) in the CO molecule (12 C16O, 12 C18O, 13 C16O, and 13 C18O). Line positions are limited in this work to J′′ ≤ 6. This paper includes all experimental data published up to 1994.
A first detailed model of CO photodissociation, based on laboratory data, including depth-dependent attenuation and isotope-selective self-shielding of photodissociation rates, was developed by van Dishoeck & Black (1988) to model in detail, coupled with a chemical network, the structure and chemistry of a variety of interstellar clouds. This work, updated by measurements produced in the subsequent 20 yr, was revisited by Visser et al. (2009), including self- and mutual-shielding of all isotopologues (in particular, for the first time, 12 C17O and 13 C17O) as well as shielding by atomic and molecular hydrogen.
All term values are referenced to the X1 Σ +(v′′ = 0, J′′ = 0) ground state of the respective isotopologues, according to the ground-state energy levels determined by Guelachvili et al. (1983) and Farrenq et al. (1991).
This work only reports and is based on lines that are observed and clearly identified in spectra, with the exception of the extremely congested Q-branches of the E state (at low J) for which we report in our tables literature values obtained at very high resolution (for E00 and E10) or estimated (for E20) for the sake of completeness.
This article is organized as follows. Section 2 briefly describes the experimental setup and the analysis procedure. Section 3 presents our results: line assignments, term values, and molecular constants for each state (B, C, and E) and bands observed. The last section presents our concluding remarks.
2 Experimental setup and data analysis
CO spectra are recorded at high resolution using the vacuum-ultraviolet Fourier-transform spectrometer (VUV-FTS) available on beamline DESIRS (Dichroïsme Et Spectroscopie par Interaction avec le Rayonnement Synchrotron) of the SOLEIL synchrotron. The beamline and spectrometer have been described in detail in previous publications (de Oliveira et al. 2009, 2011, 2016; Nahon et al. 2012, 2013).
Four bottles of isotopically purified gases, namely 12 C16O (Alphagaz, 99.997%), 12 C18O (ICON Isotopes, 18O 99%), 13 C16O (Messer, 13C 99.1%; 16 O 99.95%), 13 C18O (Cambridge Isotopes, 13C 99%, 18 O 95%), and one bottle containing a 12 C16O/12C17O/12C18O mixture (ICON Isotopes, 41.5%, 48.5%, and 9.9% respectively), are used to obtain data for five isotopologues. The presence of a sixth isotopologue, the rarely studied 13 C17O, is detected as an impurity in the 13 C16O and 13 C18O bottles, and serves to complete this analysis, which provides a consistent dataset on six natural isotopologues.
Sample gases continuously flow through a 10 cm long windowless absorption cell that is open on both sides through capillary tubes. Most spectra are recorded at room temperature (295 K), but a few are obtained with the central part of the cell cooled by liquid nitrogen; this results in a gas temperature of 90 ± 5 K. In some cases, these cooled spectra are useful for improved line assignations by reducing the number of lines in a spectrum and their Doppler broadening.
A total of 69 spectra, recorded at different pressures and spectral resolutions, were analyzed for this work (amounting to 3327 individual lines). The analysis was performed line by line, determining the line positions by modeling them as Gaussian or Voigt functions (for ~97% of the cases), and at times extracting them from simulations of the spectra of blended lines. In order to improve the accuracy, the present results rely on up to four different records for a given band and a given isotopologue. The bands observed in this work are reported in Table 1.
A key element of this work is the need for absolute wavelength calibration. The first step in the calibration procedure is provided by the FTS team. In summary, the raw FTS interferogram data based on the accurate measurement of the mirror displacement are first phase-corrected and then Fourier-transformed into a frequency spectrum. The resulting spectra are frequency-calibrated using atomic lines from different origins that appear in the spectra (de Oliveira et al. 2011, 2016). The accuracy of individual rovibrational lines is not only dependent on the accuracy of the absolute frequency calibration atomic lines, but also on the spectral resolution and on the strength and blendedness of each measured line. The parameters involved are the number, N, of independent scanning steps for a given line, which depends itself on the width, W, (mainly Doppler) of the measured line, and on the S/N compared to the background continuum signal. The final accuracy of line positions, σ in wavenumbers, reported by de Oliveira et al. (2011), is based on the empirical expression Δ (σ) ~ ) (see also their reference 20).
Lemaire et al. (2016) reported line positions determined from VUV-FTS spectra with a relative accuracy better than ~ ±0.008 cm−1 at 87 000 cm−1 (or ~±0.01 pm at 115 nm). A comparison of wavenumber measurements of common sets of lines from multiple independent spectra is consistent with this estimated accuracy.
Two methods were used to place all spectra on a unique wavelength scale. First, more than 30 atomic lines (mainly Xe I, Kr I, and sometimes O I) present in the studied range were used with reference frequencies taken from the NIST atomic lines database1. The presence of these gases is due to unintentional minor contamination or to a column of rare gas introduced on the beamline intended to filter out high-frequency harmonics generated in the undulator. Most of these lines have been measured with an accuracy of 10−3 nm and some with an accuracy of up to 10−6 nm. These latter are O I: 115.21512 nm (Kaufman & Edlén 1974), Xe I: 106.125564 nm, 105.612829 nm, 104.383497 nm (Yoshino & Freeman 1985; Brandi et al. 2001), and Kr I: 100.1060639 nm (Brandi et al. 2002). The positions of these lines are shown in Fig. 1.
Second, the random error associated with calibrating the wavenumber scale via a small number of atomic transitions can sometimes be improved upon by including reference data for molecular lines. For this aim, high-resolution laser measurements of some CO lines (and isotopologues) available in the literature were employed (Cacciani et al. 1995, 2001; Cacciani & Ubachs 2004; Drabbels et al. 1993a,b; Ivanov et al. 2008; Philip et al. 2004; Ubachs et al. 1994, 1995, 2000, and recently Daprà et al. 2016). Most of these measurements, obtained by narrow-band laser spectroscopy in one- or two-photon experiments, rely on the I2 - or Te2 -saturation spectrum asprimary absolute calibrators, associated with the marks of an actively stabilized Fabry-Pérot étalon. They are summarized in the next subsection (in alphabetical order) and are cited in the corresponding sections.
To overcome the lack of calibration data for some bands, we considered the overlapping regions of contiguous scans. A given setting of the undulator delivers a quasi-Gaussian beam profile of width ~5 nm at 1/e of the peak signal. An absorption scan encompasses about 3–5 bands, as can be seen in Fig. 1. With the right choice of undulatorsettings, we were able to measure at least three bands in a single scan. In this way, a band with no calibration reference can be surrounded by two bands subject to accurate calibration, for instance, the B20 band surrounded by the B10 and C00 bands.
The final accuracy of our measurements also relied upon isotopologue cross calibrations. These were obtained through mixed isotopologue samples (as is the case for the available 12 C16O–12C17O bottle, which contains some small amount of 12 C18O, and as in the case of 13 C17O, which was present as an impurity in 13 C16O and 13 C18O bottles). Even with pure gas samples, isotopologue impurities may show up in spectra that were recorded at high pressures. We also prepared and used on purpose mixed isotopologue samples allowing for such cross calibrations.
It is worth noting that more data were collected for this work than are included in papers dedicated to oscillator strength measurements. Those are restricted in pressure range and consequently in number of lines observed, in order to keep optical depths <1.5, or absorption lower than 78%, for the accurate determination of oscillator strengths. For this study we used higher pressures in order to observe high J′ levels and isotopologues present in small amounts. As described above, we also use cooled gases to remove possible ambiguities.
Summary of bands measured at high resolution.
References to the high-resolution calibration band or lines used (reference labels sorted by publication dates are given at the bottom of the table).
2.1 Laser calibration benchmarks and associated data
An absolute calibration of lines requires the availability of accurately determined standards, either atomic or molecular, as close as possible to the lines under study. There are many reported laser-based measurements of CO VUV transitions with accurate absolute calibrations based on primary standards. Some previous work has been limited to a few lines of each vibrational band, while others offer almost complete bands for use as comparisons for calibration purposes. Data like this exist for most CO isotopologues. They are summarized in detail in this section.
Reports of laser-based measurements that were used to accurately calibrate our spectra often also presented an analysis of the rotational structure of the bands under study, providing associated data such as term values, reduced term values, and molecular constants. These results are also mentioned in detail in this section as they are compared later to our own results.
Depending on the data available, laser calibrated benchmarks could in some cases be derived from transitions other than the one-photon P, R, and Q transitions of this study. When two-photon O, S, or Q transitions were available, the corresponding one-photon transitions for the R- and P-branches were recalculated by way of term values, taking into account that common-J′ term values (TVs) of the excited state calculated from various one- and two-photon transition frequencies, that is, TV( ), TV(
 ), TV(
 ), TV(
 ), and TV(
 ), have to be equal.
We summarize below all references providing laser calibration benchmarks that were used for this work, as well as the associated data mentioned above. They are sorted by alphabetical order of authors. With the exception of the first laser high-resolution measurements (Baker et al. at Paris-Meudon Observatory and Drabbels et al. at Nijmegen University), the majority of CO molecular calibration lines used here were measured using ultra-high resolution lasers at VU University Amsterdam (Cacciani et al., Daprà et al., Ivanov et al., Niu et al., and Ubachs et al.).
Baker (1994) This paper reports some perturbations observed in the B20 state of 12C16O that are due to the interaction with the 3Π(F1) spin-orbit component of the k3Π(0)–X1Σ+(0) band. Line positions and term values are given for B20 and kX00.
Baker & Launay (1994) This paper analyzes the k3Π(v′ = 2, 3 and 5)–X1Σ+(0) bands, the first one perturbing the E00 band, and the last one the E10 band. Line positions and term values are given for kX20, kX30, and kX50.
Baker et al. (1993, 1994) These papers provide a study of the E00 and E10 bands for four isotopologues, 12 C16O, 13 C16O, 12 C18O, and 13 C18O. Spectra were recorded using 2 + 1 resonantly enhanced multiphoton excitation showing the five rotational branches O, P, Q, R, and S at a resolution of ~0.1 cm−1. Spectra were acquired either separately for each isotopologue or with mixtures of several, and were then separated by time of flight mass spectrometry, in order to obtain an accurate relative calibration between isotopologues. Perturbations of E10 were analyzed. Term values (for three isotopologues of E00 and four of E10) and molecular constants (for E10) are also given for the four isotopologues.
Cacciani & Ubachs (2004) This paper gives Q-branch transition frequencies of E00 [Q: J′ = 1–8] for 12 C16O and [Q: J′ = 1–7] for 13 C16O and 13 C18O. Measured and calculated transition frequencies for E00 of 12 C16O [up to J′ = 34 with gaps] and 13 C16O [up to J′ = 42 with gaps], obtained by three different experimental methods, are accessible as supplementary data.
Cacciani et al. (1995) This paper provides a few term values for 12C16O (the E00 band [J′ = 31, 41, and 44] and E10 band [J′ = 5–13]), focused in both cases around perturbations. Molecular constants are also determined for 12C16O (E00 and E10), 13C16O (E00 and E10), 12C18O (E00 and E10), and 12C17O (E00). Transition frequencies were tabulated in a later paper (Cacciani & Ubachs 2004).
Cacciani et al. (2001) This paper provides transition frequencies for R- and P-branch lines of the C10 band for 12C16O [R: J′ = 0–27; P: J′ = 1–31], 12C18O [R: J′ = 0–13; P: J′ = 1–8, 10], 13 C16O [R: J′ = 0–15; P: J′ = 1–5, 9–20], 13 C18O [R = J′ = 0–5, 8–12; P: J′ = 1, 3, 5–8], and a few for 12 C17O [R: J′ = 0–2; P: J′ = 1] and 13 C17O [R: J′ = 0–1, 3–5; P: J′ = 1–3]. Molecular constants are also calculated for the six isotopologues, although at lower accuracy for 12 C17O and 13 C17O.
Daprà et al. (2016) This paper is mainly based on data for 12 C16O published by the Amsterdam team over several years and gives measured wavelengths (Tables 6–8; called molecular parameters) for the R and P (and Q for E00) J′ = 0–5 transitions of the B00, C00, and E00 bands. Their results are expressed with an accuracy of up to the sixth digit (in nanometers)and an error bar of between 3 and 13 in units of this digit. The restriction to the lowest rotational states (J′ ≤ 5) is due to thefact that this paper is aimed at the comparison with quasar observations. These data are the most accurate to date. They result from measurements and not from calculations, as can be deduced from the fact that term values for a given level, determined through the R- and P-branches, are not strictly equal.
Drabbels et al. (1993a) This paper reports observed transition frequencies for 12C16O of the Q- and S-branch lines of B00 [J′ = 0–14 for Q and 0–1 for S] and of C00 [J′ = 0–6 for Q and 0–1 for S]. Corresponding molecular constants are also calculated from these data.
Drabbels et al. (1993b) This paper completes the previous paper with additional measurements of Q lines for B10 [J′ = 0–2], for 13C16O B00 [J′ = 0–2], and for 12C18O B00 [J′ = 0–1]. There is also a slight revision of 12C16O B00 [J′ = 0–4 for Q and 0–1 for S], but as this paper was submitted earlier than the previous paper, it is not clear which should be considered as the more accurate.
Molecular constants are calculated for these four bands.
Ivanov et al. (2008) This paper reports “extreme-ultraviolet laser metrology of O I transitions” (about 20 lines in the 94.86–102.82 nm range) that are used for absolute calibration purposes, when oxygen is present, for E20 and higher energy states.
Niu et al. (2016) While focused on the spectroscopy and perturbation analysis of the A1 Π(v = 0) state of 13 C16O, this paper provides deperturbed molecular constants for B00.
Ubachs et al. (1994) This paper summarizes the work performed in the 91.2–115 nm range by the Amsterdam and Nijmegen teams over several years, reporting molecular constants for many states of four isotopologues and, of relevance to the present work, for 12 C16O (B00, B10, C00), 13 C16O (B00), and 12 C18O (B00).
Ubachs et al. (1995) This is a laser spectroscopic study of 12 C17O (observed here for the first time) R- and P-branch lines of C00 [J′ = 10–17 for R and 10–15 for P] and derived molecular constants. The latter are also given for C00 and C10 for 12 C16O, 13 C16O, and 12 C18O, but no transition frequencies are available.
Ubachs et al. (2000) This paper reports the transition frequencies of E10 for six isotopologues. For 12C16O [R: J′ = 0–26 with three gaps; Q: J′ = 8–21 with two gaps; P: J′ = 5–28 with three gaps], 12C18O [R: J′ = 0–11; Q: J′ = 8–13 with one gap; P: J′ = 2–13 with three gaps], 13C16O [R: J′ = 0–20 with five gaps; Q: J′ = 7–23; P: J′ = 2–20], 13C18O [R: J′ = 0–20 with two gaps; Q: J′ = 1,18; no P], a few for 12 C17O [R: J′ = 0–1; Q: J′ = 1–2; no P] and for 13 C17O [R: J′ = 0–12 with six gaps; Q: J′ = 1–12; P: J′ = 3]. The very high resolution (up to ~3 × 10⁶) achieved by a narrow-band laser source allowed assigning the Q-branch lines with an absolute accuracy of 0.003 cm−1 for all six natural CO isotopologues. Molecular constants are also derived for the ground-state X(v′′ = 0), E10 and the perturbing k60 bands.
References to the available absolute high-resolution calibration band or lines we used are summarized in Table 2 for each band and for each isotopologue. The availability of term values and/or molecular constants derived from the laser-based measurements is also noted in the table.
We also mention the mainly theoretical work of Lefèbvre-Brion & Eidelsberg (2012), which presents molecular constants (Tv and Bv) for E00, E10, E20, and E30 derived from our VUV-FTS high-resolution CO datasets, extracted before the absolute wavelength calibration of this work.
2.2 Data analysis
2.2.1 Atlas of measured wavelengths and wavenumbers
In order to place the atlas on an absolute wavelength scale, we compared our measured data with the entire set of calibration references from Table 2 (including all isotopologues when available). The average of their differences provides the value of a shift that was applied to correct the raw experimental wavelengths. As proof of the accuracy of the data delivered by the VUV-FTS team, this correction was usually very small (<3.4 × 10⁻⁵ nm or 0.03 cm−1). Two sets of measured transition energies (including calibration shift corrections from the wavelength standards), Rms and Pms, corresponding to the R- and P-branches (and additionally Qms for 1Π states), were the result from this procedure. In order to check the quality of our transition energy determinations, we compared for each J′ the values of
according to the method of combination differences (Herzberg et al. 1950). For each band and for each J′ , we calculated the difference A–B between these two quantities, which we defined as 2 ×δP. These differences lead to uncertainties in the term values TVR and TVP. Some publications interested in precise term values shared equally for each J′ the difference between TVR and TVP (or between R and P, in order to calculate corrected transition energies Rcorr = (Rms − δP) and Pcorr = (Pms + δP), which produces a single best-term value based on both lines. We did not follow this procedure here, but kept the measured values.
2.2.2 Atlas of term values and molecular constants
For each measured band, we used the line positions of R- and P-branch lines that terminate on the same upper rotational levels to calculate common upper-level term values with uncertainties.
The agreement of the term values calculated from independently measured P- and R-branch transitions with a common upper J-level, TVR, and TVP, is never perfect because of experimental noise and in some cases line broadening. However, as we described above, the excellent reproducibility of the measurements obtained with the VUV-FTS for a given band and a given isotopologue from spectra recorded at different times suggests that when the discrepancy is larger than the random fitting errors, it reveals the possible presence of a local perturbation that modifies the shape of one of the lines involved. For each J′ = i + 1 level, the final term value was obtained by averaging the term values TVR =  +
+ and TVP =
  +
+ that were calculated from measured line positions of each rotational branch, Rms and Pms. The relative difference is again 2 ×δP. As a final result, Rms, Pms and δP values are tabulated for each band and isotopologue. Both Rms and Pms are given in wavelengths and wavenumbers (and δP in wavenumbers), and are presented in separate tables for 12 C- and 13 C-bearing CO species.
Term values of the upper levels for all six isotopologues were derived from these two independent measurements. They are presented in separate tables for each band. while reduced term values are shown with graphs for better visualization. We must be careful for high J′ term values in two specific cases: (a) a high value of δP (we adopted in this work a limit of 0.125 cm−1) might mean that one of the lines is less well identified than the other (or does not belong to the studied band), even if the two R and P lines are both clearly observed, and (b) no δP value indicates that only one transition is present, either R or P. In the first case, we kept the TV derived from a single level, while in the second case, erratic TV values had to be rejected. All these tables and graphs are introduced for each state in the following sections. For each band and isotopologue, the statistical uncertainty on term values was obtained by calculating over all J′ , when both R and P levels were measured, the average and standard deviation (at 2σ) of 2 ×δP/2. The division by a factor of two takes into account that each term value results from two independent measurements (Rms and Pms) and that at least two different records (up to four in some cases, as described above) provide the same line position results. Each average is displayed in statistical tables, alongside its standard deviation (at 2σ), showing thedispersion in our measurements. An average closer to zero means that the δP values are randomly distributed, ensuring no bias in our measurements. A standard deviation closer to zero signifies a high probability of the absence of perturbation(s).
The molecular constants Tv, Bv, and Dv were least-squares fitted to the experimental term values using a second-order polynomial. Following the above remarks, only a subset of term values was considered at times, particularly for high J′ term values. Reduced term values were finally calculated for each vibrational level by subtracting a model defined by

for the e-parity levels of the B1Σ+ and C1 Σ+ sates and the f-parity levels of the E1 Π state, while for the e-parity levels of E1Π, the additional term

takes the Λ-doubling of this state into account (so that q = Be − Bf and qD = De − Df, where the e and f subscripts refer to the parity of the considered levels). For the E1 Π state, the Λ -doubling components can be either calculated by subtracting the molecular constants deduced from the e- and f-parity levels, or they can be directly obtained by fitting the TVe –TVf differences for each level to a second-order polynomial. The results of both methods are presented in Sect. 3.5. Their valueswere graphically compared according to their oxygen isotopic content to check for anomalies that are due to perturbations. In almost every case, our molecular constants were generated by much larger datasets than those referenced in Sect. 2.1 (see also Table 2).
It is worth noting that the lines in the R- and P-branches are in general not observed up to the same J′. It is also possible, in the case of high-pressure spectra, that some lines observed at high J′ values belong to a weak unidentified underlying band. As a consequence, some reduced term value graphs could present a break or jump for the last higher J′ values. This break, however, could correspond in some cases to a real perturbation.
3 Results and discussion
The results presented here constitute the first part of an atlas of the Rydberg states at wavelengths below 115 nm for six isotopologues of CO. They update and complete the previous CO atlas at the higher resolution provided by the VUV-FTS coupled to the SOLEIL synchrotron (Eidelsberg et al. 1991; for revised band origin wavenumbers, see Eidelsberg et al. 1992). They also fill some gaps and provide higher J′ lines that were previously not observed with high-resolution laser methods.
In addition to the atlas of absolute wavelengths and wavenumbers for the B, C, and E states of the six CO isotopologues, we provide for the derived term value atlas for each observed band. As a further step, we calculate reduced term values and molecular parameters. The latter are compared according to their oxygen isotopic content, and when possible, with previous determinations.
Figure 1 shows the bandhead wavelengths of the states and bands studied in this work. Table 1 summarizes the measured bands for each isotopologue. Some isotopologue bands are not recorded because of the combination of low oscillator strengths and low available pressures or partial pressures. Low partial pressure is particularly a problem in the case of 13 C17O, which is observed as a minor contaminant in high-pressure spectra of both 13 C16O and 13 C18O.
For all 12C (or 13C)-bearing isotopologues, the isotope shift spacing between bandheads increases almost linearly with v′ vibrational number, allowing for an easier differentiation of the lines pertaining to a given isotopologue for increasing v′ and J′ .
3.1 Specific cases of 12C17O and 13C17O
3.1.1 12C17O
As 12 C17O is mixed in almost equal proportions with 12 C16O in our sample, the absolute calibration of 12 C17O transitions benefits from the absolute calibration of 12 C16O (as well as 12 C18O, which is also present in a small amount).
3.1.2 13C17O
The case of 13 C17O is specific because it is observed in the high-pressure spectra of either 13 C16O or 13 C18O. The occurrence of the 13 C17O bands is due to isotopic contamination of the 13 C16O and 13 C18O bottles. Based on the relative strengths of identical absorption features, the ratio of the isotopologues in the 13 C16O gas sample, sorted by concentration, is found to be 13 C16O:13C18O:13C17O:12C16O = 1:0.041:0.073:0:0045. The high CO pressure needed to observe the minor 13 C17O species leads to strong absorption and saturation of the main species spectrum. Combined with the fact that the isotopic shifts of v′ = 0 bands are very small (≤1 cm−1 for B00 and C00 and ≤3 cm−1 for E00), 13 C17O lines for low J′ are difficult to extract because of blending with saturated (broadened) lines. This effect is weaker for increasing J′ because of the difference between molecular constants of the different isotopologues. 13 C17O lines of B00 with J′ > 2 are measured nearly as accurately (~0.04 cm−1) as for the main isotopologue (either 13 C16O or 13 C18O), similarly for C00 lines with J′ > 6. The search for low J′ line positions is facilitated by considering the values extrapolated from the clearly observed high J′ line levels (up to J′ = 23 for B00, J′ = 21 for B10, J′ = 39 for C10, and J′ = 26 for E00), which leads to an accuracy better than 0.08 cm−1 for the low J′. This effect is less noticeable for v′≥ 1 as the spacing of spectra bandheads of the different isotopologues increases with v′ .
All this concerns R- and P-branches, but there is an additional difficulty for Q-branches that we consider in the E-state subsection.
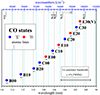 |
Fig. 1 Bandhead wavelengths of 12C16O states and bands studied in this work. We also include the previously used numerical index notation (34–43) (Letzelter et al. 1987; Eidelsberg & Rostas 1990, etc.). Atomic line calibrators are indicated with |: for primary lines at high accuracy (1 fm or better) and with |: for secondary lines at medium accuracy (0.1 pm) (for the latter, mostly Xe I and a few Ar I and Kr I, see the NIST atomic line tables for identification), and the 1/e undulator bandwidth are shown as well. |
3.2 X1Σ+ state
In order to calculate the term values of all the bands presented here, high-accuracy data provided by Guelachvili et al. (1983) and Farrenq et al. (1991) were used. From their set of Dunham coefficients, rotational levels of the v′′ = 0 X1 Σ+ ground state were calculated up to J′′ = 48 with an uncertainty of 10−3 cm−1, which is at least as good as our own high-resolution measurements. Table 9 lists the ground-state rotational levels of the six isotopologues studied here, 12 C16O, 12 C17O, 12 C18O, 13 C16O, 13 C17O, and 13 C18O. For each isotopologue, these J′′ levels are adjusted to a ninth-order polynomial to obtain their molecular constants. They are reported in Table A.31.
For the sake of consistency between all isotopologues, we did not use the data on the 12 C16O ground state by Varberg & Evenson (February 1992), which were published a few months after Farrenq et al. (October 1991). The latter provide data for six isotopologues, and a check on 12 C16O B00 revealed a better agreement at high J′ between the term values TVR and TVP derived for the R- and P-branches.
References to table and figure numbers for the B1Σ+ state.
3.3 B1Σ+ state
The B00 and B10 bands were observed for all isotopologues, while B20 was observed for all bands except for 12 C17O and 13 C17O. The lack of the B20 band in the 12 C17O spectra is explained by the low pressure used in scans of this isotopologue. For 13 C17O, the absence is due to the combination of a very low partial pressure and the decreasing oscillator strength with v′.
A total of 19 CO laser-calibrated lines (14 for 12 C16O, 2 for 12 C18O, and 3 for 13 C16O) were used to determine a shift correction of −7.5 × 10⁻⁶ nm (0.006 cm−1) for B00 and 3 lines for B10, resulting in a shift correction of −1.2 × 10⁻⁵ nm (0.0095 cm−1). These low values attest to the accuracy of our measurements. These corrections were applied to all isotopologues as their spectra are placed, as mentioned above, on a unique scale. Our term values are consistent within the uncertainty with those calculated by Le Floch & Amiot (1985) and Haridass et al. (1994), the latter resulting from the combination of B–A data with high-resolution A–X data obtained with the former Ottawa 10.6 m vacuum-grating spectrograph. For 12 C16O B00, the average difference between our values and the Daprà et al. (2016) values is 5.0 × 10⁻⁶ nm. For 12 C17O, the present results complete a preliminary version of our B00 data that was incorporated in Hakalla et al. (2016) in order to perform the deperturbation analysis of the A1Π state of 12 C17O, for which earlier optical measurements of B–A and C–A transitions were combined with our vacuum ultraviolet B–X results. Similarly, for 13 C17O, our results of B00 and B10 were used in Hakalla et al. (2017) to perform the deperturbation analysis of the A1 Π state of 13 C17O.
The data for 13 C18O are slightly better calibrated than in our recent paper (Lemaire et al. 2016) for B00 and B10. In addition, they are extended to higher J′ levels for B10.
As indicated above, the B20 band was calibrated using the surrounding B10 and C00 bands, leading to a common shift correction of +1.0 × 10⁻⁵ nm (−0.0083 cm−1) that was applied to all isotopologues. Figure A.3 illustrates for the four observed isotopologues the perturbations observed in B20 (also studied in 12 C16O and 13 C16O by Baker 1994).
For 12 C16O, 12 C18O, 13 C16O, and 13 C18O, our absolutely calibrated data provide transition frequencies and term values for B00, B10, and B20 that are consistent at slightly higher accuracy with those measured by Eidelsberg et al. (1987), which were obtained with the Observatoire de Paris (Meudon, France) 10 m VUV grating spectrograph. The same remark applies to the line positions obtained by Baker (1994) for B20 of 12 C16O with the same instrument.
Table 3 lists table and figure numbers associated with the BX bands. Table 4 gives the statistical uncertainty on the term values for the BX bands (see text in Sect. 2.2.2).
3.4 C1Σ+ state
C00, C10, C20, and C30 were observed for 12 C16O, 12 C18O, 13 C16O, and 13 C18O. For 12 C17O, all bands were observed except for C20, for the same reason as for B20. For 13 C17O, only C00 and C10 were observed; C20 and C30 are not observed for the same reason as for B20.
It is worth noting that for 12 C18O, the C30 band does not appear in the same room-temperature spectra obtained at pressures where C20 is observed. It is only observed in a low-temperature spectrum recorded at 90 ± 5 K, showing a limited number of J′ levels.
Sixteen CO laser-calibrated lines were used to determine a shift correction of 1.3 × 10⁻⁵ nm (−0.011 cm−1) for C00. Seventy-two laser-calibrated lines were considered (not including 12 C17O and 13 C17O, for which the number of lines in Cacciani et al. 2001 is limited) to determine the shift correction of 3.4 × 10⁻⁵ nm (−0.031 cm−1) for C10.
Our term values are consistent with those calculated by Haridass et al. (1994), which were obtained from the combination of C–A data with high-resolution A–X data obtained with the former Ottawa spectrograph. For 12 C16O C00, the average difference between our values and the values of Daprà et al. (2016) is 4.4 × 10⁻⁵ nm (−0.037 cm−1).
For C00, the present results complete a preliminary version of our 12 C17O data (as for B00) and provide new data on 13 C17O. Both were used in order to perform the deperturbation analysis of the A1 Π state of 12 C17O (Hakalla et al. 2016) and of 13 C17O (Hakalla et al. 2017).
As for B00 and B10, the present data for 13 C18O are slightly better calibrated and extend to higher J′ levels than in our recent paper (Lemaire et al. 2016) for C00.
The absolute calibration for C20 and C30 was obtained using the two surrounding primary atomic standards as calibrators (the Xe I line at 104.383497 nm for C20, and the Kr I line at 100.1060639 nm for C30, see Fig. 1) and checking that the numerous secondary standards (in the case of C20) are in agreement with each other (at an accuracy higher than 0.01 pm) for the five isotopologues.
Table 5 lists table and figure numbers associated with the CX bands. Table 6 gives the statistical uncertainty on the term values for the CX bands (see text in Sect. 2.2.2).
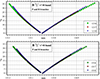 |
Fig. 2 Transition wavelengths of the B1Σ+(v′ = 0)–X1Σ+(v′′ = 0) band for six CO isotopologues. |
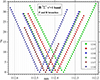 |
Fig. 3 Transition wavelengths of the B1Σ+(v′ = 1)–X1Σ+(v′′ = 0) band for six CO isotopologues. |
References to table and figure numbers for the C1Σ+ state.
3.5 E1Π state
E00, E10, E20, and E30 [the latter formerly labeled as the V (A2Π) 3Π state by Eidelsberg & Rostas (1990), with the present assignment confirmed by Lefèbvre-Brion & Eidelsberg (2012)] were observed for all isotopologues, with the exception of E20 and E30 for 13 C17O (as for B20 because of the combination of a very low partial pressure and decreasing oscillator strength with v′).
For E20 and E30 of 12 C18O, the same remark holds as for C30. These two bands do not appear in spectra taken at room-temperature at pressureswhere E10 is observed. It is only observed in low-temperature spectra recorded at 90 ± 5 K, showing a limited number of J′.
For all isotopologues, the rotational spacing is extremely small for the Q-branch of E00, E10, and E20, giving rise to congested spectra that require better resolution than available with the VUV-FTS and smaller Doppler broadening. This is particularly noticeable for the Q-branch of E10, where the lines are very slightly blueshifted with J′ compared tothe Q-branch of E00, which is slightly blueshifted, and the Q-branch of E20, which is slightly redshifted. Only with the use of a very narrow-band laser were Cacciani & Ubachs (2004) able to separate the Q-branch of E00, and Ubachs et al. (2000) did this in combination with a deperturbation analysis for E10. The Q-branch of E30 has a very different aspect (similar to A–X transitions) with a redshifted Q-branch and a returning limb for the R-branch with increasing J′ (see for comparison Figs. A.12, A.17, and A.25 vs. A.28, and also Figs. A.15, A.16, A.24, and A.27 vs. Figs. A.30–A.36).
A careful analysis is required to distinguish the lines in the E00 bands of the different isotopologues. Spectra recorded at different pressures were used for this purpose. Figure A.16 illustrates the difficulty of this task for E00 with three spectra for 13 C18O and 2 for 13 C16O. Figure A.27 shows the easier example of E20 for 13 C16O and 13 C18O, and Figs. A.30–A.36 show the example of E30 for 13 C18O.
There is very good agreement for the R- and P-branch line positions between our present results and other high-resolution measurements (Cacciani et al. 1995; Cacciani & Ubachs 2004 for E00 and Ubachs et al. 2000 for E10). E00 was calibrated using a few levels observed by Cacciani et al. (1995) for 12 C16O [3 lines] and a large set of R and P levels (Cacciani & Ubachs 2004) for 12 C16O [60 lines] and 13 C16O [32 lines] obtained by their methods labeled 1 and 0 (these data have to be calculated from the supplementary data, but no data are available for 13 C18O). The resulting shift correction is estimated as 2.3 × 10⁻⁵ nm (−0.020 cm−1). Comparisonto Daprà et al. (2016) shows an average difference of 3.8 × 10⁻⁵ nm for E00. For 12 C18O and 13 C18O, our term values for E00 (e- and f-parity) match those calculated by Haridass et al. (1994) well, which were obtained from the combination of E–A data with high-resolution A–X data collected with the former Ottawa spectrograph. For the Q-branch of 12 C16O, 13 C16O, and 13 C18O, which we cannot separate, we report the Cacciani & Ubachs (2004) observed transition frequencies (see their Table 1). We merged the Cacciani et al. data with our higher-J′ measurements. For the other isotopologues, 12 C17O and 12 C18O, the Q bandhead up to J′ ≈ 9 was simulated to reproduce the observed spectra. These calculated data were merged with our measured data at higher J′ . For the last isotopologue, 13 C17O, the Q-branch was simulated by interpolation of the 13 C16O and 13 C18O transitions (but these data are not reported in the table) in order to assign the few observed high J′ Q-lines.
E10 was calibrated by a few lines observed by Cacciani et al. (1995) for 12 C16O [9 lines] and a large set by Ubachs et al. (2000) of R and P lines for 12 C16O [42 R and P lines], for 12 C17O [2 R lines], 12 C18O [24 P and R lines], 13 C16O [25 P and R lines], and 13 C18O [18 R lines]. The absolute calibration for E10 obtained with the R and P levels is also confirmed by the presence of closely surrounding Xe I atomic lines (see Fig. 1). The resulting shift correction is estimated to be 5.0 × 10⁻⁶ nm. As it is not possible to distinguish the Q-branch of E10 for all isotopologues, we report in the tables the values obtained by Ubachs et al. (2000), merged with our measured data at higher J′. Our dataset for R- and P-branches extends those of Ubachs et al. (2000) to high J′ values. Sample spectra are shown for 12 C16O in Fig. A.20, 12 C17O in Fig. A.21, 12 C18O in Fig. A.22, 13 C16O in Fig. A.23, and 13 C18O in Fig. A.24. All of them show additional lines, and among them, lines that belong to the perturbing state k3 Π (v′ = 5 and 6)–X1Σ+(v′ = 0) (Baker & Launay 1994; Ubachs et al. 2000). The lower panel of Fig. A.21 shows the simulated absorption spectrum of 12 C17O at room temperature.
For E20 and E30, only low-resolution spectra without absolute calibration are available (Ogawa & Ogawa 1974 for 12 C16O E20) and the Eidelsberg et al. (1991) atlas for 12 C16O, 12 C18O, 13 C16O, and 13 C18O for both E20 and E30, with either measured or extrapolated or calculated line positions. Consequently, the absolute calibration of E20 and E30, for which there are no previous high-resolution measurements, was obtained in the same way as for C20 and C30, using the two surrounding primary atomic standards as calibrators and checking that the numerous secondary standards (in the case of E20)are in agreement with each other (at an accuracy higher than 0.01 pm) for five isotopologues (with the exception of 13 C17O). For E20, the Q-branch up to J′ = 6 or 7 was obtained in the same way as for E10 by simulating our recorded spectra and merging them with the higher measurable J′ , up to ~10–20, depending on the isotopologue. Figure A.27 shows the simulated absorption spectra of 12 C16O at 90 K and at room temperature. Finally, as indicated above, all branches of E30 have well-resolved transitions for all observed isotopologues. Figures A.30–A.36 show spectra for all five isotopologues; in some cases, the results obtained at 293 K and 90 K are compared, which are useful to separate the R-branch lines.
In order to verify the quality of our frequency determinations for the Q-branch, we use a method similar to the combination differences. We compared the values of the Λ -type doubling of the upper state obtained through the R- and P-branches, Λ R (J) and Λ P (J) (for J ≥ 1) with
![\begin{align*} && {\mathrm{\Lambda}}_R(J)=[R(J-1)+X(J-1)]-[Q(J)+X(J)] \ \textrm{and} \\ && {\mathrm{\Lambda}}_P(J)=[P(J+1)+X(J+1)]-[Q(J)+X(J)]. \end{align*}](/articles/aa/full_html/2018/06/aa32114-17/aa32114-17-eq14.png)
For all isotopologues and all bands (E00, E01, E02, and E03), the results are consistent with the value of Λ d provided in the term value tables. The Λ doubling of the upper state is graphically represented for all isotopologues in each band, E00, E10, E20, and E30, in Fig. A.37 together with polynomial fits (linear in most cases).
Table 7 lists table and figure numbers associated with the EX bands. Table 8 gives the statistical uncertainty on the e-parity term values of the EX bands (see text in Sect. 2.2.2).
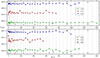 |
Fig. 4 Reduced term values (cm−1) of the B1Σ+(v′ = 0) levels for sixCO isotopologues. |
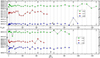 |
Fig. 5 Reduced term values (cm−1) of the B1Σ+(v′ = 1) levels for sixCO isotopologues. |
References to table and figure numbers for the E1Π state.
4 Concluding remarks
Our work presents a comprehensive and homogeneous set of absolutely calibrated line positions from which term values and molecular constants are derived. In most cases, these were obtained from larger sets of data than earlier determinations. Our data complete previous determinations and fill many gaps, particularly concerning the B20, C20, C30, E20, and E30 bands of all isotopologues. We also provide new data, particularly for the 12 C17O and 13 C17O isotopologues.
A final verification of the absolute accuracy of our whole set of results is provided by comparison with the data reported by Daprà et al. (2016). These datasets were not considered as calibrators because they were derived from others cited in Sect. 2.1, but we verified that they are in good agreement (at least for the six J′ levels included therein) with our own results on B00, C00, and E00 for 12 C16O.
In conclusion, the overall uncertainty of our data is a combination of the relative fitting accuracy in line positions (for a well-resolved typical line ~0.008 cm−1) and of the accuracy in the calibrators and in the ground state (up to ~0.003 cm−1). Most of the line positions are thus determined to an accuracy of ~0.009 cm−1. For some weak (mainly at high J′) or a few blended lines, the fitting errors are estimated to be as large as 0.10–0.15 cm−1. Uncertainties on term value data are reflected in the δP values presented in the term value tables.
Molecular constants are compiled in Table A.31 for all states and bands. In this table the E state e- and f-parity are treated independently, and we calculate in Table A.32 Tv (1) (average of Tv for e- and f-parity), qv = Be − Bf, and qDv = De − Df. These molecular constants are also obtained by a quadratic fit of the Λ -doubling data shown in Fig. A.37 and reported in Table A.33.
In order to check the consistency of our term values, we compare their trends for the six CO isotopologues in Fig. A.38. The term value differences between 16 O and 18 O bearing isotopologues are compared both for 12C and 13C versus the B, C, and E states. Term values are also compared as a function of v′ for each states, and a linear fit is drawn through all isotopologues present in each (TV, v′) data point. Both comparisons show a similar behavior.
The statistical table for the term values (see Tables 4, 6, and 8) can reveal the possible presence of perturbations when there is a large spread in the standard deviation (>0.043 cm−1, namely for 12 C16O (E30), for 12 C17O (C30), for 12 C18O (C20 and C30), for 13 C16O (C10, C20 and C30), for 13 C17O (C10), andfor 13 C18O (C30). Anomalies in the molecular constants also reveal evidence of perturbations, as shown in Fig. A.39, which illustrates this point more clearly than Table A.31. While Tv mainly depends on the absolute calibration, Bv and especially Dv are very sensitive to perturbations, as shown in Fig. A.39.
Perturbations will be discussed in detail in a subsequent paper. Another forthcoming development of this work will be a comprehensive atlas of oscillator strengths and cross sections for the states, bands, and isotopologues presented here.
Rotational energy levels (cm−1) of the X1Σ+ground state for six CO isotopologues (calculated from the Farrenq et al. 1991 Dunham coefficients).
Acknowledgements
We acknowledge SOLEIL for providing the synchrotron radiation facilities. All the data have been obtained on beamline DESIRS using the VUV-FTS spectrometer during proposals 20140051, 20120715, 20110121, 20100018, 20090021, and 20080025. We acknowledge assistance from the SOLEIL beamline staff (L. Nahon beamline manager), NdO (VUV-FTS manager and coauthor), and D. Joyeux (designer and builder of the VUV-FTS). This research was supported by NASA (grants NNG 06-GG70G and NNX10AD80G to the Univ. of Toledo and NNX09AC5GG to Wellesley College). J. R. L. and G. S. thank the NASA Origins of Solar System program (Grant NNX14AD49G) for funding. A. H., while in the Amsterdam team, acknowledges support from the Dutch astrochemistry network (DAN) from the Netherlands Organisation for Scientific Research (NWO) under grant 648.000.002 and the research fellowship program of PSL Research University Paris. J. L. L. thanks the ISMO-CNRS (Institut des Sciences Moléculaires d’Orsay at Université Paris-Sud) for hosting him as visiting researcher.
Appendix A Additional figures and tables
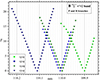 |
Fig. A.1 Transition wavelengths of the B1Σ+(v′ = 2)–X1Σ+(v′′ = 0) band for thefour observed CO isotopologues. |
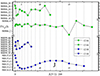 |
Fig. A.2 Reduced term values (cm−1) of the B1Σ+(v′ = 2) levels for the four observed CO isotopologues. |
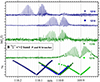 |
Fig. A.3 Sample of B20 spectra for the four observed isotopologues, in some cases showing perturbations. |
Measured transition wavelengths and wavenumbers of the B1Σ+(v′ = 0)–X1Σ+(v′′ = 0) band for 12C16O, 12 C17O, and 12 C18O.
Term values (cm−1) of the B1Σ+(v′ = 0) levels for sixCO isotopologues.
Term values (cm−1) of the B1Σ+(v′ = 1) levels for sixCO isotopologues.
Term values (cm−1) of the B1Σ+(v′ = 2) levels for 12C16O, 12 C18O, 13 C16O, and 13 C18O.
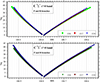 |
Fig. A.4 Transition wavelengths of the C1Σ+(v′ = 0)–X1Σ+(v′′ = 0) band for six CO isotopologues. |
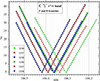 |
Fig. A.5 Transition wavelengths of the C1Σ+(v′ = 1)–X1Σ+(v′′ = 0) band for six CO isotopologues. |
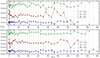 |
Fig. A.6 Reduced term values (cm−1) of the C1Σ+(v′ = 0) levels for sixCO isotopologues. |
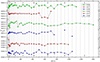 |
Fig. A.7 Reduced term values (cm−1) of the C1Σ+(v′ = 1) levels for sixCO isotopologues. |
 |
Fig. A.8 Transition wavelengths of the C1 Σ + (v′ = 2)–X1Σ+(v′′ = 0) band for thefour observed CO isotopologues. |
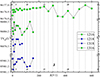 |
Fig. A.9 Reduced term values (cm−1) of the C1Σ+(v′ = 2) levels for the four observed CO isotopologues. |
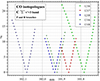 |
Fig. A.10 Transition wavelengths of the C1 Σ + (v′ = 3)–X1Σ+(v′′ = 0) band for thefour observed CO isotopologues. |
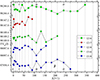 |
Fig. A.11 Reduced term values (cm−1) of the C1Σ+(v′ = 3) levels for the five observed CO isotopologues. |
Transition wavelengths and wavenumbers of the C1 Σ + (v′ = 0)–X1Σ+(v′′ = 0) band for 13C16O, 13 C17O, and 13 C18O (same column description as for Table A.1).
Term values (cm−1) of the C1Σ+(v′ = 0) levels for sixCO isotopologues.
Transition wavelengths and wavenumbers of the C1 Σ + (v′ = 1)–X1Σ+(v′′ = 0) band for 12C16O, 12 C17O, and 12 C18O (same column description as for Table A.1).
Transition wavelengths and wavenumbers of the C1 Σ + (v′ = 1)–X1Σ+(v′′ = 0) band for 13C16O, 13 C17O, and 13 C18O (same column description as for Table A.1).
Term values (cm−1) of the C1Σ+(v′ = 1) levels for sixCO isotopologues.
Transition wavelengths and wavenumbers of the C1 Σ + (v′ = 2)–X1Σ+(v′′ = 0) band for 12C16O, 12 C18O, 13 C16O, and 13 C18O (same column description as for Table A.1).
Term values (cm−1) of the C1Σ+(v′ = 2) levels for 12C16O, 12 C18O, 13 C16O and 13 C18O.
Transition wavelengths and wavenumbers of the C1 Σ + (v′ = 3)–X1Σ+(v′′ = 0) band for 12C16O, 12 C17O, 12 C18O, 13 C16O, and 13 C18O (same column description as for Table A.1).
Term values (cm−1) of the C1Σ+(v′ = 3) levels for 12C16O, 12 C17O, 12 C18O, 13 C16O and 13 C18O.
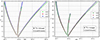 |
Fig. A.12 Transition wavelengths of the E1 Π (v′ = 0)–X1Σ+(v′′ = 0) band for six CO isotopologues. |
 |
Fig. A.13 e-parity reduced term values (cm−1) of the E1Π(v′ = 0) levels for six CO isotopologues. Data marked with a black center are kept to calculate molecular constants. |
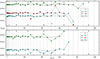 |
Fig. A.14 f-parity reduced term values (cm−1) of the E1Π(v′ = 0) levels for six CO isotopologues (data marked with a black center are kept to calculate molecular constants). |
 |
Fig. A.15 Spectra of the E1Π(v′ = 0)–X1Σ+(v′′ = 0) band for 13C16O and 12 C16O. Thelower graph shows a ×10 expanded scale on the Q-branch between the red arrows). |
 |
Fig. A.16 Top: spectra of the E1 Π (v′ = 0)–X1Σ+(v′′ = 0) band for 13C18O (three spectra at different pressures [saturated, half saturated, and no saturation]: 0.5/0.03/0.004 mbar, respectively, in blue/black/red colors; the scale to the right is valid for the highest pressure and has to be divided by 2 and 10 for the latter ones) and 13 C16O (two spectra [saturated and no saturation]: 0.5/0.005 mbar respectively in olive/green colors; the scale to the left is the same for both pressures). Bottom: this is an ×8 expanded scale on the Q-branch between the red arrows (same color codes and same relative scales as above). |
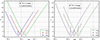 |
Fig. A.17 Transition wavelengths of the E1 Π (v′ = 1)–X1Σ+(v′′ = 0) band for six CO isotopologues. |
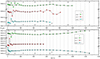 |
Fig. A.18 e-parity reduced term values (cm−1) of the E1Π(v′ = 1) levels for six CO isotopologues (left). Data marked with a black center are kept to calculate molecular constants. |
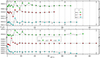 |
Fig. A.19 f-parity reduced term values (cm−1) of the E1Π(v′ = 1) levels for six CO isotopologues (data marked with a black center are kept to calculate molecular constants). |
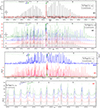 |
Fig. A.20 Spectra of the E1Π(v′ = 1)–X1Σ+(v′′ = 0) band for 12C16O. Two upper panels: RT spectra taken at different pressures. Third panel: comparison between 90 K (1 pressure) and room-temperature spectra (all pressures). Lower panel: ×5 expandedscale on the region indicated by black arrows on the above panel. This region contains among other lines those of the k3 Π (v′ = 5) perturbing band (around 105.205 nm), while k3 Π (v′ = 6) appears around 105.14 nm. |
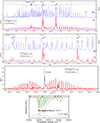 |
Fig. A.21 Spectra of the E1Π(v′ = 1)–X1Σ+(v′′ = 0) band for 12C17O at 90 K and at room temperature (two pressures for the latter). Second panel: zoom of the central part of the upper panel (×3 zoom). Third panel: RT spectrum after weighted subtraction of 12 C16O and 12 C18O spectra (the signal in the Q-branch, in black, is divided by 7). Lower panel: simulated absorption spectrum of the Q-branch at room temperature. |
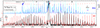 |
Fig. A.22 Spectra of the E1Π(v′ = 1)–X1Σ+(v′′ = 0) band for 12C18O at 90 K and room temperature (both at two pressures). |
 |
Fig. A.23 Spectra of the E1Π(v′ = 1)–X1Σ+(v′′ = 0) band for 13C16O at 90 K and room temperature. |
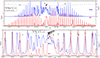 |
Fig. A.24 Upper panel: spectra of the E1 Π (v′ = 1)–X1Σ+(v′′ = 0) band for 13C18O at 90 K and room temperature. Lower panel: ×4 expanded scale on the Q-branch between the black arrows. |
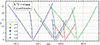 |
Fig. A.25 Transition wavelengths of the E1 Π (v′ = 2)–X1Σ+(v′′ = 0) band for five CO isotopologues. |
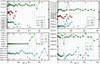 |
Fig. A.26 Reduced term values (cm−1) of the E1Π(v′ = 2) levels for five CO isotopologues (left: e-parity and right: f-parity). Data marked with a black center are kept to calculate molecular constants. |
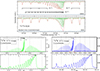 |
Fig. A.27 Spectra of the E1Π(v′ = 2)–X1Σ+(v′′ = 0) band. Upper panel: Simulated absorption spectra of the Q-branch of the for 12C16O at 90 K and at room temperature. Lower panels: spectra of 13 C16O (left) and 13C18O (right). Lowest panel: ×10 expanded scale on the Q-branch between the red arrows). |
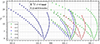 |
Fig. A.28 Transition wavelengths of the E1 Π (v′ = 3)–X1Σ+(v′′ = 0) band for thefive observed CO isotopologues. |
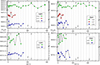 |
Fig. A.29 Reduced term values (cm−1) of the E1Π(v′ = 3) levels for the five observed CO isotopologues (left: e-parity, and right: f-parity). |
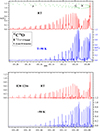 |
Fig. A.30 Spectra of the E1Π(v′ = 3)–X1Σ+(v′′ = 0) band for 12C16O at room temperature (RT) and at ~90 K. Simulations below, in emission, of the upper experimental spectra (using classical Hönl–London factors). |
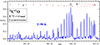 |
Fig. A.31 Spectra of the E1Π(v′ = 3)–X1Σ+(v′′ = 0) band for 12C17O at ~90 K. Traces of 12C18O are present around 101.185 nm. |
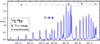 |
Fig. A.32 Spectra of the E1Π(v′ = 3)–X1Σ+(v′′ = 0) band for 12C18O at ~90 K. |
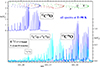 |
Fig. A.33 Spectra of the E1Π(v′ = 3)–X1Σ+(v′′ = 0) band for 12C16O, 12 C17O, and 12 C18O at ~90 K. 12 C17O is about equally mixed with 12 C16O, and traces of12C18O are present. |
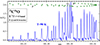 |
Fig. A.34 Spectrum of the E1 Π (v′ = 3)–X1Σ+(v′′ = 0) band for 13C16O at ~90 K. |
 |
Fig. A.35 Spectra of the E1Π(v′ = 3)–X1Σ+(v′′ = 0) band for 13C16O at ~90 K (at two pressures) and 13C18O at room temperature (in black) and ~90 K (with two different blues). |
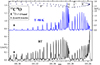 |
Fig. A.36 Spectra of the E1Π(v′ = 3)–X1Σ+(v′′ = 0) band for 13C18O at room temperature (RT) and at ~90 K. The asteriskshows an impurity line in the gas filter. |
Measured transition wavelengths and wavenumbers of the E1 Π (v′ = 0)–X1Σ+(v′′ = 0) band for 12C16O, 12 C17O, and 12 C18O.
Measured transition wavelengths and wavenumbers of the E1 Π (v′ = 0)–X1Σ+(v′′ = 0) band for 13C16O, 13 C17O, and 13 C18O (same column description as for Table A.19).
Term values (cm−1) of the E1Π(v′ = 0) e- and f-parity levels for six CO isotopologues.
Measured transition wavelengths and wavenumbers of the E1 Π (v′ = 1)–X1Σ+(v′′ = 0) band for 12C16O, 12 C17O, and 12 C18O (same column description as for Table A.19).
Measured transition wavelengths and wavenumbers of the E1 Π (v′ = 1)–X1Σ+(v′′ = 0) band for 13C16O, 13 C17O, and 13 C18O (same column description as for Table A.19).
Term values (cm−1) of the E1Π(v′ = 1) e- and f-parity levels for six CO isotopologues (see note to Table A.21).
Measured transition wavelengths and wavenumbers of the E1 Π (v′ = 2)–X1Σ+(v′′ = 0) band for 12C16O, 12 C17O, and 12 C18O (same column description as for Table A.19).
Measured transition wavelengths and wavenumbers of the E1 Π (v′ = 2)–X1Σ+(v′′ = 0) band for 13C16O, 13 C17O, and 13 C18O (same column description as for Table A.19).
Measured transition wavelengths and wavenumbers of the E1 Π (v′ = 3)–X1Σ+(v′′ = 0) band for 12C16O, 12 C17O, and 12 C18O (same column description as for Table A.19).
Measured transition wavelengths and wavenumbers of the E1 Π (v′ = 3)–X1Σ+(v′′ = 0) band for 13C16O, 13 C17O, and 13 C18O (same column description as for Table A.19).
Term values (cm−1) of the E1Π(v′ = 2) e- and f-parity levels for six CO isotopologues (see note to Table A.21).
Term values (cm−1) of the E1Π(v′ = 3) e- and f-parity levels for six CO isotopologues (see note to Table A.21).
Molecular constants Tv, Bv, and Dv of the six CO isotopologues for each state, B1 Σ +, C1 Σ +, and E1Π for e- and f-parity (Dv is always kept as a free parameter in the fitting process).
Molecular constants Tv (1), qv, and qDv of the six CO isotopologues for the E1 Π state, calculated from the previous table: Tv (J = 1) is the average of Tv for e- and f-parity, qv = Be − Bf, and qDv = De − Df.
Molecular constants qv and qDv of the six CO isotopologues for the E1 Π state, obtained from a second-order regression through the data.
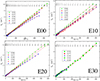 |
Fig. A.37 Λ-type doubling (in cm−1) vs. J × (J + 1) of E00, E10, and E20 for the six isotopologues and of E30 for five isotopologues. For E10, we combined our dataset for the R- and P-branches and the Q-branch of Ubachs et al. (2000). A polynomial fit is also drawn; it is linear in most cases. |
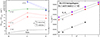 |
Fig. A.38 Trend comparison for the six CO isotopologues. Left: term value differences between 16 O- and 18 O-bearing isotopologues for 12C and 13 C (dotted and solid lines, respectively) versus the B, C, and E states. Right: Tv versus v′ for the B, C, and E states (each datapoint contains up to six isotopologues). For each state, alinear fit is drawn through all isotopologues. |
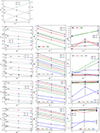 |
Fig. A.39 Molecular constants for the six CO isotopologues. Top row: B0 and D0 for v′′ = 0 of the X1Σ+ ground state(T0 = 0 for all). The standard deviation (at 2σ) is shown between two short horizontal bars. For TV, all values arein cm−1, with δ values indicating the local spacing between ticks. |
References
- Baker, J. J. 1994, J. Mol. Spec., 167, 323 [NASA ADS] [CrossRef] [Google Scholar]
- Baker, J., & Launay, F. 1994, J. Mol. Spec., 165, 75 [NASA ADS] [CrossRef] [Google Scholar]
- Baker, J., Lemaire, J. L., Couris, S., et al. 1993, Chem. Phys., 178, 569 [NASA ADS] [CrossRef] [Google Scholar]
- Baker, J., Lemaire, J. L., Couris, S., et al. 1994, AIP Conf. Proc., 312, 355 [NASA ADS] [CrossRef] [Google Scholar]
- Brandi, F., Velchev, I., Hogervorst, W., & Ubachs, W. 2001, Phys. Rev. A, 64, 032505 [NASA ADS] [CrossRef] [Google Scholar]
- Brandi, F., Hogervorst, W., & Ubachs, W. 2002, J. Phys. B, 35, 1071 [NASA ADS] [CrossRef] [Google Scholar]
- Cacciani, P., & Ubachs, W. 2004, J. Mol. Spectr., 225, 62 [NASA ADS] [CrossRef] [Google Scholar]
- Cacciani, P., Hogervorst, W., & Ubachs, W. 1995, J. Chem. Phys, 102, 8308 [NASA ADS] [CrossRef] [Google Scholar]
- Cacciani, P., Brandi, F., Velchev, I., et al. 2001, Eur. Phys. J. D, 15, 47 [NASA ADS] [CrossRef] [EDP Sciences] [Google Scholar]
- Daprà, M., Niu, M. L., Salumbides, E. J., Murphy, T., & Ubachs, W. 2016, ApJ, 826, 192 [NASA ADS] [CrossRef] [Google Scholar]
- de Oliveira, N., Joyeux, D., Phalippou, D., et al. 2009, Rev. Sci. Instrum., 80, 043101 [NASA ADS] [CrossRef] [Google Scholar]
- de Oliveira, N., Roudjane, M., Joyeux, D., et al. 2011, Nat. Photon., 5, 149 [NASA ADS] [CrossRef] [Google Scholar]
- de Oliveira, N., Joyeux, D., Roudjane, M., et al. 2016, J. Synchrotron Radiat, 23, 887 [CrossRef] [Google Scholar]
- Drabbels, M., Meerts, W. L., & ter Meulen, J. J. 1993a, J. Chem. Phys., 99, 2352 [NASA ADS] [CrossRef] [Google Scholar]
- Drabbels, M., Heinze, J., ter Meulen, J. J., & Meerts, W. L. 1993b, J. Chem. Phys., 99, 5701 [NASA ADS] [CrossRef] [Google Scholar]
- Eidelsberg, M., & Rostas, F. 1990, A&A, 235, 472 [NASA ADS] [Google Scholar]
- Eidelsberg, M., Roncin, J.-Y., Le Floch, A., et al. 1987, J. Mol. Spectr., 121, 309 [NASA ADS] [CrossRef] [Google Scholar]
- Eidelsberg, M., Benayoun, J. J., Viala, Y. P., & Rostas, F. 1991, A&AS, 90, 231 [NASA ADS] [CrossRef] [Google Scholar]
- Eidelsberg, M., Benayoun, J. J., Viala, Y. P., et al. 1992, A&A, 265, 839 [NASA ADS] [Google Scholar]
- Eidelsberg, M., Lemaire, J. L., Federman, S., et al. 2012, A&A, 543, A69 [NASA ADS] [CrossRef] [EDP Sciences] [Google Scholar]
- Eidelsberg, M., Lemaire, J. L., Federman, S. R., et al. 2014, A&A, 566, A96 [NASA ADS] [CrossRef] [EDP Sciences] [Google Scholar]
- Eidelsberg, M., Lemaire, J. L., Federman, S. R., et al. 2017, A&A, 602, A76 [NASA ADS] [CrossRef] [EDP Sciences] [Google Scholar]
- Farrenq, R., Guelachvili, G., Sauval, A. J., Grevesse, N., & Farmer, C. B. 1991, J. Mol. Spectr., 149, 375 [NASA ADS] [CrossRef] [Google Scholar]
- Federman, S. R., Fritts, M., Cheng, S., Menningen, K. M., Knauth, D. C., & Fulk, K. 2001, ApJS, 134, 133 [NASA ADS] [CrossRef] [Google Scholar]
- Gavilan, L., Lemaire, J. L., Eidelsberg, M., et al. 2013, J. Phys. Chem. A, 117, 9644 [CrossRef] [Google Scholar]
- Guelachvili, G., de Villeneuve, D., Farrenq, R., Urban, W., & Verges, J. 1983, J. Mol. Spectr., 98, 64 [NASA ADS] [CrossRef] [Google Scholar]
- Hakalla, R., Niu, M. L., Field, R. W., et al. 2016, RSC Adv., 6, 31588 [CrossRef] [Google Scholar]
- Hakalla, R., Niu, M. L., Field, R. W., et al. 2017, J. Quant. Spectr. Rad. Transf., 189, 312 [NASA ADS] [CrossRef] [Google Scholar]
- Haridass, C., Paddy Teddy, S., & Le Floch, A. C. 1994, J. Mol. Spectr., 168, 429 [NASA ADS] [CrossRef] [Google Scholar]
- Heays, A. N., Eidelsberg, M., Stark, G., et al. 2014, J. Chem. Phys., 141, 144311 [NASA ADS] [CrossRef] [Google Scholar]
- Herzberg, G. 1950, in Spectra of Diatomic Molecules, Molecular Spectra and Molecular Structure, 2nd ed. (New York: Van Nostrand Reinhold), 1 [Google Scholar]
- Ivanov, T. I., Salumbides, E. J., Vieitez, M. O., et al. 2008, MNRAS, 389, 4 [NASA ADS] [CrossRef] [Google Scholar]
- Kaufman, V., & Edlén, B. 1974, J. Phys. Chem. Ref. Data, 3, 825 [NASA ADS] [CrossRef] [Google Scholar]
- Lefèbvre-Brion, H., & Eidelsberg, M. 2012, J. Mol. Spectr., 271, 59 [NASA ADS] [CrossRef] [Google Scholar]
- Le Floch, A. 1992, J. Mol. Spectr. 155, 177 [NASA ADS] [CrossRef] [Google Scholar]
- Le Floch, A., & Amiot, C. 1985, Chem. Phys., 97, 379 [NASA ADS] [CrossRef] [Google Scholar]
- Lemaire, J. L., Eidelsberg, M., Heays, A. N., et al. 2016, J. Phys. B, 49, 4001 [Google Scholar]
- Letzelter, C., Eidelsberg, M., Rostas, F., Breton, J., & Thieblemont, B. 1987, Chem. Phys., 114, 273 [NASA ADS] [CrossRef] [Google Scholar]
- Morton, D. C., & Noreau, L. 1994, ApJS, 95, 301 [NASA ADS] [CrossRef] [Google Scholar]
- Nahon, L., de Oliveira, N., Garcia, G., et al. 2012, J. Synchrotron Radiat., 19, 508 [CrossRef] [PubMed] [Google Scholar]
- Nahon, L., de Oliveira, N., Garcia, G. A., et al. 2013, J. Phys. Conf. Ser., 425, 122004 [NASA ADS] [CrossRef] [Google Scholar]
- Niu, M. L., Hakalla, R., Madhu Trivikram, T., et al. 2016, Mol. Phys., 114, 2857 [NASA ADS] [CrossRef] [Google Scholar]
- Ogawa, S., & Ogawa, M. 1974, J. Mol. Spectr., 49, 4540 [CrossRef] [Google Scholar]
- Philip, J., Sprengers, J. P., Cacciani, P., de Lange, C. A., & Ubachs, W. 2004, Appl. Phys. B, 78, 737 [NASA ADS] [CrossRef] [Google Scholar]
- Stark, G., Lewis, B. R., Gibson, S. T., & England, J. P. 1999, ApJ, 520, 732 [NASA ADS] [CrossRef] [Google Scholar]
- Stark, G., Heays, A. N., Lyons, J. R., et al. 2014, ApJ, 788, 67 [NASA ADS] [CrossRef] [Google Scholar]
- Ubachs, W., Eikema, K. S. E., Levelt, P. F., et al. 1994, ApJ, 427, L55 [NASA ADS] [CrossRef] [Google Scholar]
- Ubachs, W., Hinnen, P. C., Hansen, P., et al. 1995, J. Mol. Spectr., 174, 388 [NASA ADS] [CrossRef] [Google Scholar]
- Ubachs, W., Velchev, I., & Cacciani, P. 2000, J. Chem. Phys., 113, 547 [NASA ADS] [CrossRef] [Google Scholar]
- van Dishoeck, E. F., & Black, J. H. 1988, ApJ, 334, 771 [NASA ADS] [CrossRef] [Google Scholar]
- Viala, Y. P., Letzelter, C., Eidelsberg, M., & Rostas, F. 1988, A&A, 193, 265 [NASA ADS] [Google Scholar]
- Visser, R., van Dishoeck, E. F., & Black, J. H. 2009, A&A, 503, 323 [NASA ADS] [CrossRef] [EDP Sciences] [Google Scholar]
- Yoshino, K., & Freeman, D. E. 1985, J. Opt. Soc. Am. B, 2, 1268 [NASA ADS] [CrossRef] [Google Scholar]
All Tables
References to the high-resolution calibration band or lines used (reference labels sorted by publication dates are given at the bottom of the table).
Rotational energy levels (cm−1) of the X1Σ+ground state for six CO isotopologues (calculated from the Farrenq et al. 1991 Dunham coefficients).
Measured transition wavelengths and wavenumbers of the B1Σ+(v′ = 0)–X1Σ+(v′′ = 0) band for 12C16O, 12 C17O, and 12 C18O.
Term values (cm−1) of the B1Σ+(v′ = 2) levels for 12C16O, 12 C18O, 13 C16O, and 13 C18O.
Transition wavelengths and wavenumbers of the C1 Σ + (v′ = 0)–X1Σ+(v′′ = 0) band for 13C16O, 13 C17O, and 13 C18O (same column description as for Table A.1).
Transition wavelengths and wavenumbers of the C1 Σ + (v′ = 1)–X1Σ+(v′′ = 0) band for 12C16O, 12 C17O, and 12 C18O (same column description as for Table A.1).
Transition wavelengths and wavenumbers of the C1 Σ + (v′ = 1)–X1Σ+(v′′ = 0) band for 13C16O, 13 C17O, and 13 C18O (same column description as for Table A.1).
Transition wavelengths and wavenumbers of the C1 Σ + (v′ = 2)–X1Σ+(v′′ = 0) band for 12C16O, 12 C18O, 13 C16O, and 13 C18O (same column description as for Table A.1).
Term values (cm−1) of the C1Σ+(v′ = 2) levels for 12C16O, 12 C18O, 13 C16O and 13 C18O.
Transition wavelengths and wavenumbers of the C1 Σ + (v′ = 3)–X1Σ+(v′′ = 0) band for 12C16O, 12 C17O, 12 C18O, 13 C16O, and 13 C18O (same column description as for Table A.1).
Term values (cm−1) of the C1Σ+(v′ = 3) levels for 12C16O, 12 C17O, 12 C18O, 13 C16O and 13 C18O.
Measured transition wavelengths and wavenumbers of the E1 Π (v′ = 0)–X1Σ+(v′′ = 0) band for 12C16O, 12 C17O, and 12 C18O.
Measured transition wavelengths and wavenumbers of the E1 Π (v′ = 0)–X1Σ+(v′′ = 0) band for 13C16O, 13 C17O, and 13 C18O (same column description as for Table A.19).
Term values (cm−1) of the E1Π(v′ = 0) e- and f-parity levels for six CO isotopologues.
Measured transition wavelengths and wavenumbers of the E1 Π (v′ = 1)–X1Σ+(v′′ = 0) band for 12C16O, 12 C17O, and 12 C18O (same column description as for Table A.19).
Measured transition wavelengths and wavenumbers of the E1 Π (v′ = 1)–X1Σ+(v′′ = 0) band for 13C16O, 13 C17O, and 13 C18O (same column description as for Table A.19).
Term values (cm−1) of the E1Π(v′ = 1) e- and f-parity levels for six CO isotopologues (see note to Table A.21).
Measured transition wavelengths and wavenumbers of the E1 Π (v′ = 2)–X1Σ+(v′′ = 0) band for 12C16O, 12 C17O, and 12 C18O (same column description as for Table A.19).
Measured transition wavelengths and wavenumbers of the E1 Π (v′ = 2)–X1Σ+(v′′ = 0) band for 13C16O, 13 C17O, and 13 C18O (same column description as for Table A.19).
Measured transition wavelengths and wavenumbers of the E1 Π (v′ = 3)–X1Σ+(v′′ = 0) band for 12C16O, 12 C17O, and 12 C18O (same column description as for Table A.19).
Measured transition wavelengths and wavenumbers of the E1 Π (v′ = 3)–X1Σ+(v′′ = 0) band for 13C16O, 13 C17O, and 13 C18O (same column description as for Table A.19).
Term values (cm−1) of the E1Π(v′ = 2) e- and f-parity levels for six CO isotopologues (see note to Table A.21).
Term values (cm−1) of the E1Π(v′ = 3) e- and f-parity levels for six CO isotopologues (see note to Table A.21).
Molecular constants Tv, Bv, and Dv of the six CO isotopologues for each state, B1 Σ +, C1 Σ +, and E1Π for e- and f-parity (Dv is always kept as a free parameter in the fitting process).
Molecular constants Tv (1), qv, and qDv of the six CO isotopologues for the E1 Π state, calculated from the previous table: Tv (J = 1) is the average of Tv for e- and f-parity, qv = Be − Bf, and qDv = De − Df.
Molecular constants qv and qDv of the six CO isotopologues for the E1 Π state, obtained from a second-order regression through the data.
All Figures
|
Fig. 1 Bandhead wavelengths of 12C16O states and bands studied in this work. We also include the previously used numerical index notation (34–43) (Letzelter et al. 1987; Eidelsberg & Rostas 1990, etc.). Atomic line calibrators are indicated with |: for primary lines at high accuracy (1 fm or better) and with |: for secondary lines at medium accuracy (0.1 pm) (for the latter, mostly Xe I and a few Ar I and Kr I, see the NIST atomic line tables for identification), and the 1/e undulator bandwidth are shown as well. |
| In the text | |
|
Fig. 2 Transition wavelengths of the B1Σ+(v′ = 0)–X1Σ+(v′′ = 0) band for six CO isotopologues. |
| In the text | |
|
Fig. 3 Transition wavelengths of the B1Σ+(v′ = 1)–X1Σ+(v′′ = 0) band for six CO isotopologues. |
| In the text | |
|
Fig. 4 Reduced term values (cm−1) of the B1Σ+(v′ = 0) levels for sixCO isotopologues. |
| In the text | |
|
Fig. 5 Reduced term values (cm−1) of the B1Σ+(v′ = 1) levels for sixCO isotopologues. |
| In the text | |
|
Fig. A.1 Transition wavelengths of the B1Σ+(v′ = 2)–X1Σ+(v′′ = 0) band for thefour observed CO isotopologues. |
| In the text | |
|
Fig. A.2 Reduced term values (cm−1) of the B1Σ+(v′ = 2) levels for the four observed CO isotopologues. |
| In the text | |
|
Fig. A.3 Sample of B20 spectra for the four observed isotopologues, in some cases showing perturbations. |
| In the text | |
|
Fig. A.4 Transition wavelengths of the C1Σ+(v′ = 0)–X1Σ+(v′′ = 0) band for six CO isotopologues. |
| In the text | |
|
Fig. A.5 Transition wavelengths of the C1Σ+(v′ = 1)–X1Σ+(v′′ = 0) band for six CO isotopologues. |
| In the text | |
|
Fig. A.6 Reduced term values (cm−1) of the C1Σ+(v′ = 0) levels for sixCO isotopologues. |
| In the text | |
|
Fig. A.7 Reduced term values (cm−1) of the C1Σ+(v′ = 1) levels for sixCO isotopologues. |
| In the text | |
|
Fig. A.8 Transition wavelengths of the C1 Σ + (v′ = 2)–X1Σ+(v′′ = 0) band for thefour observed CO isotopologues. |
| In the text | |
|
Fig. A.9 Reduced term values (cm−1) of the C1Σ+(v′ = 2) levels for the four observed CO isotopologues. |
| In the text | |
|
Fig. A.10 Transition wavelengths of the C1 Σ + (v′ = 3)–X1Σ+(v′′ = 0) band for thefour observed CO isotopologues. |
| In the text | |
|
Fig. A.11 Reduced term values (cm−1) of the C1Σ+(v′ = 3) levels for the five observed CO isotopologues. |
| In the text | |
|
Fig. A.12 Transition wavelengths of the E1 Π (v′ = 0)–X1Σ+(v′′ = 0) band for six CO isotopologues. |
| In the text | |
|
Fig. A.13 e-parity reduced term values (cm−1) of the E1Π(v′ = 0) levels for six CO isotopologues. Data marked with a black center are kept to calculate molecular constants. |
| In the text | |
|
Fig. A.14 f-parity reduced term values (cm−1) of the E1Π(v′ = 0) levels for six CO isotopologues (data marked with a black center are kept to calculate molecular constants). |
| In the text | |
|
Fig. A.15 Spectra of the E1Π(v′ = 0)–X1Σ+(v′′ = 0) band for 13C16O and 12 C16O. Thelower graph shows a ×10 expanded scale on the Q-branch between the red arrows). |
| In the text | |
|
Fig. A.16 Top: spectra of the E1 Π (v′ = 0)–X1Σ+(v′′ = 0) band for 13C18O (three spectra at different pressures [saturated, half saturated, and no saturation]: 0.5/0.03/0.004 mbar, respectively, in blue/black/red colors; the scale to the right is valid for the highest pressure and has to be divided by 2 and 10 for the latter ones) and 13 C16O (two spectra [saturated and no saturation]: 0.5/0.005 mbar respectively in olive/green colors; the scale to the left is the same for both pressures). Bottom: this is an ×8 expanded scale on the Q-branch between the red arrows (same color codes and same relative scales as above). |
| In the text | |
|
Fig. A.17 Transition wavelengths of the E1 Π (v′ = 1)–X1Σ+(v′′ = 0) band for six CO isotopologues. |
| In the text | |
|
Fig. A.18 e-parity reduced term values (cm−1) of the E1Π(v′ = 1) levels for six CO isotopologues (left). Data marked with a black center are kept to calculate molecular constants. |
| In the text | |
|
Fig. A.19 f-parity reduced term values (cm−1) of the E1Π(v′ = 1) levels for six CO isotopologues (data marked with a black center are kept to calculate molecular constants). |
| In the text | |
|
Fig. A.20 Spectra of the E1Π(v′ = 1)–X1Σ+(v′′ = 0) band for 12C16O. Two upper panels: RT spectra taken at different pressures. Third panel: comparison between 90 K (1 pressure) and room-temperature spectra (all pressures). Lower panel: ×5 expandedscale on the region indicated by black arrows on the above panel. This region contains among other lines those of the k3 Π (v′ = 5) perturbing band (around 105.205 nm), while k3 Π (v′ = 6) appears around 105.14 nm. |
| In the text | |
|
Fig. A.21 Spectra of the E1Π(v′ = 1)–X1Σ+(v′′ = 0) band for 12C17O at 90 K and at room temperature (two pressures for the latter). Second panel: zoom of the central part of the upper panel (×3 zoom). Third panel: RT spectrum after weighted subtraction of 12 C16O and 12 C18O spectra (the signal in the Q-branch, in black, is divided by 7). Lower panel: simulated absorption spectrum of the Q-branch at room temperature. |
| In the text | |
|
Fig. A.22 Spectra of the E1Π(v′ = 1)–X1Σ+(v′′ = 0) band for 12C18O at 90 K and room temperature (both at two pressures). |
| In the text | |
|
Fig. A.23 Spectra of the E1Π(v′ = 1)–X1Σ+(v′′ = 0) band for 13C16O at 90 K and room temperature. |
| In the text | |
|
Fig. A.24 Upper panel: spectra of the E1 Π (v′ = 1)–X1Σ+(v′′ = 0) band for 13C18O at 90 K and room temperature. Lower panel: ×4 expanded scale on the Q-branch between the black arrows. |
| In the text | |
|
Fig. A.25 Transition wavelengths of the E1 Π (v′ = 2)–X1Σ+(v′′ = 0) band for five CO isotopologues. |
| In the text | |
|
Fig. A.26 Reduced term values (cm−1) of the E1Π(v′ = 2) levels for five CO isotopologues (left: e-parity and right: f-parity). Data marked with a black center are kept to calculate molecular constants. |
| In the text | |
|
Fig. A.27 Spectra of the E1Π(v′ = 2)–X1Σ+(v′′ = 0) band. Upper panel: Simulated absorption spectra of the Q-branch of the for 12C16O at 90 K and at room temperature. Lower panels: spectra of 13 C16O (left) and 13C18O (right). Lowest panel: ×10 expanded scale on the Q-branch between the red arrows). |
| In the text | |
|
Fig. A.28 Transition wavelengths of the E1 Π (v′ = 3)–X1Σ+(v′′ = 0) band for thefive observed CO isotopologues. |
| In the text | |
|
Fig. A.29 Reduced term values (cm−1) of the E1Π(v′ = 3) levels for the five observed CO isotopologues (left: e-parity, and right: f-parity). |
| In the text | |
|
Fig. A.30 Spectra of the E1Π(v′ = 3)–X1Σ+(v′′ = 0) band for 12C16O at room temperature (RT) and at ~90 K. Simulations below, in emission, of the upper experimental spectra (using classical Hönl–London factors). |
| In the text | |
|
Fig. A.31 Spectra of the E1Π(v′ = 3)–X1Σ+(v′′ = 0) band for 12C17O at ~90 K. Traces of 12C18O are present around 101.185 nm. |
| In the text | |
|
Fig. A.32 Spectra of the E1Π(v′ = 3)–X1Σ+(v′′ = 0) band for 12C18O at ~90 K. |
| In the text | |
|
Fig. A.33 Spectra of the E1Π(v′ = 3)–X1Σ+(v′′ = 0) band for 12C16O, 12 C17O, and 12 C18O at ~90 K. 12 C17O is about equally mixed with 12 C16O, and traces of12C18O are present. |
| In the text | |
|
Fig. A.34 Spectrum of the E1 Π (v′ = 3)–X1Σ+(v′′ = 0) band for 13C16O at ~90 K. |
| In the text | |
|
Fig. A.35 Spectra of the E1Π(v′ = 3)–X1Σ+(v′′ = 0) band for 13C16O at ~90 K (at two pressures) and 13C18O at room temperature (in black) and ~90 K (with two different blues). |
| In the text | |
|
Fig. A.36 Spectra of the E1Π(v′ = 3)–X1Σ+(v′′ = 0) band for 13C18O at room temperature (RT) and at ~90 K. The asteriskshows an impurity line in the gas filter. |
| In the text | |
|
Fig. A.37 Λ-type doubling (in cm−1) vs. J × (J + 1) of E00, E10, and E20 for the six isotopologues and of E30 for five isotopologues. For E10, we combined our dataset for the R- and P-branches and the Q-branch of Ubachs et al. (2000). A polynomial fit is also drawn; it is linear in most cases. |
| In the text | |
|
Fig. A.38 Trend comparison for the six CO isotopologues. Left: term value differences between 16 O- and 18 O-bearing isotopologues for 12C and 13 C (dotted and solid lines, respectively) versus the B, C, and E states. Right: Tv versus v′ for the B, C, and E states (each datapoint contains up to six isotopologues). For each state, alinear fit is drawn through all isotopologues. |
| In the text | |
|
Fig. A.39 Molecular constants for the six CO isotopologues. Top row: B0 and D0 for v′′ = 0 of the X1Σ+ ground state(T0 = 0 for all). The standard deviation (at 2σ) is shown between two short horizontal bars. For TV, all values arein cm−1, with δ values indicating the local spacing between ticks. |
| In the text | |
Current usage metrics show cumulative count of Article Views (full-text article views including HTML views, PDF and ePub downloads, according to the available data) and Abstracts Views on Vision4Press platform.
Data correspond to usage on the plateform after 2015. The current usage metrics is available 48-96 hours after online publication and is updated daily on week days.
Initial download of the metrics may take a while.