Fig. A.16
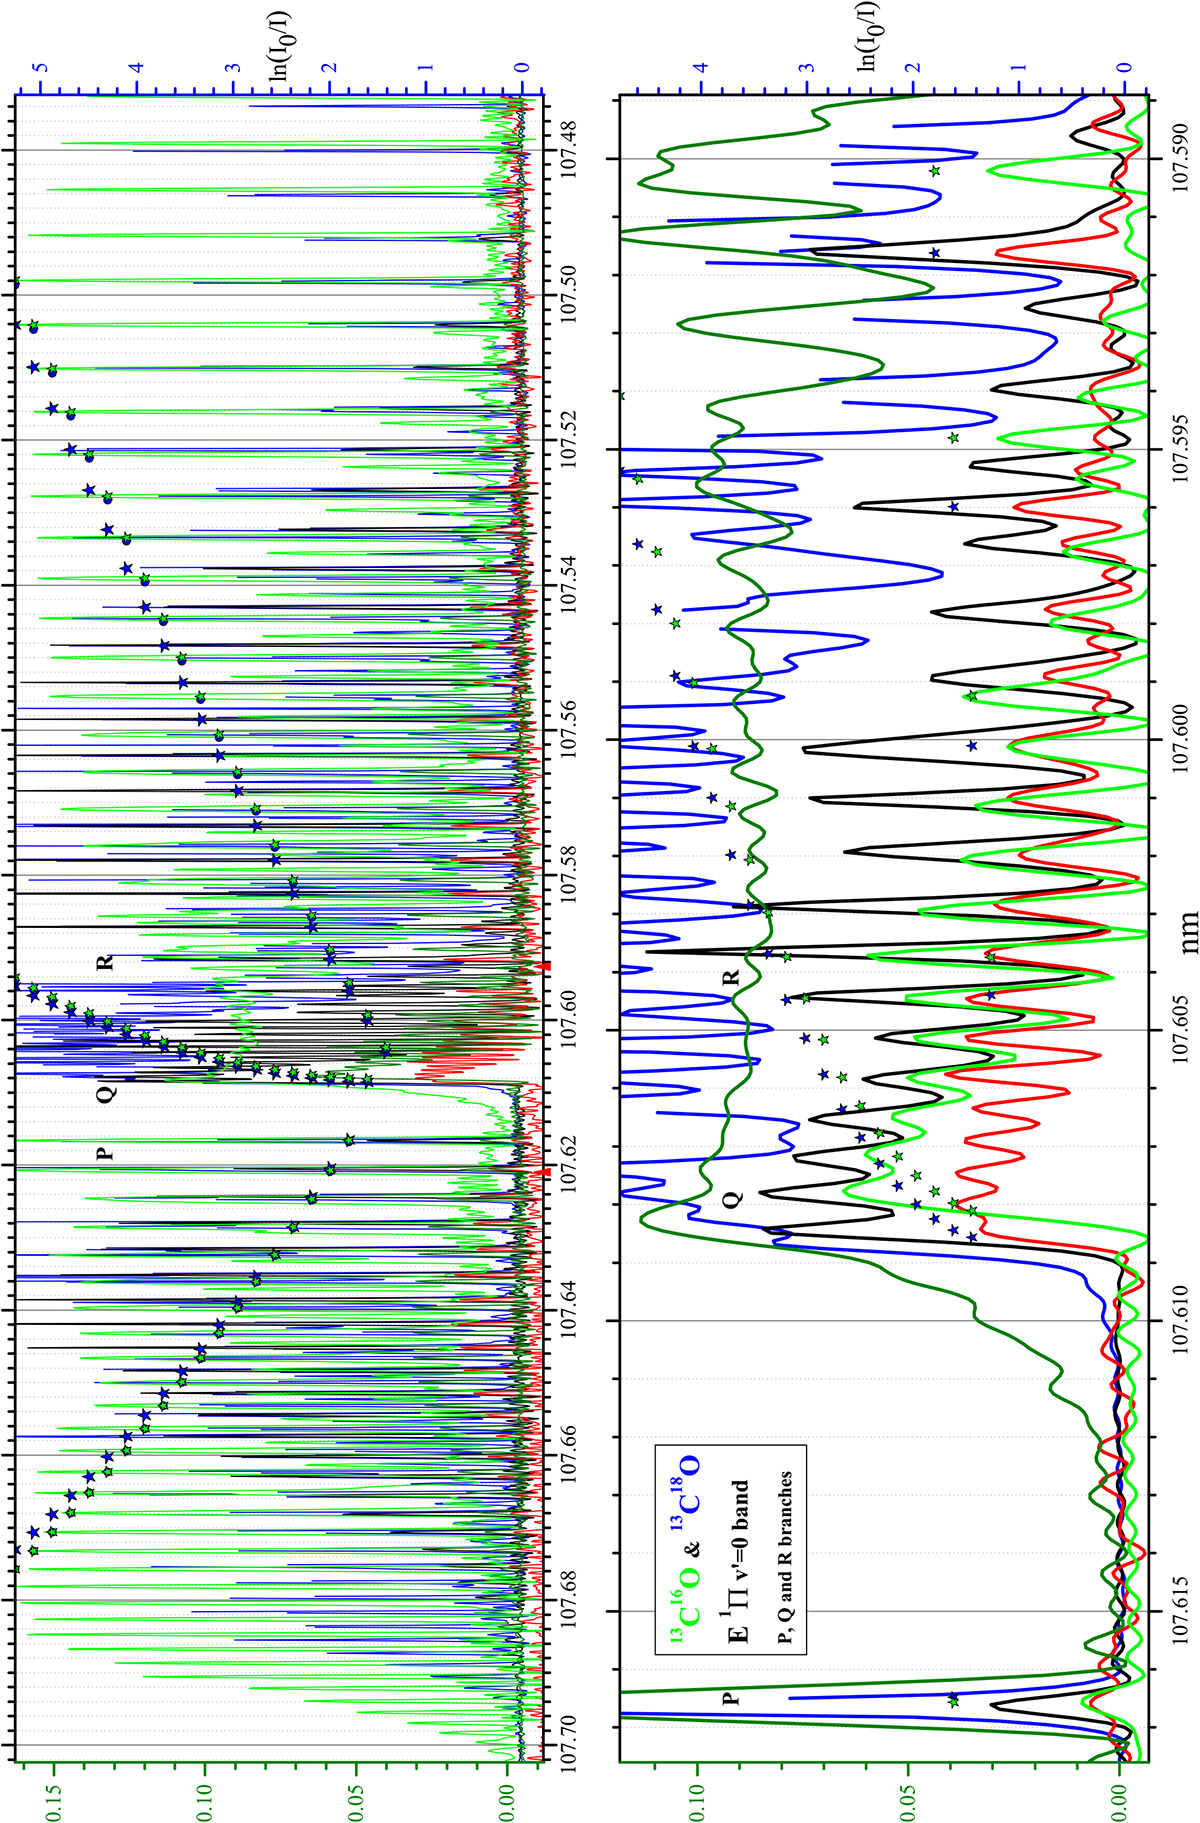
Top: spectra of the E1 Π (v′ = 0)–X1Σ+(v′′ = 0) band for 13C18O (three spectra at different pressures [saturated, half saturated, and no saturation]: 0.5/0.03/0.004 mbar, respectively, in blue/black/red colors; the scale to the right is valid for the highest pressure and has to be divided by 2 and 10 for the latter ones) and 13 C16O (two spectra [saturated and no saturation]: 0.5/0.005 mbar respectively in olive/green colors; the scale to the left is the same for both pressures). Bottom: this is an ×8 expanded scale on the Q-branch between the red arrows (same color codes and same relative scales as above).
Current usage metrics show cumulative count of Article Views (full-text article views including HTML views, PDF and ePub downloads, according to the available data) and Abstracts Views on Vision4Press platform.
Data correspond to usage on the plateform after 2015. The current usage metrics is available 48-96 hours after online publication and is updated daily on week days.
Initial download of the metrics may take a while.