Fig. A.38
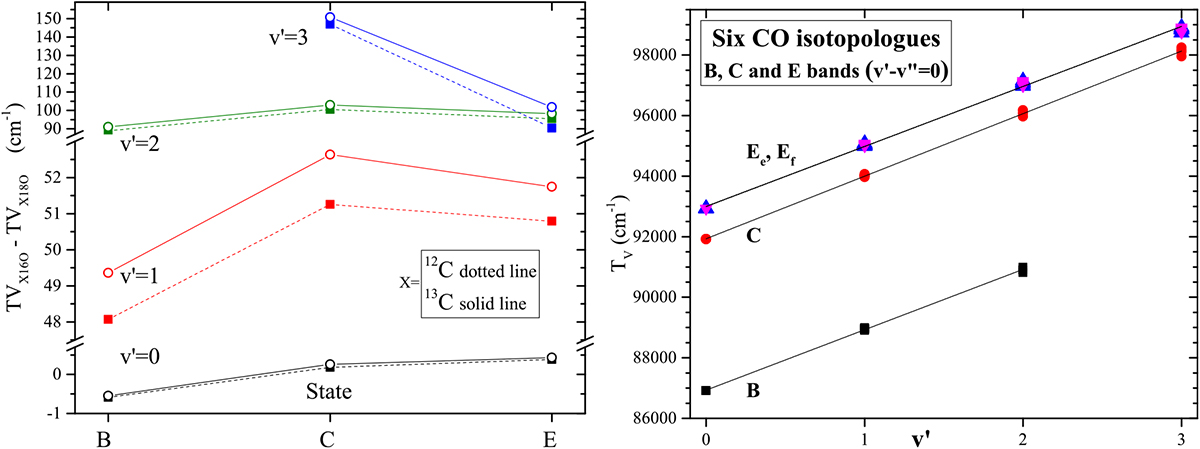
Trend comparison for the six CO isotopologues. Left: term value differences between 16 O- and 18 O-bearing isotopologues for 12C and 13 C (dotted and solid lines, respectively) versus the B, C, and E states. Right: Tv versus v′ for the B, C, and E states (each datapoint contains up to six isotopologues). For each state, alinear fit is drawn through all isotopologues.
Current usage metrics show cumulative count of Article Views (full-text article views including HTML views, PDF and ePub downloads, according to the available data) and Abstracts Views on Vision4Press platform.
Data correspond to usage on the plateform after 2015. The current usage metrics is available 48-96 hours after online publication and is updated daily on week days.
Initial download of the metrics may take a while.