Fig. A.21
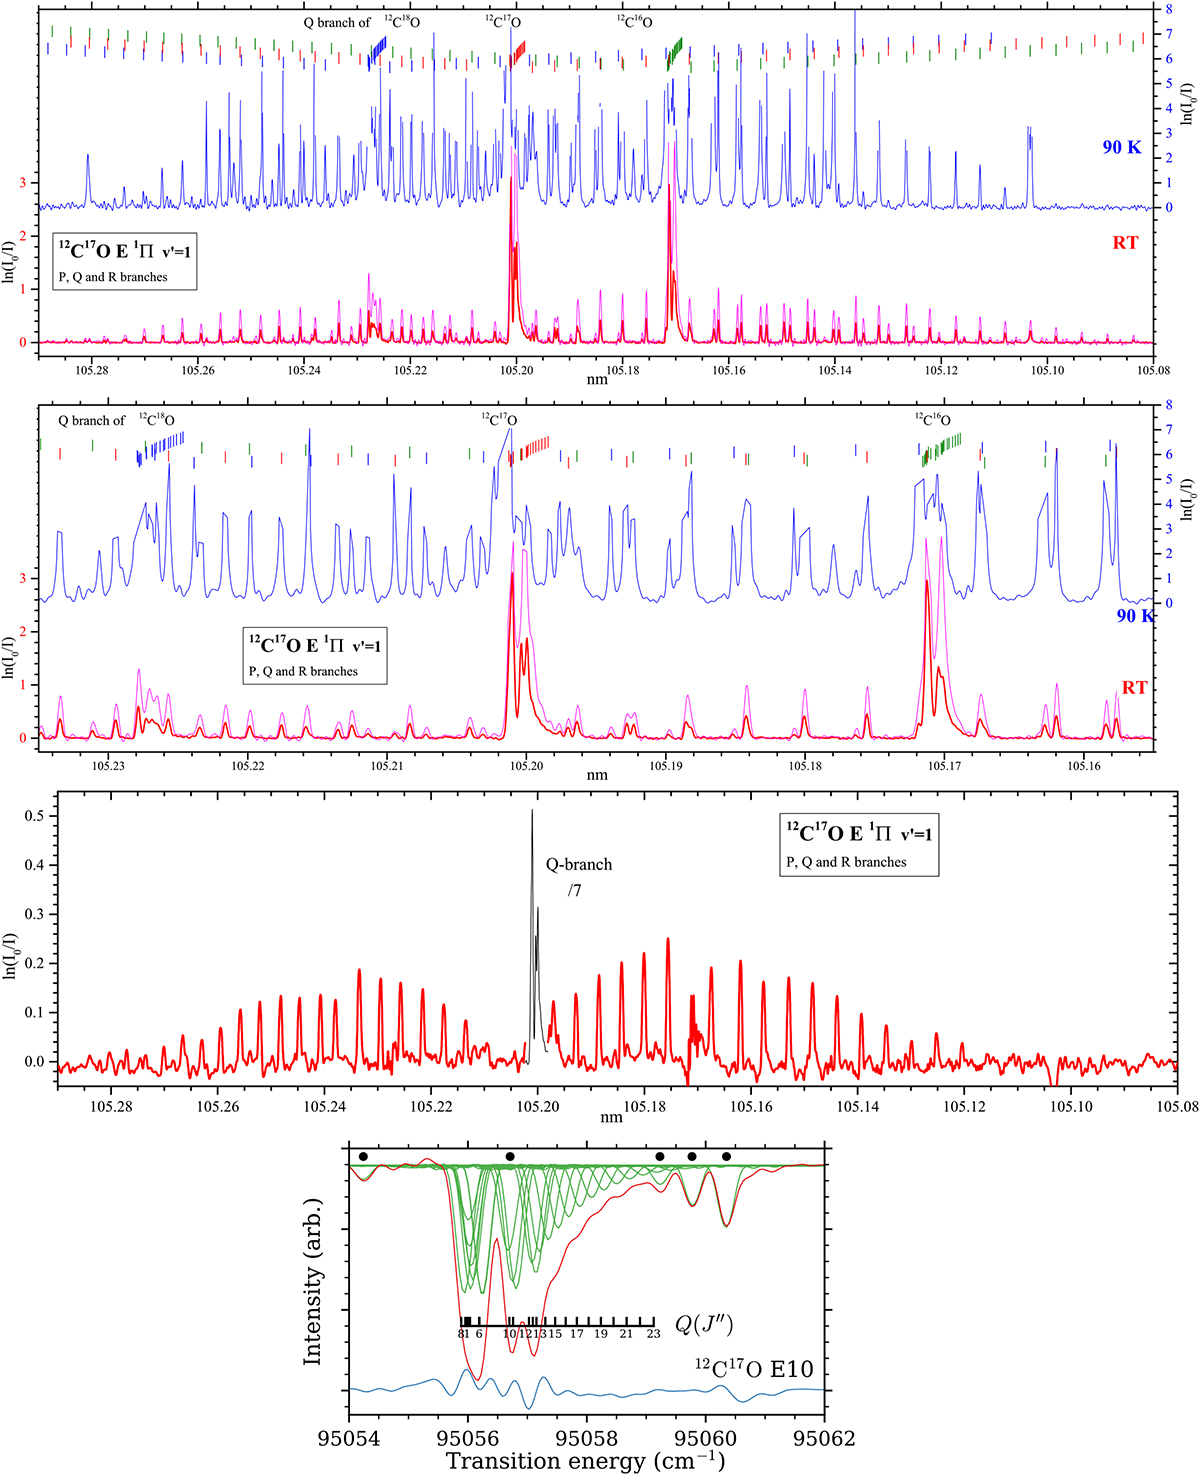
Spectra of the E1Π(v′ = 1)–X1Σ+(v′′ = 0) band for 12C17O at 90 K and at room temperature (two pressures for the latter). Second panel: zoom of the central part of the upper panel (×3 zoom). Third panel: RT spectrum after weighted subtraction of 12 C16O and 12 C18O spectra (the signal in the Q-branch, in black, is divided by 7). Lower panel: simulated absorption spectrum of the Q-branch at room temperature.
Current usage metrics show cumulative count of Article Views (full-text article views including HTML views, PDF and ePub downloads, according to the available data) and Abstracts Views on Vision4Press platform.
Data correspond to usage on the plateform after 2015. The current usage metrics is available 48-96 hours after online publication and is updated daily on week days.
Initial download of the metrics may take a while.