Fig. A.20
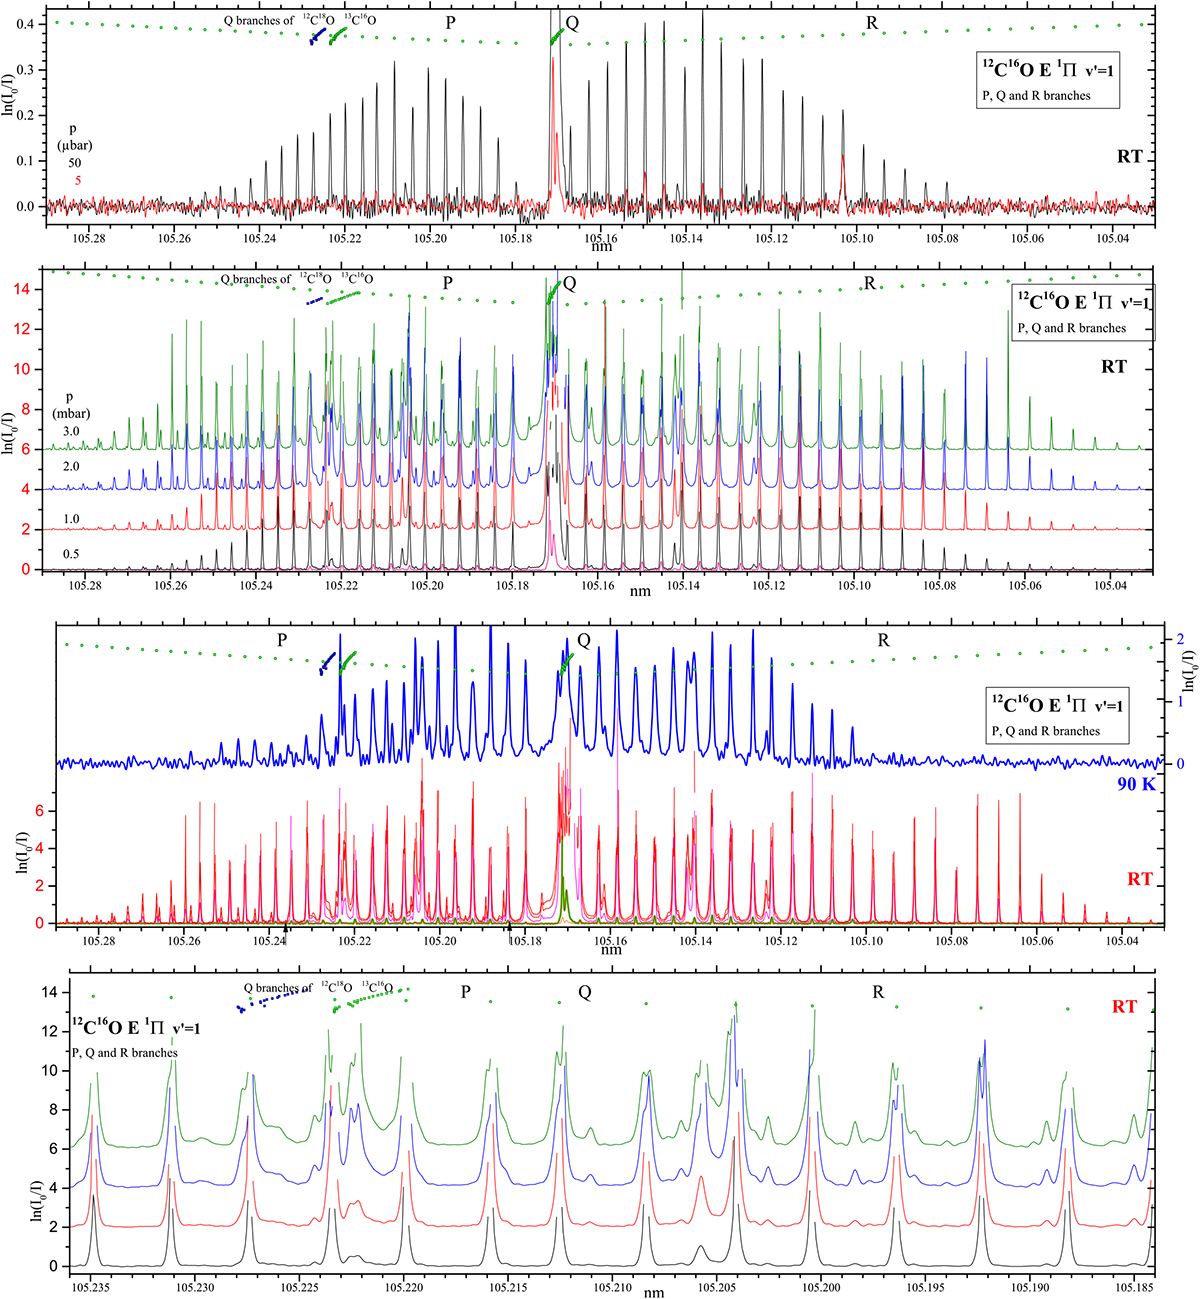
Spectra of the E1Π(v′ = 1)–X1Σ+(v′′ = 0) band for 12C16O. Two upper panels: RT spectra taken at different pressures. Third panel: comparison between 90 K (1 pressure) and room-temperature spectra (all pressures). Lower panel: ×5 expandedscale on the region indicated by black arrows on the above panel. This region contains among other lines those of the k3 Π (v′ = 5) perturbing band (around 105.205 nm), while k3 Π (v′ = 6) appears around 105.14 nm.
Current usage metrics show cumulative count of Article Views (full-text article views including HTML views, PDF and ePub downloads, according to the available data) and Abstracts Views on Vision4Press platform.
Data correspond to usage on the plateform after 2015. The current usage metrics is available 48-96 hours after online publication and is updated daily on week days.
Initial download of the metrics may take a while.