| Issue |
A&A
Volume 609, January 2018
|
|
|---|---|---|
| Article Number | A16 | |
| Number of page(s) | 14 | |
| Section | Interstellar and circumstellar matter | |
| DOI | https://doi.org/10.1051/0004-6361/201731849 | |
| Published online | 22 December 2017 | |
Kinetic temperature of massive star-forming molecular clumps measured with formaldehyde
III. The Orion molecular cloud 1⋆
1 Max-Planck-Institut für Radioastronomie, Auf dem Hügel 69, 53121 Bonn, Germany
e-mail: This email address is being protected from spambots. You need JavaScript enabled to view it.
2 Xinjiang Astronomical Observatory, Chinese Academy of Sciences, 830011 Urumqi, PR China
3 Key Laboratory of Radio Astronomy, Chinese Academy of Sciences, 830011 Urumqi, PR China
4 Astronomy Department, King Abdulaziz University, PO Box 80203, 21589 Jeddah, Saudi Arabia
5 Department of Astronomy, Nanjing University, 210093 Nanjing, PR China
6 Purple Mountain Observatory & Key Laboratory for Radio Astronomy, Chinese Academy of Sciences, 210008 Nanjing, PR China
Received: 28 August 2017
Accepted: 22 September 2017
Abstract
We mapped the kinetic temperature structure of the Orion molecular cloud 1 (OMC-1) with para-H2CO (JKaKc = 303–202, 322–221, and 321–220) using the APEX 12 m telescope. This is compared with the temperatures derived from the ratio of the NH3 (2, 2)/(1, 1) inversion lines and the dust emission. Using the RADEX non-LTE model, we derive the gas kinetic temperature modeling the measured averaged line ratios of para-H2CO 322–221/303–202 and 321–220/303–202. The gas kinetic temperatures derived from the para-H2CO line ratios are warm, ranging from 30 to >200 K with an average of 62 ± 2 K at a spatial density of 105 cm-3. These temperatures are higher than those obtained from NH3 (2, 2)/(1, 1) and CH3CCH (6–5) in the OMC-1 region. The gas kinetic temperatures derived from para-H2CO agree with those obtained from warm dust components measured in the mid infrared (MIR), which indicates that the para-H2CO (3–2) ratios trace dense and warm gas. The cold dust components measured in the far infrared (FIR) are consistent with those measured with NH3 (2, 2)/(1, 1) and the CH3CCH (6–5) line series. With dust at MIR wavelengths and para-H2CO (3–2) on one side, and dust at FIR wavelengths, NH3 (2, 2)/(1, 1), and CH3CCH (6–5) on the other, dust and gas temperatures appear to be equivalent in the dense gas (n(H2) ≳ 104 cm-3) of the OMC-1 region, but provide a bimodal distribution, one more directly related to star formation than the other. The non-thermal velocity dispersions of para-H2CO are positively correlated with the gas kinetic temperatures in regions of strong non-thermal motion (Mach number ≳ 2.5) of the OMC-1, implying that the higher temperature traced by para-H2CO is related to turbulence on a ~0.06 pc scale. Combining the temperature measurements with para-H2CO and NH3 (2, 2)/(1, 1) line ratios, we find direct evidence for the dense gas along the northern part of the OMC-1 10 km s-1 filament heated by radiation from the central Orion nebula.
Key words: stars: formation / stars: massive / ISM: clouds / ISM: molecules / radio lines: ISM
The reduced datacubes are only available at the CDS via anonymous ftp to cdsarc.u-strasbg.fr (130.79.128.5) or via http://cdsarc.u-strasbg.fr/viz-bin/qcat?J/A+A/609/A16
© ESO, 2017
1. Introduction
At a distance of ≈ 400 pc (Menten et al. 2007; Kounkel et al. 2017), Orion A and B are the nearest giant molecular clouds (GMCs; e.g., O’Dell et al. 2008). Within Orion A, Orion molecular cloud 1 (OMC-1) abuts the Orion nebula (M42), a prominent H II region that harbors the Trapezium O-/early B-type stars and is ionized by one of them, θ1 C Ori. This star also excites the Orion Bar, a dense photon-dominated region (PDR), which is a protrusion of OMC-1 in which the neutral cloud acquires a nearly edge-on geometry, so that the optically thin PDR emission is limb-brightened. Star formation in OMC-1 is thought to be taking place in two locations: in the Kleinmann-Low (KL) Nebula and in Orion South. While evidence exists for low- or intermediate-mass star formation in Orion-S (Zapata et al. 2004), the amount of star formation activity in KL is under debate. In particular, Zapata et al. (2011) have challenged the view that the famous “hot core” located in that region is powered by a young high-mass stellar object.
OMC-1 is a unique region for studying the physical and chemical conditions of molecular clouds. A large number of molecular line observations have been performed, such as in CO (e.g., Bally et al. 1987; Goldsmith et al. 1997; Wilson et al. 2005; Peng et al. 2012;Buckle et al. 2012; Shimajiri et al. 2011, 2014; Berné et al. 2014), CS (e.g., Tatematsu et al. 1993, 1998), N2H+ (e.g., Tatematsu et al. 2008; Melnick et al. 2011; Hacar et al. 2017), NH3 (e.g., Batrla et al. 1983; Bastien et al. 1985; Murata et al. 1990; Wiseman & Ho 1996, 1998; Batrla & Wilson 2003; Friesen et al. 2017), H2CO (e.g., Thaddeus et al. 1971; Kutner et al. 1976; Cohen & Few 1981; Batrla et al. 1983; Bastien et al. 1985; Mangum et al. 1990, 1993; van der Wiel et al. 2009; Leurini et al. 2010), HC3N (e.g., Martín-Pintado et al. 1990; Rodríguez et al. 1992; Bergin et al. 1996), and HCN (e.g., Schilke et al. 1992; Melnick et al. 2011). These observations revealed the distribution of the dense gas within OMC-1 down to a ~0.1 pc scale. In addition to molecular line observations, (sub)millimeter continuum observations have revealed remarkable filamentary structure over the entire Orion A molecular cloud with a length of ~7 pc (e.g., Lis et al. 1998; Johnston & Bally 1999; Shimajiri et al. 2011; Salji et al. 2015; Stutz & Kainulainen 2015; Kainulainen et al. 2017).
Ammonia (NH3) is frequently used as the standard molecular cloud thermometer (e.g., Ho & Townes 1983; Walmsley & Ungerechts 1983; Danby et al. 1988; Mangum et al. 2013b). However, it has shown a large spread in fractional abundance (e.g., 10-5 in dense molecular “hot cores” around newly formed massive stars, Mauersberger et al. 1987; 10-8 in dark clouds, Benson & Myers 1983; Chira et al. 2013; ~10-10 in the Orion Bar PDR, Batrla & Wilson 2003) and is extremely affected by a high UV flux. In contrast, formaldehyde (H2CO) is a more ubiquitous molecule in the interstellar medium (Downes et al. 1980; Bieging et al. 1982; Cohen et al. 1983; Baan et al. 1986, 1990, 1993; Henkel et al. 1991; Zylka et al. 1992; Mangum et al. 2008, 2013a; Zhang et al. 2012; Ao et al. 2013; Tang et al. 2013; Ginsburg et al. 2015, 2016; Guo et al. 2016). Unlike ammonia, the fractional abundance of H2CO is stable at various stages of star formation (Mangum et al. 1990, 1993; Caselli et al. 1993; Johnstone et al. 2003; Gerner et al. 2014; Tang et al. 2017a,b, 2018). OMC-1 has been a valuable target for measuring lines of H2CO because of its high densities and temperatures (e.g., Mangum et al. 1990, 1993; Bergin et al. 1994, 1996; Peng et al. 2012; Gong et al. 2015b; Kauffmann et al. 2017) and subsequently large surface brightnesses (e.g., Lis et al. 1998; Johnston & Bally 1999; Megeath et al. 2012; Lombardi et al. 2014). Previous observations show that H2CO has a spatially extensive distribution in the OMC-1 region including Orion KL, Orion South, the Orion Bar, and the northern part of the OMC-1 region (e.g., Batrla et al. 1983; Bastien et al. 1985; Mangum et al. 1990, 1993; van der Wiel et al. 2009; Leurini et al. 2010).
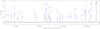 |
Fig. 1 A spectrum toward Orion KL obtained with APEX (Atacama Pathfinder EXperiment). The three H2CO lines discussed in this paper are marked in red. |
Formaldehyde is a reliable probe for tracing physical conditions of molecular clouds (Henkel et al. 1980, 1983; Mangum & Wootten 1993; Mühle et al. 2007; Ginsburg et al. 2011). It has a rich variety of millimeter and submillimeter transitions. Particularly useful are the three transitions of para-H2CO (JKaKc = 303–202, 322–221, and 321–220), which can be measured simultaneously at ~218 GHz with a bandwidth of 1 GHz. These transitions of para-H2CO may trace denser regions than NH3 (1, 1)/(2, 2) (e.g., Ott et al. 2014; Ginsburg et al. 2016). Since the relative populations of the Ka ladders of H2CO are governed by collisions, line ratios involving different Ka ladders are good tracers of the kinetic temperature (Mangum & Wootten 1993; Mühle et al. 2007). Therefore the line strength ratios of para-H2CO, 322–221/303–202 and 321–220/303–202, provide a sensitive thermometer, possibly the best of the very few which are available for the analysis of dense molecular gas. These H2CO line ratios have been used to measure physical parameters in our Galactic center clouds (Qin et al. 2008; Ao et al. 2013; Johnston et al. 2014; Ginsburg et al. 2016; Immer et al. 2016; Lu et al. 2017), star formation regions (Mangum & Wootten 1993; Hurt et al. 1996; Mitchell et al. 2001; Watanabe & Mitchell 2008; Lindberg et al. 2015; Tang et al. 2017a, 2018), as well as in external galaxies (Mühle et al. 2007; Tang et al. 2017b).
Many observations have been performed to reveal the temperatures of gas and dust in the Orion region (e.g., Downes et al. 1981; Churchwell & Hollis 1983; Bergin et al. 1994; Wiseman & Ho 1998; Mookerjea et al. 2000; Vaillancourt 2002; Batrla & Wilson 2003; Megeath et al. 2012; Peng et al. 2012; Lombardi et al. 2014; Goicoechea et al. 2015; Nishimura et al. 2015; Salgado et al. 2016; Friesen et al. 2017). However, critical links between H2CO and other measurements of gas temperatures as well as dust temperatures are still unclear. In this paper, we aim to map the kinetic temperature structure of the OMC-1 region with three transitions of para-H2CO (JKaKc = 303–202, 322–221, and 321–220). In Sects. 2 and 3, we introduce our observation of the para-H2CO triplet, data reduction, and results. We discuss the resulting kinetic temperatures derived from para-H2CO in Sect. 4. Our main conclusions are summarized in Sect. 5. This paper is part of the “Kinetic temperature of massive star-forming molecular clumps measured with formaldehyde” series of studies exploring H2CO as a probe of gas conditions in a variety of sources.
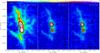 |
Fig. 2 Intensity maps ( |

2. Observations and data reduction
Our observations were carried out in 2015 October with the APEX1 12 m telescope located on Chajnantor (Chile) using the APEX-1 (SHeFI) receiver. The beam size is ~28.5′′ (~0.06 pc at ~400 pc distance; see Menten et al. 2007; Kounkel et al. 2017). The main beam efficiency and the forward efficiency were 0.75 and 0.97, respectively. The para-H2CO JKaKc = 303–202, 322–221, and 321–220 transitions have rest frequencies of 218.222, 218.475, and 218.760 GHz, respectively, which are measured simultaneously by employing the eXtended bandwidth Fast Fourier Transform Spectrometer (XFFTS) backend for two spectral windows of 2.5 GHz bandwidth. The frequency range, consisting of two spectral windows, covered 216.5–219.0 GHz and 218.0–220.5 GHz with the central frequency being set to 218.550 GHz. 32768 spectral channels were used in each window providing a velocity resolution of ~0.1 km s-1. The on-the-fly observing mode was used to measure eight 4.5 × 3.5 arcmin2 maps with steps of 9′′ in both right ascension and declination. The surveyed area of the OMC-1 is ~9 × 14 arcmin2 (~1.1 × 1.7 pc2), centered on α2000 = 05:35:12.50, δ2000 = –05:22:55.0. The observed spectrum toward Orion KL is shown in Fig. 1.
Data reduction for spectral lines and maps was performed with GILDAS2. The spectra were resampled in steps of ~14.2′′. To enhance signal to noise ratios (S/Ns) in individual channels, we smoothed contiguous channels to a velocity resolution ~0.4 km s-1. A typical rms noise level (1σ) is ~0.13 K (Tmb scale) for a channel of 0.4 km s-1 in width. In total we acquired 2472 positions, corresponding to 2472 spectra for each transition. We fit all spectra with Gaussian profiles. Nearly 50% of all positions were detected in para-H2CO 303–202 and ~16% were also detected in para-H2CO 322–221 and 321–220, respectively, with S/Ns of ≳3σ.
3. Results
3.1. Distribution of H2CO
The intensity distributions of the three transitions of para-H2CO integrated from 4 to 14 km s-1 in the OMC-1 are shown in Fig. 2. The para-H2CO 303–202 line shows an extended distribution and clearly traces the dense molecular structure, for example, Orion KL, Orion South, the Orion Bar, and molecular fingers, which confirms previous observational results of the dense gas distribution traced by H2CO (e.g., Thaddeus et al. 1971; Kutner et al. 1976; Batrla et al. 1983; Bastien et al. 1985; Mangum et al. 1990; van der Wiel et al. 2009; Leurini et al. 2010). It is also consistent with previous observational results probed with other dense gas tracers of, for example, C18O, CS, CN, HCN, HNC, HCO+, HC3N, and CH3CCH (Martín-Pintado et al. 1990; Rodríguez et al. 1992; Schilke et al. 1992; Tatematsu et al. 1993, 1998; Bergin et al. 1994, 1996; Goldsmith et al. 1997; Ungerechts et al. 1997; Buckle et al. 2012; Peng et al. 2012; Shimajiri et al. 2014). Para-H2CO 322–221 and 321–220 are only detected in the densest regions of the OMC-1, and show less extended distributions than para-H2CO 303–202.
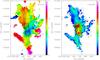 |
Fig. 3 Para-H2CO 303–202 intensity-weighted mean velocity map (moment 1, left) and velocity dispersion map (moment 2, right). The unit of each color bar is km s-1. Contours are para-H2CO 303–202 integrated intensities (same as in Fig. 2). |
The para-H2CO 303–202 intensity-weighted mean velocity (moment 1), and velocity dispersion (moment 2) maps are shown in Fig. 3, revealing complex structure. Figure A.1 shows the corresponding channel maps. The northeastern region and the star forming regions Orion KL and Orion South with their outflows are prominent at low velocities (~6–9 km s-1), while the Orion Bar and the northern region become visible at higher velocities (~9–11 km s-1). The velocity dispersion of para-H2CO (303–202) ranges from 0.7 to 6 km s-1 with an average of ~2 km s-1. Only the star forming regions Orion KL and Orion South are prominent at high velocity dispersions (>3 km s-1). In other dense regions of the OMC-1, the velocity dispersions become ~1.5–3 km s-1. The outer parts of the OMC-1 show a lower range of velocity dispersion (<1.5 km s-1).
The distribution of para-H2CO (303–202) is similar to the spatial distribution of the NH3 (1, 1) and (2, 2) emission mapped with the Green Bank Telescope (GBT; beam size ~30′′; Friesen et al. 2017) (see Fig. B.1) and all prominent features identified in the NH3 (1, 1) and (2, 2) lines are detected in para-H2CO (303–202) at a scale of ~0.06 pc in the OMC-1. The similar distributions of H2CO (303–202) and NH3 (1, 1) and (2, 2) in the OMC-1 region are consistent with previous observational results in the Galactic Central Molecular Zone (CMZ) on a ~0.1 pc scale (Lu et al. 2017). The strongest H2CO (303–202) emission associates with the massive star formation regions Orion KL and Orion South, which is consistent with the NH3 (2, 2) emission. However, the strongest NH3 (1, 1) emission is found toward Orion KL and the northern clumps, which is slightly different from what we see in H2CO (303–202). The agreement between the distributions of para-H2CO (303–202) and NH3 (2, 2) is better than that between para-H2CO (303–202) and NH3 (1, 1) (see Fig. B.1). The probable reason is that NH3 (1, 1) may sample a more extended and lower-density gas.
The para-H2CO (303–202) integrated intensity distribution agrees remarkably well with the 450 and 850 μm dust emission (Johnston & Bally 1999) in the OMC-1 region, including the dense molecular structure and dust emission peaks (see Fig. B.1). This confirms previous observational results in massive star-forming clumps at various evolutionary stages (Tang et al. 2017a, 2018).
3.2. Kinetic temperature
As discussed in Sect. 1, the relative intensity ratio of H2CO lines involving different Ka ladders yields estimates of the kinetic temperature of the gas (Mangum & Wootten 1993). The para-H2CO 322–221 and 321–220 transitions have similar upper state energies above the ground state, Eu ≃ 68 K, similar spatial distributions (see Fig. 2), similar line profiles (brightness temperature, linewidth, and velocity in our observations; see Fig. C.1; also see Tang et al. 2017a,b, 2018), and are often detected together in molecular clouds (e.g., Bergman et al. 2011; Wang et al. 2012; Lindberg & Jørgensen 2012; Ao et al. 2013; Immer et al. 2014; Treviño-Morales et al. 2014; Ginsburg et al. 2016, 2017; Tang et al. 2017a,b, 2018; Lu et al. 2017). The CH3OH 422–312 transition at 218.440 GHz is well separated from the para-H2CO (322–221) transition in the OMC-1 region (see Figs. 1 and C.1). Para-H2CO 322–221/303–202 and 321–220/303–202 ratios are good thermometers to determine kinetic temperature and show a similar behavior to kinetic temperature and spatial density at high density n(H2) ≳ 105 cm-3 (Lindberg et al. 2015; Tang et al. 2017a), so in this work we use the averaged ratio 0.5 × [(322–221 + 321–220)/303–202] between para-H2CO 322–221/303–202 and 321–220/303–202 to determine gas kinetic temperatures.
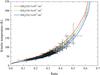 |
Fig. 4 RADEX non-LTE modeling of the relation between the kinetic temperature and the average ratio of para-H2CO 322–221/303–202 and 321–220/303–202 with an assumed density of n(H2) = 105 cm-3, an averaged linewidth of 2.0 km s-1, and column density of N(para-H2CO) = 1 × 10¹³ (red line), 5 × 10¹³ (green line), and 1 × 1014 cm-2 (blue line). The black points are derived from our observed H2CO line ratios for a column density N(para-H2CO) = 5 × 1013 cm-2, the average value for the OMC-1 (see Sect. 3.2). The temperature uncertainties are obtained from observed para-H2CO line ratio errors. |
Using the RADEX3 non-local thermodynamical equilibrium (LTE) model (van der Tak et al. 2007) with collision rates from Wiesenfeld & Faure (2013), we modeled the relation between the gas kinetic temperature and the measured average of para-H2CO 0.5 × [(322–221 + 321–220)/303–202] ratios, adopting an average measured linewidth of ~2.0 km s-1 (temperature weakly dependent on the linewidth; see Nagy et al. 2012; Immer et al. 2016) and column densities N(para-H2CO) = 1 × 10¹³, 5 × 10¹³, and 1 × 1014 cm-2 in Fig. 4. Previous observations toward the Galactic CMZ clouds and dense massive star-forming clumps show that the opacities of para-H2CO (3−2) lines weakly influence the measurements of gas kinetic temperature (Ginsburg et al. 2016; Immer et al. 2016; Tang et al. 2018), so here we assume that the para-H2CO (3–2) lines are optically thin in the OMC-1 region. The spatial densities measured with H2CO and HC3N in the OMC-1 region are n(H2) ~ 105–106 cm-3 (Mangum et al. 1993; Bergin et al. 1996). Previous observations show that para-H2CO (3–2) is sensitive to gas at a density of 105 cm-3 (Ginsburg et al. 2016; Immer et al. 2016; Tang et al. 2017b). Therefore, we adopt 105 cm-3 as an average gas spatial density in the OMC-1 region. The average column density N(para-H2CO) obtained from the para-H2CO (303–202)-averaged brightness temperatures of the entire OMC-1 region at a density of 105 cm-3 using the method of Tang et al. (2017a) is ~5 × 1013 cm-2. The temperatures derived from different column densities at a density of 105 cm-3 would only slightly change (see Fig. 4). Generally, higher line ratios of para-H2CO indicate higher kinetic temperatures. Therefore, the ratio maps can be used as a proxy for relative kinetic temperature. We use the relation between kinetic temperature and para-H2CO line ratios at a spatial density of 105 cm-3 and column density of 5 × 1013 cm-2 (shown in Fig. 5) to convert ratio maps to temperature maps in Fig. 5.
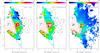 |
Fig. 5 Left: averaged (see Sect. 3.2) velocity-integrated intensity ratio map of para-H2CO 0.5 × [(322–221 + 321–220)/303–202] in the OMC-1. Middle: kinetic temperatures derived from the para-H2CO (3–2) line ratios. Right: kinetic temperatures derived from NH3 (2, 2)/(1, 1) ratios observed with the GBT (beam size ~30′′; Friesen et al. 2017). Black contours show the contour of integrated intensity of para-H2CO 303–202 at 1.9 K km s-1 (see Fig. 2). Red contours show the velocity-integrated intensity (VLSR = –30 to +30 km s-1) of the H41α recombination line observed with IRAM (beam size ~30′′; Goicoechea et al. 2015). Stars show the locations of the Trapezium stars (θ1 Ori A, B, C, D, and E). The unit of the color bars of the middle and right panels is in both cases Kelvin. |
An averaged para-H2CO (3–2) line ratio map is shown in Fig. 5. The line ratios are calculated by velocity-integrated intensities where the para-H2CO 322–221 and/or 321–220 lines are detected with S/N ≳ 3σ. Para-H2CO ratios range from 0.12 to 0.61, with an average of 0.28 ± 0.01 (errors given here and elsewhere are standard deviations of the mean). The lowest ratios (<0.25) occur in the Orion north(west) and the ridge between Orion South and the Orion Bar. In Orion South, in the north(east), and in the dense clumps in the Orion Bar, the ratios range from 0.25 to 0.4. High ratios (>0.4) are also found in the northeastern region, Orion KL, and the Orion Bar. Several locations near the hot core, in the northeastern region, and in the Orion Bar around the H II region show the highest ratios (>0.45).
The gas kinetic temperatures derived from the para-H2CO line ratios are warm, ranging from 30 to >200 K with an average of 62 ± 2 K at density n(H2) = 105 cm-3, which agrees with the results measured with H2CO in other star-forming regions (Mangum & Wootten 1993; Hurt et al. 1996; Mangum et al. 1999; Watanabe & Mitchell 2008; Nagy et al. 2012) and Galactic center clouds (Ao et al. 2013; Ginsburg et al. 2016; Immer et al. 2016; Lu et al. 2017). The kinetic temperatures in the dense gas around the H II region and in the northeastern part of the OMC-1 10 km s-1 filament are high (>50 K; see Fig. 5 and Table 1). Typical kinetic temperatures are ~120–290 K in Orion KL, ~74 K in Orion South, ~73 K in dense clumps of the Orion Bar, ~100–130 K at the edge (north and south) of the Orion Bar, ~40 K in Orion north, and ~70–160 K in the Orion northeastern region.
4. Discussion
4.1. Comparison of temperatures derived from H2CO and other gas tracers
The NH3 (2, 2)/(1, 1) ratio is sensitive to gas temperatures Tkin < 50 K (Mangum et al. 2013a; Gong et al. 2015a), which is similar to the kinetic temperature range that the para-H2CO (3–2) ratio is most sensitive to (Mangum & Wootten 1993). The NH3 lines have lower effective excitation densities than the para-H2CO (3–2) transitions by a few orders of magnitude, neff(NH3(1, 1)) ~ 103 cm-1 while neff(para-H2CO 303–202) ~ 105 cm-1 (Shirley 2015). The Orion A molecular cloud has been measured in NH3 (1, 1) and (2, 2) with the GBT (beam size ~30′′; Friesen et al. 2017; this agrees well with our para-H2CO (3–2) data). We compare maps of gas kinetic temperatures derived from para-H2CO and NH3 (2, 2)/(1, 1) line ratios in Fig. 5. The typical gas kinetic temperature derived from NH3 (2, 2)/(1, 1) is 20–30 K. Typical gas kinetic temperatures are >100 K in Orion KL, ~50 K in Orion South, >50 K in the Orion Bar, 20–30 K in Orion north and >50 K in the Orion northeastern region (see Table 1). Almost everywhere, NH3 (2, 2)/(1, 1) traces lower kinetic temperatures than those derived from para-H2CO (3–2) line ratios. We also compare matched pixels of kinetic temperature maps of the two tracers in Fig. D.1. It seems that temperatures derived from the two tracers are correlated. In many cases, para-H2CO (3–2) traces a higher temperature than NH3 (2, 2)/(1, 1) with a difference of 5–>100 K. Previous observations toward Galactic CMZ clouds, dense massive star-forming clumps in our Galactic disk and external galaxies indicate that in many cases para-H2CO (3–2) line ratios trace a higher kinetic temperature than the NH3 (2, 2)/(1, 1) line ratios (Weiß et al. 2001; Mühle et al. 2007; Ao et al. 2013; Ott et al. 2014; Ginsburg et al. 2016; Tang et al. 2017a,b, 2018). The difference is likely due to the fact that the derived kinetic temperatures from NH3 (2, 2)/(1, 1) reflect an average temperature of more extended and cooler gas (Henkel et al. 1987; Ginsburg et al. 2016) and para-H2CO (3–2) ratios trace denser and hotter regions (Ginsburg et al. 2016; Tang et al. 2017a, 2018).
Comparison of temperatures derived from different tracers.
A comparison of temperatures obtained from NH3 (4, 4)/ (2, 2) and para-H2CO (321–220/303–202) line ratios in a Galactic CMZ cloud indicates that in many cases the tracers reveal consistent results (Lu et al. 2017). Kinetic temperatures in the Orion Bar have been measured with the NH3 (4, 4)/(2, 2) ratio (Batrla & Wilson 2003), which shows similar temperatures as derived from the para-H2CO (3–2) ratio. More highly excited NH3 transitions commonly lead to higher kinetic temperatures (e.g., Henkel et al. 1987; Mangum et al. 2013a; Gong et al. 2015a,b). Therefore, if higher NH3 levels than NH3 (2, 2)/(1, 1) are involved in measuring the kinetic temperatures, the values derived from NH3 might become at least as high as those from para-H2CO (3–2) in the OMC-1 region.
Several locations in the Orion KL region have been observed in CH3CCH (J = 5–4 and 6–5; Churchwell & Hollis 1983), which is also a thermometer tracing dense molecular gas. It reveals a gas temperature of ~35 K. A region similar to that of our observations has been observed in CH3CCH (6–5, beam size ~ 50′′; Bergin et al. 1994), suggesting a gas temperature range of 10–60 K with an average of ~30 ± 1 K, which is similar to results obtained from NH3 (2, 2)/(1, 1) line ratios but is lower than that derived from our para-H2CO line ratios. This difference is also found in dense massive star-forming clumps (Tang et al. 2018; Giannetti et al. 2017). These indicate that, like the NH3 (2, 2)/(1, 1) ratio, CH3CCH (6–5) might trace cooler and more extended gas (Churchwell & Hollis 1983).
CO (1–0) with a beam size of ~45′′ has been observed toward the OMC-1 region (Bergin et al. 1994), which reveals a warm gas temperature (equivalent to the excitation temperature since 12CO is likely optically thick) ranging from 43 to 92 K with an average of ~69 ± 2 K. This is similar to results derived from para-H2CO (3–2) line ratios. Low-resolution (beam size ~ 3′) observations of the OMC with CO (2–1) show a gas kinetic temperature of ~88 K at a density of ~103 cm-3 in the Orion KL region (Nishimura et al. 2015), which agrees with our averaged gas temperature (~82 K) derived from the para-H2CO (3–2) line ratio at a density of 105 cm-3 within a similar region. Observations of the high excitation CO (6–5) transition (beam size ~ 8.6′′) toward the OMC-1 region indicate extensive high gas temperatures (excitation temperature >150 K) all over Orion KL, Orion South, and the Orion Bar regions (Peng et al. 2012), whereas in H2CO (and also NH3) we only see such high Tkin values in the Orion KL region. This suggests that para-H2CO (3–2) may trace a cooler component than the high-excitation transition of CO (6–5).
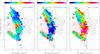 |
Fig. 6 Maps of sound speed (left; color bar in units of km s-1), thermal to non-thermal gas pressure (middle), and Mach number (right) in the OMC-1. Contours and stars are the same as in Fig. 5. For details, see Sect. 4.3. |
4.2. Comparison of temperatures derived from the gas and the dust
The dust temperature in the Orion A molecular cloud has been well studied from far-infrared (FIR) to mid-infrared (MIR) wavelengths (e.g., Downes et al. 1981; Mookerjea et al. 2000; Vaillancourt 2002; Megeath et al. 2012; Lombardi et al. 2014; Goicoechea et al. 2015; Salgado et al. 2016). The dust temperatures derived from FIR measurements rarely exceed 50 K in star formation regions of our Galaxy and external galaxies (e.g., Henkel et al. 1986; Mangum et al. 2013a; Guzmán et al. 2015; Merello et al. 2015; He et al. 2016; König et al. 2017; Lin et al. 2016; Yu & Xu 2016; Tang et al. 2017a). Likely, the dust emission at FIR wavelengths originates primarily from cold dust components that may not be directly associated with star formation activity (Schnee et al. 2009; Bendo et al. 2012; Mangum et al. 2013a). The cold dust temperatures derived from the FIR measurements have a range of ~14–60 K with a roughly constant value, ~30 K, in the extended parts of OMC-1 (Mookerjea et al. 2000; Vaillancourt 2002; Lombardi et al. 2014; Goicoechea et al. 2015; Salgado et al. 2016), which agrees remarkably well with results obtained from NH3 (2, 2)/(1, 1) and CH3CCH (6–5), but is lower than that derived from para-H2CO (3–2) line ratios. This indicates that the gas temperatures derived from NH3 (2, 2)/(1, 1) and CH3CCH (6–5) tend to be related to the cold dust component responsible for FIR emission. The dust emission at mid infrared wavelengths traces primarily warm dust components that may be excited by young stars and clusters (Helou 1986). The warm dust temperatures derived from the MIR measurements range from ~45 to ≳150 K in the OMC-1 region (Downes et al. 1981; Salgado et al. 2016), which is consistent with results obtained from our para-H2CO line ratios. This further confirms that the para-H2CO (3–2) ratios trace denser and warmer gas.
At the densest regions (n(H2) ≳ 104 cm-3) interactions between dust and gas become sufficiently frequent, so it is commonly expected that gas and dust are thermally coupled (Goldsmith 2001). Previous observations show that the temperatures derived from gas and dust are often in agreement in the active dense clumps of Galactic disk clouds (Dunham et al. 2010; Giannetti et al. 2013; Battersby et al. 2014). Based on measurements of dust at MIR and FIR wavelengths and gas detected in the para-H2CO (3–2), NH3 (2, 2)/(1, 1), and CH3CCH (6–5) transitions, dust and gas temperatures appear to be generally equivalent in the dense gas (n(H2) ≳ 104 cm-3) of the OMC-1 region, but yield different values depending on how closely they are related to massive star formation.
4.3. Thermal and non-thermal motions
Using the kinetic temperatures derived from the para-H2CO line ratios, the thermal and non-thermal linewidth (σT =  and σNT =
  t Δv/ 2.355, where k is the Boltzmann constant, Tkin is the kinetic temperature of the gas, mH2CO is the mass of the formaldehyde molecule, and Δv is the measured FWHM linewidth of para-H2CO 303–202 from a Gaussian fit; Pan & Padoan 2009; Dewangan et al. 2016) ranges are 0.09−0.27 km s-1 with an average of 0.12 ± 0.01 km s-1 and 0.34–2.78 km s-1 with an average of 0.98 ± 0.02 km s-1, respectively. The thermal linewidth is significantly smaller than the non-thermal linewidth, which indicates that the dense gas traced by para-H2CO is dominated by non-thermal motions in the OMC-1 region.
Distributions of the sound speed (as =  , where μ = 2.37 is the mean molecular weight for molecular clouds and mH is the mass of the hydrogen atom; Dewangan et al. 2016), the thermal to non-thermal pressure ratio (Rp =
  ; Lada et al. 2003), and the Mach number (given as M = σNT/as) in the OMC-1 are shown in Fig. 6. The sound speed ranges from 0.30 to 0.97 km s-1 with an average of 0.44 ± 0.01 km s-1. The thermal to non-thermal pressure ratio ranges from 0.05 to 2.12 with an average of 0.27 ± 0.01. The Mach number ranges from 0.7 to 4.3 with an average of 2.3 ± 0.1. All this suggests that non-thermal pressure and supersonic non-thermal motions (e.g., turbulence, outflows, shocks, and/or magnetic fields) are dominant in the dense gas traced by para-H2CO in the OMC-1 region. A few locations have high thermal to non-thermal pressure ratios (Rp ≳ 1) corresponding to lower Mach numbers (M ≲ 1), which are located in the eastern edge of the northern part of the OMC-1, in the 10 km s-1 filament (see Fig. 6).
The thermal to non-thermal pressure ratio and Mach number show apparent gradients along the northern part of the OMC-1 10 km s-1 filament and the Orion Bar regions (see Fig. 6). This indicates that dense gas probed by para-H2CO may be affected by the H II region (see Figs. 5 and 6). Positions with higher thermal to non-thermal pressure ratio (Rp > 0.15) and lower Mach number (M < 2.5) located in the south of the OMC-1 10 km s-1 filament and the Orion Bar region have a higher temperature range (>60 K, see Fig. 5) and a lower linewidth range (<2 km s-1, see Fig. 3). This gas may be heated by FUV photons originating from the H II region. Low thermal to non-thermal pressure ratios (Rp < 0.15) and higher Mach numbers (M > 2.5) are associated with the outflows of the massive star forming regions Orion South and Orion KL, and the northwestern part of the OMC-1 10 km s-1 filament. This indicates that dense gas traced by para-H2CO is strongly influenced by non-thermal motions (e.g., outflows and shocks) in these regions.
4.4. Turbulent heating
Correlations between the kinetic temperature and linewidth are expected in the case of conversion of turbulent energy into heat (Güsten et al. 1985; Molinari et al. 1996; Ao et al. 2013; Ginsburg et al. 2016; Immer et al. 2016). Present observations toward Galactic CMZ clouds with para-H2CO (3–2) show that the warm dense gas is heated most likely by turbulence on a scale of ~1 pc (Ao et al. 2013; Ginsburg et al. 2016; Immer et al. 2016). However, high-resolution observations with para-H2CO (321–220/303–202) and NH3 (4, 4)/(2, 2) show no apparent correlation between temperatures and linewidths in a Galactic CMZ cloud at a smaller scale of ~0.1 pc (Lu et al. 2017). Previous observations of, for example, NH3, H2CO, and CH3CCH in star formation regions suggest that the linewidth is correlated with kinetic temperature (Wouterloot et al. 1988; Molinari et al. 1996; Jijina et al. 1999; Wu et al. 2006; Urquhart et al. 2011, 2015; Wienen et al. 2012; Lu et al. 2014; Tang et al. 2017a, 2018; Giannetti et al. 2017).
We examine whether there is a relationship between turbulence and temperature on a ~0.06 pc scale in the OMC-1 region. We adopt the non-thermal velocity dispersion (σNT) of para-H2CO in good approximation as a proxy for the turbulence, and the kinetic temperature derived from the para-H2CO line ratio as the gas kinetic temperature. As mentioned in Sect. 4.3, the dense gas in locations with lower Mach number (M < 2.5) may be influenced by external sources, so here we select positions with strong non-thermal motions (M ≳ 2.5 corresponding to a thermal to non-thermal pressure ratio Rp ≲ 0.15), which are located near massive star formation regions (Orion KL outflows and Orion South) and the northern region of the 10 km s-1 filament of the OMC-1 ridge (see Fig. 6). The relation between kinetic temperature and non-thermal velocity dispersion is shown in Fig. 7 (blue points; blue fitted lines). For the non-thermal velocity dispersion of para-H2CO and kinetic temperature, linear least squares fit results are listed in Table 2. These show that the non-thermal velocity dispersion of para-H2CO is significantly positively correlated with the gas kinetic temperatures, especially in the two massive star formation regions Orion KL and Orion South, by a power-law of the form Tkin ∝  , which is consistent with results in massive star-forming clumps (Tkin ∝
  , gas kinetic temperature measured with para-H2CO 3–2 and 4–3 line ratios, Tang et al. 2018). This implies that the higher temperature traced by para-H2CO in the strong non-thermal motion regions of the OMC-1 is related to the turbulence at a scale of ~0.06 pc, which clearly disagrees with at least one cloud from the Galactic center region on a ~0.1 pc scale (see Lu et al. 2017).
We determine the gas kinetic temperature heated by turbulent energy following the method applied by Ao et al. (2013) in their Eq. (20),![Mathematical equation: \begin{eqnarray} T_{\rm turb} \!\!\!\!&=&\!\!\!\! \Bigg(\frac{(16\times10^{-8}~a^3+7920~a^{0.5}~b~c^3~d^{-1})^{1/2}}{12~b} \nonumber \\[-2mm] &&\!\!\!\! -\,\frac{4\times10^{-4}~a^{1.5}}{12~b}\Bigg)^{2/3}\,\rm K, \end{eqnarray}](/articles/aa/full_html/2018/01/aa31849-17/aa31849-17-eq80.png) (1)where the gas density \begin{lxirformule}$a$\end{lxirformule} is in units of cm-3, the velocity gradient b is in units of km s-1 pc-1, the one-dimensional non-thermal velocity dispersion c is in units of km s-1, and the cloud size d is in units of pc. This leads to a minimum Tturb value, because the dust temperature has been set to Tdust = 0 K to simplify the equation (Ao et al. 2013). We computed the gas kinetic temperature assuming turbulent heating dominates the heating process. We adopt a velocity gradient of b = 1 km s-1 pc-1 (Bally et al. 1987; Wiseman & Ho 1998; Hacar et al. 2017) and a gas spatial density of 105 cm-3 (temperature weakly dependent on the velocity gradient and the gas spatial density; see Ao et al. 2013). We select three locations with the largest linewidths of 2.7, 4.4, and 6.6 km s-1 at Orion north (1.68′, 4.78′) (offsets relative to our reference position; see Sect. 2), Orion South (0.72′, −0.72′), and Orion KL (0.72′, 0.48′), corresponding to gas kinetic temperatures derived from the para-H2CO line ratio of 43, 62, and 133 K, respectively. The derived gas kinetic temperature Tturb are 24, 58, and 111 K at a cloud scale of 0.1 pc, 9, 22, and 46 K at a cloud scale of 0.5 pc, and 5, 14, and 31 K at a cloud scale of 1 pc in Orion north, Orion South, and Orion KL, respectively. If the gas temperature derived from para-H2CO is adopted as the dust temperature (see Sect. 4.2) following Eqs. (7), (8), (18), and (19) in Ao et al. (2013), Eq. (1) has the form
(1)where the gas density \begin{lxirformule}$a$\end{lxirformule} is in units of cm-3, the velocity gradient b is in units of km s-1 pc-1, the one-dimensional non-thermal velocity dispersion c is in units of km s-1, and the cloud size d is in units of pc. This leads to a minimum Tturb value, because the dust temperature has been set to Tdust = 0 K to simplify the equation (Ao et al. 2013). We computed the gas kinetic temperature assuming turbulent heating dominates the heating process. We adopt a velocity gradient of b = 1 km s-1 pc-1 (Bally et al. 1987; Wiseman & Ho 1998; Hacar et al. 2017) and a gas spatial density of 105 cm-3 (temperature weakly dependent on the velocity gradient and the gas spatial density; see Ao et al. 2013). We select three locations with the largest linewidths of 2.7, 4.4, and 6.6 km s-1 at Orion north (1.68′, 4.78′) (offsets relative to our reference position; see Sect. 2), Orion South (0.72′, −0.72′), and Orion KL (0.72′, 0.48′), corresponding to gas kinetic temperatures derived from the para-H2CO line ratio of 43, 62, and 133 K, respectively. The derived gas kinetic temperature Tturb are 24, 58, and 111 K at a cloud scale of 0.1 pc, 9, 22, and 46 K at a cloud scale of 0.5 pc, and 5, 14, and 31 K at a cloud scale of 1 pc in Orion north, Orion South, and Orion KL, respectively. If the gas temperature derived from para-H2CO is adopted as the dust temperature (see Sect. 4.2) following Eqs. (7), (8), (18), and (19) in Ao et al. (2013), Eq. (1) has the form 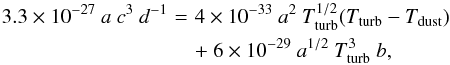 (2)and the determined gas kinetic temperatures Tturb become 52, 87, and 150 K at a cloud scale of 0.1 pc, 42, 62, and 109 K at a cloud scale of 0.5 pc, and 40, 57, and 102 K at a cloud scale of 1 pc in Orion north, Orion South, and Orion KL, respectively. For the latter two cloud sizes, the obtained Tturb values agree reasonably well with the Tkin values derived from our para-H2CO line ratios. This suggests that turbulent heating significantly contributes to the gas kinetic temperature on a small scale. However, these locations are also influenced by, for example, outflows, shocks, and/or radiation from massive star formation regions in Orion KL and Orion South (Wiseman & Ho 1998). Nevertheless, turbulent heating may play an important role in heating the dense gas associated with massive star formation regions on small scales in the OMC-1.
Kinetic temperature vs. H2CO non-thermal velocity dispersion.
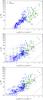 |
Fig. 7 Non-thermal velocity dispersion (σNT) vs. gas kinetic temperature derived from the para-H2CO line ratio (Sect. 3.2) for locations with the Mach number M ≳ 2.5 in the OMC-1 (blue points) and ATLASGAL massive star-forming clumps (green points; Tang et al. 2018). The blue line is the result from a linear fit for the OMC-1 data. The red line is the linearly fitted result for OMC-1 (M ≳ 2.5) and ATLASGAL data. Black solid and dashed lines indicate relations between non-thermal velocity dispersion and gas kinetic temperature derived from para-H2CO and NH3 at density 105 cm-3 in the Galactic CMZ clouds, respectively (Güsten et al. 1985; Immer et al. 2016). |
To check whether there is a relationship between the turbulence and temperature on scales of 0.06 to 2 pc, we combine our data (M ≳ 2.5) with previous observational results of para-H2CO (3–2) in massive star-forming clumps with a Mach number range of 2.7–6.7 at scale ~0.1–1.8 pc (Tang et al. 2018) and fit the relation between the non-thermal velocity dispersion of para-H2CO and kinetic temperature in Fig. 7 (red lines). The least squares linear fit results are listed in Table 2. It shows that the non-thermal velocity dispersion of para-H2CO is significantly positively correlated with the gas kinetic temperature by a power-law of the form Tkin ∝  at scale from 0.06 to 1.8 pc, which is consistent with our results in the OMC-1 region (M ≳ 2.5) and agrees well with results found with para-H2CO and NH3 in molecular clouds of the Galactic center (Tkin ∝ Δv0.8−1.0; Güsten et al. 1985; Mauersberger et al. 1986; Immer et al. 2016). This indicates that turbulent heating seems to be widespread in massive star formation regions on scales of ~0.06–2 pc. One should note that this agreement is only in terms of slope, not of intercept and absolute value (see Fig. 7). The fact that the intercept values are different suggests that there are differences in how the gas in the Galactic CMZ clouds and star formation regions of Orion and ATLASGAL sample are heated.
4.5. Radiation heating
Previous observations of, for example, NH3, H2CO, CH3CN, CH3CCH, or CH3OH in massive star-forming regions (Lu et al. 2014; Giannetti et al. 2017; Tang et al. 2018) suggest internal radiative heating of embedded infrared sources upon their surrounding dense gas. High-resolution observations with NH3 (1, 1) and (2, 2) toward the OMC-1 show that the dense gas along the northern part of the OMC-1 10 km s-1 filament is likely heated by radiation from the entire central Orion nebula, including KL and the Trapezium stars (Wiseman & Ho 1996, 1998).
Following exactly the filament, we investigate the relationship between gas kinetic temperature and distance R from the central part of the Orion nebula (IRc2, α = 05:35:14.48, δ = −05:22:30.56, J2000) along the northern part of the OMC-1 10 km s-1 filament with para-H2CO and NH3 in Fig. 8. The gas kinetic temperatures are derived from para-H2CO and NH3 (2, 2)/(1, 1) (Friesen et al. 2017) line ratios. The beam sizes of para-H2CO and NH3 are both ~30′′, so we only fit the data for para-H2CO and NH3, respectively, with distance R > 30′′. For the gas kinetic temperatures of para-H2CO and NH3, and distance from IRc2, the fit results are 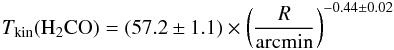 (3)and
  (4)with power-law indices of –0.44 and –0.54, respectively. This relation is based on the projected radius along the line of sight.
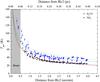 |
Fig. 8 Gas kinetic temperature derived from para-H2CO (3–2) (blue points) and NH3 (2, 2)/(1, 1) (black points) ratios along the northern 10 km s-1 filament of the OMC-1 ridge (distance from IRc2, α = 05:35:14.48, δ = –05:22:30.56, J2000). The blue and black lines are the fitted results for para-H2CO and NH3, respectively, with distance R > 0.5′. The red and green lines are the expected relationships from a Stefan-Boltzmann law and modified Stefan-Boltzmann law (see Sect. 4.5), respectively, assuming Orion KL is the dominant source with an approximate luminosity of 105 L⊙ (Downes et al. 1981; Wiseman & Ho 1998). |
It is expected that the gas temperature and distance relation from the Stefan-Boltzmann blackbody radiation law is Tkin = 0.86 ×  = 44.8 ×
  , adopting a molecular cloud distance of 400 pc and assuming that IRc2 is the dominant source with an approximate luminosity of 105 L⊙ (Downes et al. 1981; Wiseman & Ho 1998), located in the KL nebula. Adjusting the emissivity of dust grains to be smaller than the wavelength at the characteristic black-body temperature, the radiation law has the form Tkin t 63.9 ×
  (Wiseman & Ho 1998). Our fitted power-law indices of para-H2CO and NH3 are remarkably consistent with the radiation law, which directly confirms that the dense gas along the northern part of the OMC-1 10 km s-1 filament is heated by radiation from the central Orion nebula. The two radiation models for gas heating (Stefan-Boltzmann blackbody radiation and its modification related to dust emissivity) are both well supported by our para-H2CO and NH3 data, so here we cannot distinguish which is better. For the region with R ≲ 1′, several locations show gas temperatures probed with para-H2CO above the fitted results (see Figs. 5 and 8). Indeed, the energy set free by an explosion resulting from a stellar merger ~500 yr ago is a plausible mechanism causing the high temperatures of the dense gas in the Orion KL region (Bally & Zinnecker 2005; Bally et al. 2017).
The gas heating appears to be complex and is most likely due to a number of different processes in the OMC-1 region. Dense gas around the H II region at radius ~2.5′, especially the Orion Bar region, appears to be influenced by FUV photons from the Trapezium stars. Star formation activity (e.g., outflows, shocks, winds, radiation) in Orion KL and Orion South also heat the local regions at radius ≳2′ (Wiseman & Ho 1998; Bally et al. 2017). Turbulent heating seems to be widespread in the dense gas associated with the massive star formation region in OMC-1. While dense gas along the northern part of the OMC-1 10 km s-1 filament is heated by radiation from the central Orion nebula.
5. Summary
We have mapped the kinetic temperature distribution of OMC-1 with the APEX 12 m telescope, and compared the kinetic temperatures derived from the para-H2CO 218 GHz line triplet, with NH3 (2, 2)/(1, 1) inversion lines (Friesen et al. 2017) and dust emission. The main results are the following:
-
1.
The distribution of para-H2CO 303–202 emission is extended in the OMC-1 region and resembles those of the NH3 (1, 1) and (2, 2) lines on a ~0.06 pc scale.
-
2.
The distribution of para-H2CO 303–202 agrees with the 450 and 850 μm dust emission in the OMC-1 region, suggesting that the H2CO associates well with dense gas traced by the 450 and 850 μm continuum.
-
3.
Using the RADEX non-LTE radiative transfer model, we derive the gas kinetic temperature modeling the measured para-H2CO 0.5 × [(322–221 + 321–220)/303–202] line ratios. The gas kinetic temperatures derived from para-H2CO line ratios are warm, ranging from 30 to >200 K with an average of 62 ± 2 K at a spatial density of 105 cm-3. These temperatures are higher than those obtained from NH3 (2, 2)/(1, 1) and CH3CCH (6–5) in the OMC-1 region. In many cases para-H2CO (3–2) traces a higher temperature than NH3 (2, 2)/(1, 1) with a difference of 5–>100 K.
-
4.
The gas kinetic temperatures derived from the para-H2CO (3–2) line ratios agree with the warm dust components measured at mid-infrared wavelength, indicating that the para-H2CO (3–2) ratios trace denser and warmer gas than NH3 (2, 2)/(1, 1) and CH3CCH (6–5). The cold dust components measured in the far infrared are consistent with those deduced from NH3 (2, 2)/(1, 1) and CH3CCH (6−5). Based on observations of dust emission at MIR and FIR wavelengths and molecular gas with para-H2CO (3–2), NH3 (2, 2)/(1, 1), and CH3CCH (6–5), dust and gas temperatures appear to be generally equivalent in the dense gas (n(H2) ≳ 104 cm-3) of the OMC-1 region, but with the MIR continuum and para-H2CO likely sampling gas more closely associated with massive star formation.
-
5.
The non-thermal velocity dispersions of para-H2CO are positively correlated with the gas kinetic temperatures at density 105 cm-3 in regions of strong non-thermal motion (Mach number ≳2.5) in OMC-1, which implies that the higher temperature traced by para-H2CO is related to turbulence on a scale of ~0.06 pc. Turbulent heating seems to be widespread in massive star formation regions on a ~0.1–2 pc scale.
-
6.
Combining the temperature measurements with para-H2CO (3–2) and NH3 (2, 2)/(1, 1) line ratios, we find direct evidence for the dense gas along the northern part of the OMC-1 10 km s-1 filament being heated by radiation from the central Orion nebula.
This publication is based on data acquired with the Atacama Pathfinder EXperiment (APEX). APEX is a collaboration between the Max-Planck-Institut für Radioastronomie, the European Southern Observatory, and the Onsala Space Observatory.
Acknowledgments
The authors are grateful for the valuable comments of the referee. We thank the staff of the APEX telescope for their assistance in observations. We also thank Arnaud Belloche and Cosmos Yeh for their help of observations and data reduction. The authors are thankful for the helpful comments of Jens Kauffmann. This work acknowledges support by The Program of the Light in China’s Western Region (LCRW) under grant XBBS201424 and The National Natural Science Foundation of China under grant 11433008 and 11373062. This work was partially carried out within the Collaborative Research Council 956, subproject A6, funded by the Deutsche Forschungsgemeinschaft (DFG). C.H. acknowledges support by a Chinese Academy of Sciences President’s International Fellowship Initiative for visiting scientists (2017VMA0005). Y.G. acknowledges support by The National Natural Science Foundation of China under grant 11127903 and The National Key Research and Development program under grant 2017YFA0402702. This research has used NASA’s Astrophysical Data System (ADS).
References
- Ao, Y., Henkel, C., Menten, K. M., et al. 2013, A&A, 550, A135 [NASA ADS] [CrossRef] [EDP Sciences] [Google Scholar]
- Baan, W. A., Güsten, R., & Haschick, A. D. 1986, ApJ, 305, 830 [NASA ADS] [CrossRef] [Google Scholar]
- Baan, W. A., Henkel, C., Schilke, P., et al. 1990, ApJ, 353, 132 [NASA ADS] [CrossRef] [Google Scholar]
- Baan, W. A., Haschick, A. D., & Uglesich, R. 1993, ApJ, 415, 140 [NASA ADS] [CrossRef] [Google Scholar]
- Bally, J., & Zinnecker, H. 2005, AJ, 129, 2281 [NASA ADS] [CrossRef] [Google Scholar]
- Bally, J., Langer, W. D., Stark, A. A., & Wilson, R. W. 1987, ApJ, 312, L45 [NASA ADS] [CrossRef] [Google Scholar]
- Bally, J., Ginsburg, A., Arce, H., et al. 2017, ApJ, 837, 60 [NASA ADS] [CrossRef] [Google Scholar]
- Bastien, P., Batrla, W., Henkel, C., et al. 1985, A&A, 146, 86 [NASA ADS] [Google Scholar]
- Batrla, W., & Wilson, T. L. 2003, A&A, 408, 231 [NASA ADS] [CrossRef] [EDP Sciences] [Google Scholar]
- Batrla, W., Wilson, T. L., Ruf, K., & Bastien, P. 1983, A&A, 128, 279 [Google Scholar]
- Battersby, C., Bally, J., Dunham, M., et al. 2014, ApJ, 786, 116 [NASA ADS] [CrossRef] [Google Scholar]
- Bendo, G. J., Boselli, A., Dariush, A., et al. 2012, MNRAS, 419, 1833 [NASA ADS] [CrossRef] [Google Scholar]
- Benson, P. J., & Myers, P. C. 1983, ApJ, 270, 589 [NASA ADS] [CrossRef] [Google Scholar]
- Bergin, E. A., Goldsmith, P. F., Snell, R. L., et al. 1994, ApJ, 431, 674 [NASA ADS] [CrossRef] [Google Scholar]
- Bergin, E. A., Snell, R. L., & Goldsmith, P. F. 1996, ApJ, 460, 343 [NASA ADS] [CrossRef] [Google Scholar]
- Bergman, P., Parise, B., Liseau, R., & Larsson, B. 2011, A&A, 527, A39 [NASA ADS] [CrossRef] [EDP Sciences] [Google Scholar]
- Berné, O., Marcelino, N., & Cernicharo, J. 2014, ApJ, 795, 13 [NASA ADS] [CrossRef] [Google Scholar]
- Bieging, J. H., Wilson, T. L., & Downes, D. 1982, A&AS, 49, 607 [NASA ADS] [Google Scholar]
- Buckle, J. V., Davis, C. J., Francesco, J. D., et al. 2012, MNRAS, 422, 521 [NASA ADS] [CrossRef] [Google Scholar]
- Caselli, P., Hasegawa, T. I., & Herbst, E. 1993, ApJ, 408, 548 [NASA ADS] [CrossRef] [Google Scholar]
- Chira, R. A., Beuther, H., Linz, H., et al. 2013, A&A, 552, A40 [NASA ADS] [CrossRef] [EDP Sciences] [Google Scholar]
- Churchwell, E., & Hollis, J. M. 1983, ApJ, 272, 591 [NASA ADS] [CrossRef] [Google Scholar]
- Cohen, R. J., & Few, R. W. 1981, MNRAS, 194, 711 [NASA ADS] [CrossRef] [Google Scholar]
- Cohen, R. J., Matthews, N., Few, R. W., et al. 1983, MNRAS, 203, 1123 [NASA ADS] [CrossRef] [Google Scholar]
- Danby, G., Flower, D. R., Valiron, P., et al. 1988, MNRAS, 235, 229 [NASA ADS] [CrossRef] [Google Scholar]
- Dewangan, L. K., Ojha, D. K., Luna, A., et al. 2016, ApJ, 819, 66 [NASA ADS] [CrossRef] [Google Scholar]
- Downes, D., Wilson, T. L., Bieging, J., & Wink, J. 1980, A&AS, 40, 379 [NASA ADS] [Google Scholar]
- Downes, D., Genzel, R., Becklin, E. E., et al. 1981, ApJ, 244, 869 [NASA ADS] [CrossRef] [Google Scholar]
- Dunham, M. K., Rosolowsky, E., Evans, II, N. J., et al. 2010, ApJ, 717, 1157 [NASA ADS] [CrossRef] [Google Scholar]
- Friesen, R., Pineda, J. E., Rosolowsky, E., et al. 2017, ApJ, 843, 63 [NASA ADS] [CrossRef] [Google Scholar]
- Gerner, T., Beuther, H., Semenov, D., et al. 2014, A&A, 563, A97 [NASA ADS] [CrossRef] [EDP Sciences] [Google Scholar]
- Giannetti, A., Brand, J., Sánchez-Monge, Á., et al. 2013, A&A, 556, A16 [NASA ADS] [CrossRef] [EDP Sciences] [Google Scholar]
- Giannetti, A., Leurini, S., Wyrowski, F., et al. 2017, A&A, 603, A33 [NASA ADS] [CrossRef] [EDP Sciences] [Google Scholar]
- Ginsburg, A., Darling, J., Battersby, C., et al. 2011, ApJ, 736, 149 [NASA ADS] [CrossRef] [Google Scholar]
- Ginsburg, A., Bally, J., Battersby, C., et al. 2015, A&A, 573, A106 [NASA ADS] [CrossRef] [EDP Sciences] [Google Scholar]
- Ginsburg, A., Henkel, C., Ao, Y., et al. 2016, A&A, 586, A50 [NASA ADS] [CrossRef] [EDP Sciences] [Google Scholar]
- Ginsburg, A., Goddi, C., Kruijssen, J. D., et al. 2017, ApJ, 842, 92 [Google Scholar]
- Goicoechea, J. R., Teyssier, D., Etxaluze, M., et al. 2015, ApJ, 812, 75 [NASA ADS] [CrossRef] [Google Scholar]
- Goldsmith, P. F. 2001, ApJ, 557, 736 [NASA ADS] [CrossRef] [MathSciNet] [Google Scholar]
- Goldsmith, P. F., Bergin, E. A., & Lis, D. C. 1997, ApJ, 491, 615 [NASA ADS] [CrossRef] [Google Scholar]
- Gong, Y., Henkel, C., Spezzano, S., et al. 2015a, A&A, 574, A56 [NASA ADS] [CrossRef] [EDP Sciences] [Google Scholar]
- Gong, Y., Henkel, C., Thorwirth, S., et al. 2015b, A&A, 581, A48 [NASA ADS] [CrossRef] [EDP Sciences] [Google Scholar]
- Guo, W. H., Esimbek, J., Tang, X. D., et al. 2016, Ap&SS, 361, 264 [NASA ADS] [CrossRef] [Google Scholar]
- Güsten, R., Walmsley, C. M., Ungerechts, H., et al. 1985, A&A, 142, 381 [Google Scholar]
- Guzmán, A. E., Sanhueza, P., Contreras, Y., et al. 2015, ApJ, 815, 130 [NASA ADS] [CrossRef] [Google Scholar]
- Hacar, A., Alves, J., Tafalla, M., & Goicoechea, J. R. 2017, A&A, 602, L2 [NASA ADS] [CrossRef] [EDP Sciences] [Google Scholar]
- He, Y. X., Zhou, J. J., Esimbek, J., et al. 2016, MNRAS, 461, 2288 [NASA ADS] [CrossRef] [Google Scholar]
- Helou, G. 1986, ApJ, 311, L33 [NASA ADS] [CrossRef] [Google Scholar]
- Henkel, C., Walmsley, C. M., & Wilson, T. L. 1980, A&A, 82, 41 [NASA ADS] [Google Scholar]
- Henkel, C., Wilson, T. L., Walmsley, C. M., & Pauls, T. 1983, A&A, 127, 388 [NASA ADS] [Google Scholar]
- Henkel, C., Wouterloot, J. G. A., & Bally, J. 1986, A&A, 155, 193 [NASA ADS] [Google Scholar]
- Henkel, C., Wilson, T. L., & Mauersberger, R. 1987, A&A, 182, 137 [NASA ADS] [Google Scholar]
- Henkel, C., Baan, W. A., & Mauersberger, R. 1991, A&ARv, 3, 47 [NASA ADS] [CrossRef] [MathSciNet] [Google Scholar]
- Ho, P. T. P., & Townes, C. H. 1983, ARA&A, 21, 239 [NASA ADS] [CrossRef] [Google Scholar]
- Hurt, R., Barsony, M., & Wootten, A. 1996, ApJ, 456, 686 [NASA ADS] [CrossRef] [Google Scholar]
- Immer, K., Galván-Madrid, R., König, C., et al. 2014, A&A, 572, A63 [NASA ADS] [CrossRef] [EDP Sciences] [Google Scholar]
- Immer, K., Kauffmann, J., Pillai, T., et al. 2016, A&A, 595, A94 [NASA ADS] [CrossRef] [EDP Sciences] [Google Scholar]
- Jijina, J., Myers, P. C., & Adams, F. C. 1999, ApJS, 125, 161 [NASA ADS] [CrossRef] [Google Scholar]
- Johnston, K. G., Beuther, H., Linz, H., et al. 2014, A&A, 568, A56 [NASA ADS] [CrossRef] [EDP Sciences] [Google Scholar]
- Johnstone, D., & Bally, J. 1999, ApJ, 510, L49 [NASA ADS] [CrossRef] [Google Scholar]
- Johnstone, D., Boonman, A. M. S., & van Dishoeck, E. F. 2003, A&A, 412, 157 [NASA ADS] [CrossRef] [EDP Sciences] [Google Scholar]
- Kainulainen, J., Stutz, A. M., Stanke, T., et al. 2017, A&A, 600, A141 [NASA ADS] [CrossRef] [EDP Sciences] [Google Scholar]
- Kauffmann, J., Goldsmith, P. F., Melnick, G., et al. 2017, A&A, 605, L5 [NASA ADS] [CrossRef] [EDP Sciences] [Google Scholar]
- König, C., Urquhart, J. S., Csengeri, T., et al. 2017, A&A, 599, A139 [NASA ADS] [CrossRef] [EDP Sciences] [Google Scholar]
- Kounkel, M., Hartmann, L., Loinard, L., et al. 2017, ApJ, 834, 142 [NASA ADS] [CrossRef] [Google Scholar]
- Kutner, M. L., Evans, N. J., II, & Tucker, K. D. 1976, ApJ, 209, 452 [NASA ADS] [CrossRef] [Google Scholar]
- Lada, C. J., Bergin, E. A., Alves, J. F., & Huard, T. L. 2003, ApJ, 586, 286 [NASA ADS] [CrossRef] [Google Scholar]
- Leurini, S., Parise, B., Schilke, P., Pety, J., & Rolffs, R. 2010, A&A, 511, A82 [Google Scholar]
- Lin, Y. X, Liu, H. B., Li, D., et al. 2016, ApJ, 828, 32 [NASA ADS] [CrossRef] [Google Scholar]
- Lindberg, J. E., & Jørgensen, J. K. 2012, A&A, 548, A24 [NASA ADS] [CrossRef] [EDP Sciences] [Google Scholar]
- Lindberg, J. E., Jørgensen, J. K., Watanabe, Y., et al. 2015, A&A, 584, A28 [NASA ADS] [CrossRef] [EDP Sciences] [Google Scholar]
- Lis, D. C., Serabyn, E., Keene, J., et al. 1998, ApJ, 509, 299 [Google Scholar]
- Lombardi, M., Bouy, H., Alves, J., & Lada, C. J. 2014, A&A, 566, A45 [NASA ADS] [CrossRef] [EDP Sciences] [Google Scholar]
- Lu, X., Zhang, Q., Liu, H. B., Wang, J., & Gu, Q. 2014, ApJ, 790, 84 [NASA ADS] [CrossRef] [Google Scholar]
- Lu, X., Zhang, Q., Kauffmann, J., et al. 2017, ApJ, 839, 1 [NASA ADS] [CrossRef] [Google Scholar]
- Mangum, J. G., & Wootten, A. 1993, ApJS, 89, 123 [NASA ADS] [CrossRef] [Google Scholar]
- Mangum, J. G., Wootten, A., Wadiak, E. J., & Loren, R. B. 1990, ApJ, 348, 542 [NASA ADS] [CrossRef] [Google Scholar]
- Mangum, J. G., Wootten, A., & Plambeck, R. L. 1993, ApJ, 409, 282 [NASA ADS] [CrossRef] [Google Scholar]
- Mangum, J. G., Wootten, A., & Barsony, M. 1999, ApJ, 526, 845 [NASA ADS] [CrossRef] [Google Scholar]
- Mangum, J. G., Darling, J., Menten, K. M., & Henkel, C. 2008, ApJ, 673, 832 [NASA ADS] [CrossRef] [Google Scholar]
- Mangum, J. G., Darling, J., Henkel, C., et al. 2013a, ApJ, 779, 33 [NASA ADS] [CrossRef] [Google Scholar]
- Mangum, J. G., Darling, J., Henkel, C., et al. 2013b, ApJ, 766, 108 [NASA ADS] [CrossRef] [Google Scholar]
- Martín-Pintado, J., Rodríguez-Franco, A., & Bachiller, R. 1990, ApJ, 357, 49 [Google Scholar]
- Mauersberger, R., Henkel, C., Wilson, T. L., et al. 1986, A&A, 162, 199 [NASA ADS] [Google Scholar]
- Mauersberger, R., Henkel, C., & Wilson, T. L. 1987, A&A, 173, 352 [NASA ADS] [Google Scholar]
- Megeath, S. T., Gutermuth, R., Muzerolle, J., et al. 2012, AJ, 144, 192 [NASA ADS] [CrossRef] [Google Scholar]
- Melnick, G. J., Tolls, V., Snell, R. L., et al. 2011, ApJ, 727, 13 [NASA ADS] [CrossRef] [Google Scholar]
- Menten, K. M., Reid, M. J., Forbrich, J., & Brunthaler, A. 2007, A&A, 474, 515 [NASA ADS] [CrossRef] [EDP Sciences] [Google Scholar]
- Merello, M., Evans, N. J. II., Shirley, Y. L., et al. 2015, ApJS, 218, 1 [NASA ADS] [CrossRef] [Google Scholar]
- Mitchell, G. F., Johnstone, D., Moriarty-Schieven, G., et al. 2001, ApJ, 556, 215 [NASA ADS] [CrossRef] [Google Scholar]
- Molinari, S., Brand, J., Cesaroni, R., & Palla, F. 1996, A&A, 308, 573 [NASA ADS] [Google Scholar]
- Mookerjea, B., Ghosh, S. K., Rengarajan, T. N., et al. 2000, AJ, 120, 1954 [NASA ADS] [CrossRef] [Google Scholar]
- Mühle, S., Seaquist, E. R., & Henkel, C. 2007, ApJ, 671, 1579 [NASA ADS] [CrossRef] [Google Scholar]
- Murata, Y., Kawabe, R., Ishiguro, M., et al. 1990, ApJ, 359, 125 [NASA ADS] [CrossRef] [Google Scholar]
- Nagy, Z., van der Tak, F. F. S., Fuller, G. A., et al. 2012, A&A, 542, A6 [NASA ADS] [CrossRef] [EDP Sciences] [Google Scholar]
- Nishimura, A., Tokuda, K., Kimura, K., et al. 2015, ApJS, 216, 18 [NASA ADS] [CrossRef] [EDP Sciences] [Google Scholar]
- O’Dell, C. R., Muench, A., Smith, N., & Zapata, L. 2008, Handbook of Star Forming Regions, Vol. I: The Northern Sky ASP Monograph Publications, Vol. 4, ed. B. Reipurth (San Francisco: ASP), 544 [Google Scholar]
- Ott, J., Weiss, A., Staveley-Smith, L., et al. 2014, ApJ, 785, 16 [Google Scholar]
- Pan, L., & Padoan, P. 2009, ApJ, 692, 594 [NASA ADS] [CrossRef] [Google Scholar]
- Peng, T. C., Wyrowski, F., Zapata, L. A., et al. 2012, A&A, 538, A12 [NASA ADS] [CrossRef] [EDP Sciences] [Google Scholar]
- Qin, S. L., Zhao, J. H., Moran, J. M., et al. 2008, ApJ, 677, 353 [NASA ADS] [CrossRef] [Google Scholar]
- Rodríguez-Franco, A., Martín-Pintado, J., Gómez-Gínzalez, J., & Planesas, P. 1992, A&A, 264, 592 [Google Scholar]
- Salgado, F., Berné, O., Adams, J. D., et al. 2016, ApJ, 830, 118 [NASA ADS] [CrossRef] [Google Scholar]
- Salji, C. J., Richer, J. S., Buckle, J. V., et al. 2015, MNRAS, 449, 1782 [NASA ADS] [CrossRef] [Google Scholar]
- Schilke, P., Walmsley, C. M., Pineau Des Forets, G., et al. 1992, A&A, 256, 595 [Google Scholar]
- Schnee, S., Rosolowsky, E., Foster, J., Enoch, M., & Sargent, A. 2009, ApJ, 691, 1754 [NASA ADS] [CrossRef] [Google Scholar]
- Shimajiri, Y., Kawabe, R., Takakuwa, S., et al. 2011, PASJ, 63, 105 [NASA ADS] [Google Scholar]
- Shimajiri, Y., Kitamura, Y., Saito, M., et al. 2014, A&A, 564, A68 [NASA ADS] [CrossRef] [EDP Sciences] [Google Scholar]
- Shirley, Y. L. 2015, PASP, 127, 299 [NASA ADS] [CrossRef] [Google Scholar]
- Stutz, A. M., & Kainulainen, J. 2015, A&A, 577, L6 [NASA ADS] [CrossRef] [EDP Sciences] [Google Scholar]
- Tang, X. D., Esimbek, J., Zhou, J. J., et al. 2013, A&A, 551, A28 [NASA ADS] [CrossRef] [EDP Sciences] [Google Scholar]
- Tang, X. D., Henkel, C., Menten, K. M., et al. 2017a, A&A, 598, A30 (Paper I) [NASA ADS] [CrossRef] [EDP Sciences] [Google Scholar]
- Tang, X. D., Henkel, C., Chen, C.-H. R., et al. 2017b, A&A, 600, A16 (Paper II) [NASA ADS] [CrossRef] [EDP Sciences] [Google Scholar]
- Tang, X. D., Henkel, C., Wyrowski, F., et al. 2018, A&A, in press, DOI: 10.1051/0004-6361/201732168 [Google Scholar]
- Tatematsu, K., Umemoto, T., Kameya, O., et al. 1993, ApJ, 404, 643 [NASA ADS] [CrossRef] [Google Scholar]
- Tatematsu, K., Umemoto, T., Heyer, M. H., et al. 1998, ApJS, 118, 517 [NASA ADS] [CrossRef] [Google Scholar]
- Tatematsu, K., Kandori, R., Umemoto, T., & Sekimoto, Y. 2008, PASJ, 60, 407 [NASA ADS] [Google Scholar]
- Thaddeus, P., Wilson, R. W., Kutner, M., et al. 1971, ApJ, 168, 59 [NASA ADS] [CrossRef] [Google Scholar]
- Treviño-Morales, S. P., Pilleri, P., Fuente, A., et al. 2014, A&A, 569, A19 [NASA ADS] [CrossRef] [EDP Sciences] [Google Scholar]
- Ungerechts, H., Bergin, E. A., Goldsmith, P. F., et al. 1997, ApJ, 482, 245 [NASA ADS] [CrossRef] [PubMed] [Google Scholar]
- Urquhart, J. S., Morgan, L. K., Figura, C. C., et al. 2011, MNRAS, 418, 1689 [NASA ADS] [CrossRef] [Google Scholar]
- Urquhart, J. S., Figura, C. C., Moore, T. J. T., et al. 2015, MNRAS, 452, 4029 [NASA ADS] [CrossRef] [Google Scholar]
- Vaillancourt, J. E. 2002, ApJS, 142, 53 [NASA ADS] [CrossRef] [Google Scholar]
- van der Tak, F. F. S., Black, J. H., Schöier, F. L., et al. 2007, A&A, 468, 627 [NASA ADS] [CrossRef] [EDP Sciences] [Google Scholar]
- van der Wiel, M. H. D., van der Tak, F. F. S., Ossenkopf, V., et al. 2009, A&A, 498, 161 [NASA ADS] [CrossRef] [EDP Sciences] [Google Scholar]
- Walmsley, C. M., & Ungerechts, H. 1983, A&A, 122, 164 [NASA ADS] [Google Scholar]
- Wang, Y., Beuther, H., Zhang, Q., et al. 2012, ApJ, 754, 87 [NASA ADS] [CrossRef] [Google Scholar]
- Watanabe, T., & Mitchell, G. 2008, AJ, 136, 1947 [NASA ADS] [CrossRef] [Google Scholar]
- Weiß, A., Neininger, N., Henkel, C., et al. 2001, ApJ, 554, L143 [NASA ADS] [CrossRef] [Google Scholar]
- Wienen, M., Wyrowski, F., Schuller, F., et al. 2012, A&A, 544, A146 [NASA ADS] [CrossRef] [EDP Sciences] [Google Scholar]
- Wiesenfeld, L., & Faure, A. 2013, MNRAS, 432, 2573 [NASA ADS] [CrossRef] [Google Scholar]
- Wilson, B. A., Dame, T. M., Masheder, M. R. W., et al. 2005, A&A, 430, 523 [NASA ADS] [CrossRef] [EDP Sciences] [Google Scholar]
- Wiseman, J. J., & Ho, P. T. P. 1996, Nature, 382, 139 [NASA ADS] [CrossRef] [Google Scholar]
- Wiseman, J. J., & Ho, P. T. P. 1998, ApJ, 502, 676 [NASA ADS] [CrossRef] [Google Scholar]
- Wouterloot, J. G. A., Walmsley, C. M., & Henkel, C. 1988, A&A, 203, 367 [NASA ADS] [Google Scholar]
- Wu, Y., Zhang, Q., Yu, W., et al. 2006, A&A, 450, 607 [NASA ADS] [CrossRef] [EDP Sciences] [Google Scholar]
- Yu, N., & Xu, J. 2016, ApJ, 833, 248 [NASA ADS] [CrossRef] [Google Scholar]
- Zapata, L. A., Rodríguez, L. F., Kurtz, S. E., et al. 2004, ApJ, 610, L121 [NASA ADS] [CrossRef] [Google Scholar]
- Zapata, L. A., Schmid-Burgk, J., & Menten, K. M. 2011, A&A, 529, A24 [NASA ADS] [CrossRef] [EDP Sciences] [Google Scholar]
- Zhang, C. P., Esimbek, J., Zhou, J. J., et al. 2012, Ap&SS, 337, 283 [NASA ADS] [CrossRef] [Google Scholar]
- Zylka, R., Güsten, R., Henkel, C., & Batrla, W. 1992, A&AS, 96, 525 [NASA ADS] [Google Scholar]
Appendix A: H2CO velocity channel maps
 |
Fig. A.1 Channel maps of the para-H2CO 303–202 transition. The contours are running from 0.5 to 2.9 K in steps of 0.6 K and from 3.5 to 14.3 K in steps of 1.2 K ( |
Appendix B: Comparison of H2CO, NH3, and dust distributions
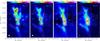 |
Fig. B.1 Para-H2CO (303–202) with integrated intensity contours (same as in Fig. 2) overlaid on NH3 (1, 1), and (2, 2) integrated intensity observed with the GBT (beam size ~30′′; left panels; Friesen et al. 2017), and JCMT/SCUBA 450 and 850 μm dust emission (beam sizes 7.5′′ and 14′′; right panels; Johnston & Bally 1999) images of the OMC-1. The beam of each image is shown in the lower left corner. |
Appendix C: Comparison of para-H2CO 322–221 and 321–220 line profiles
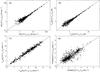 |
Fig. C.1 Comparisons of integrated intensities (a), line brightness temperatures (b), velocities (c), and linewidths (d) of para-H2CO 322–221 and 321–220 lines. The straight lines indicate Y = X. |
Appendix D: Comparison of gas kinetic temperatures derived from para-H2CO and NH3
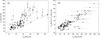 |
Fig. D.1 Comparison of gas kinetic temperatures (a) and relative gas kinetic temperature difference (b) derived from para-H2CO (3–2) and NH3 (2, 2)/(1, 1) line ratios. The straight line indicates same temperature. |
All Tables
All Figures
|
Fig. 1 A spectrum toward Orion KL obtained with APEX (Atacama Pathfinder EXperiment). The three H2CO lines discussed in this paper are marked in red. |
| In the text | |
|
Fig. 2 Intensity maps ( |
| In the text | |
|
Fig. 3 Para-H2CO 303–202 intensity-weighted mean velocity map (moment 1, left) and velocity dispersion map (moment 2, right). The unit of each color bar is km s-1. Contours are para-H2CO 303–202 integrated intensities (same as in Fig. 2). |
| In the text | |
|
Fig. 4 RADEX non-LTE modeling of the relation between the kinetic temperature and the average ratio of para-H2CO 322–221/303–202 and 321–220/303–202 with an assumed density of n(H2) = 105 cm-3, an averaged linewidth of 2.0 km s-1, and column density of N(para-H2CO) = 1 × 10¹³ (red line), 5 × 10¹³ (green line), and 1 × 1014 cm-2 (blue line). The black points are derived from our observed H2CO line ratios for a column density N(para-H2CO) = 5 × 1013 cm-2, the average value for the OMC-1 (see Sect. 3.2). The temperature uncertainties are obtained from observed para-H2CO line ratio errors. |
| In the text | |
|
Fig. 5 Left: averaged (see Sect. 3.2) velocity-integrated intensity ratio map of para-H2CO 0.5 × [(322–221 + 321–220)/303–202] in the OMC-1. Middle: kinetic temperatures derived from the para-H2CO (3–2) line ratios. Right: kinetic temperatures derived from NH3 (2, 2)/(1, 1) ratios observed with the GBT (beam size ~30′′; Friesen et al. 2017). Black contours show the contour of integrated intensity of para-H2CO 303–202 at 1.9 K km s-1 (see Fig. 2). Red contours show the velocity-integrated intensity (VLSR = –30 to +30 km s-1) of the H41α recombination line observed with IRAM (beam size ~30′′; Goicoechea et al. 2015). Stars show the locations of the Trapezium stars (θ1 Ori A, B, C, D, and E). The unit of the color bars of the middle and right panels is in both cases Kelvin. |
| In the text | |
|
Fig. 6 Maps of sound speed (left; color bar in units of km s-1), thermal to non-thermal gas pressure (middle), and Mach number (right) in the OMC-1. Contours and stars are the same as in Fig. 5. For details, see Sect. 4.3. |
| In the text | |
|
Fig. 7 Non-thermal velocity dispersion (σNT) vs. gas kinetic temperature derived from the para-H2CO line ratio (Sect. 3.2) for locations with the Mach number M ≳ 2.5 in the OMC-1 (blue points) and ATLASGAL massive star-forming clumps (green points; Tang et al. 2018). The blue line is the result from a linear fit for the OMC-1 data. The red line is the linearly fitted result for OMC-1 (M ≳ 2.5) and ATLASGAL data. Black solid and dashed lines indicate relations between non-thermal velocity dispersion and gas kinetic temperature derived from para-H2CO and NH3 at density 105 cm-3 in the Galactic CMZ clouds, respectively (Güsten et al. 1985; Immer et al. 2016). |
| In the text | |
|
Fig. 8 Gas kinetic temperature derived from para-H2CO (3–2) (blue points) and NH3 (2, 2)/(1, 1) (black points) ratios along the northern 10 km s-1 filament of the OMC-1 ridge (distance from IRc2, α = 05:35:14.48, δ = –05:22:30.56, J2000). The blue and black lines are the fitted results for para-H2CO and NH3, respectively, with distance R > 0.5′. The red and green lines are the expected relationships from a Stefan-Boltzmann law and modified Stefan-Boltzmann law (see Sect. 4.5), respectively, assuming Orion KL is the dominant source with an approximate luminosity of 105 L⊙ (Downes et al. 1981; Wiseman & Ho 1998). |
| In the text | |
|
Fig. A.1 Channel maps of the para-H2CO 303–202 transition. The contours are running from 0.5 to 2.9 K in steps of 0.6 K and from 3.5 to 14.3 K in steps of 1.2 K ( |
| In the text | |
|
Fig. B.1 Para-H2CO (303–202) with integrated intensity contours (same as in Fig. 2) overlaid on NH3 (1, 1), and (2, 2) integrated intensity observed with the GBT (beam size ~30′′; left panels; Friesen et al. 2017), and JCMT/SCUBA 450 and 850 μm dust emission (beam sizes 7.5′′ and 14′′; right panels; Johnston & Bally 1999) images of the OMC-1. The beam of each image is shown in the lower left corner. |
| In the text | |
|
Fig. C.1 Comparisons of integrated intensities (a), line brightness temperatures (b), velocities (c), and linewidths (d) of para-H2CO 322–221 and 321–220 lines. The straight lines indicate Y = X. |
| In the text | |
|
Fig. D.1 Comparison of gas kinetic temperatures (a) and relative gas kinetic temperature difference (b) derived from para-H2CO (3–2) and NH3 (2, 2)/(1, 1) line ratios. The straight line indicates same temperature. |
| In the text | |
Current usage metrics show cumulative count of Article Views (full-text article views including HTML views, PDF and ePub downloads, according to the available data) and Abstracts Views on Vision4Press platform.
Data correspond to usage on the plateform after 2015. The current usage metrics is available 48-96 hours after online publication and is updated daily on week days.
Initial download of the metrics may take a while.