Fig. 2
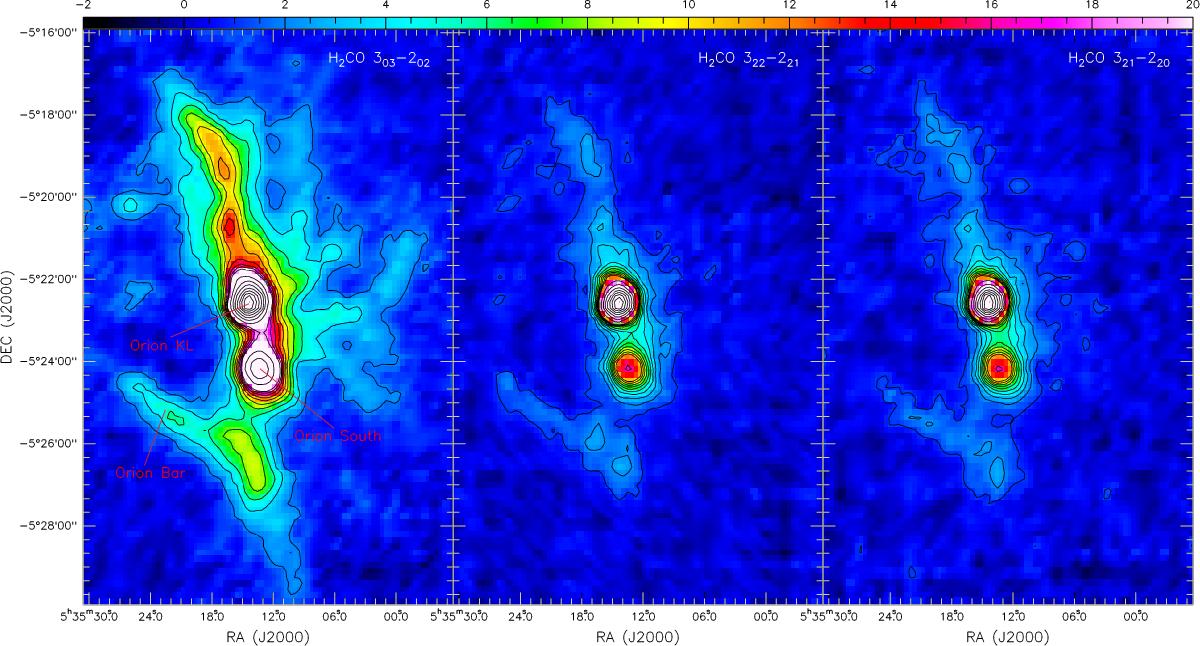
Intensity maps (![]() scale; color bar in units of K km s-1) of para-H2CO 303–202 (left), 322–221 (middle), and 321–220 (right) integrated from VLSR = 4 to 14 km s-1 of the OMC-1 cloud. Contour levels are from 1.9 to 19 K km s-1 with steps of 1.9 K km s-1 and from 19 to 95 K km s-1 with steps of 9.5 K km s-1 for para-H2CO 303–202, and from 1.05 to 10.5 K km s-1 with steps of 1.05 K km s-1 and from 10.5 to 52.5 K km s-1 with steps of 5.25 K km s-1 for para-H2CO 322–221 and 321–220.
scale; color bar in units of K km s-1) of para-H2CO 303–202 (left), 322–221 (middle), and 321–220 (right) integrated from VLSR = 4 to 14 km s-1 of the OMC-1 cloud. Contour levels are from 1.9 to 19 K km s-1 with steps of 1.9 K km s-1 and from 19 to 95 K km s-1 with steps of 9.5 K km s-1 for para-H2CO 303–202, and from 1.05 to 10.5 K km s-1 with steps of 1.05 K km s-1 and from 10.5 to 52.5 K km s-1 with steps of 5.25 K km s-1 for para-H2CO 322–221 and 321–220.
Current usage metrics show cumulative count of Article Views (full-text article views including HTML views, PDF and ePub downloads, according to the available data) and Abstracts Views on Vision4Press platform.
Data correspond to usage on the plateform after 2015. The current usage metrics is available 48-96 hours after online publication and is updated daily on week days.
Initial download of the metrics may take a while.