Fig. B.1
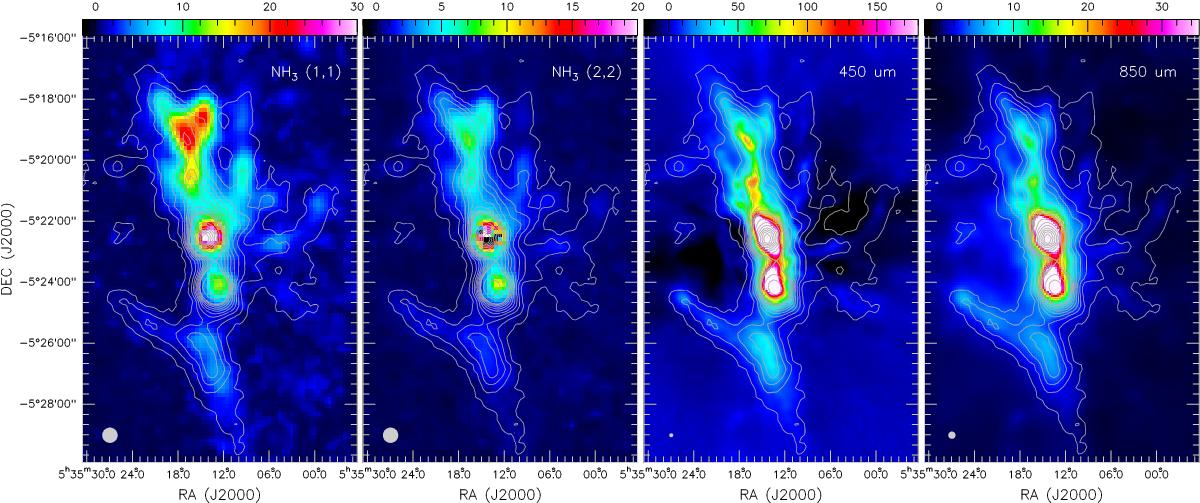
Para-H2CO (303–202) with integrated intensity contours (same as in Fig. 2) overlaid on NH3 (1, 1), and (2, 2) integrated intensity observed with the GBT (beam size ~30′′; left panels; Friesen et al. 2017), and JCMT/SCUBA 450 and 850 μm dust emission (beam sizes 7.5′′ and 14′′; right panels; Johnston & Bally 1999) images of the OMC-1. The beam of each image is shown in the lower left corner.
Current usage metrics show cumulative count of Article Views (full-text article views including HTML views, PDF and ePub downloads, according to the available data) and Abstracts Views on Vision4Press platform.
Data correspond to usage on the plateform after 2015. The current usage metrics is available 48-96 hours after online publication and is updated daily on week days.
Initial download of the metrics may take a while.