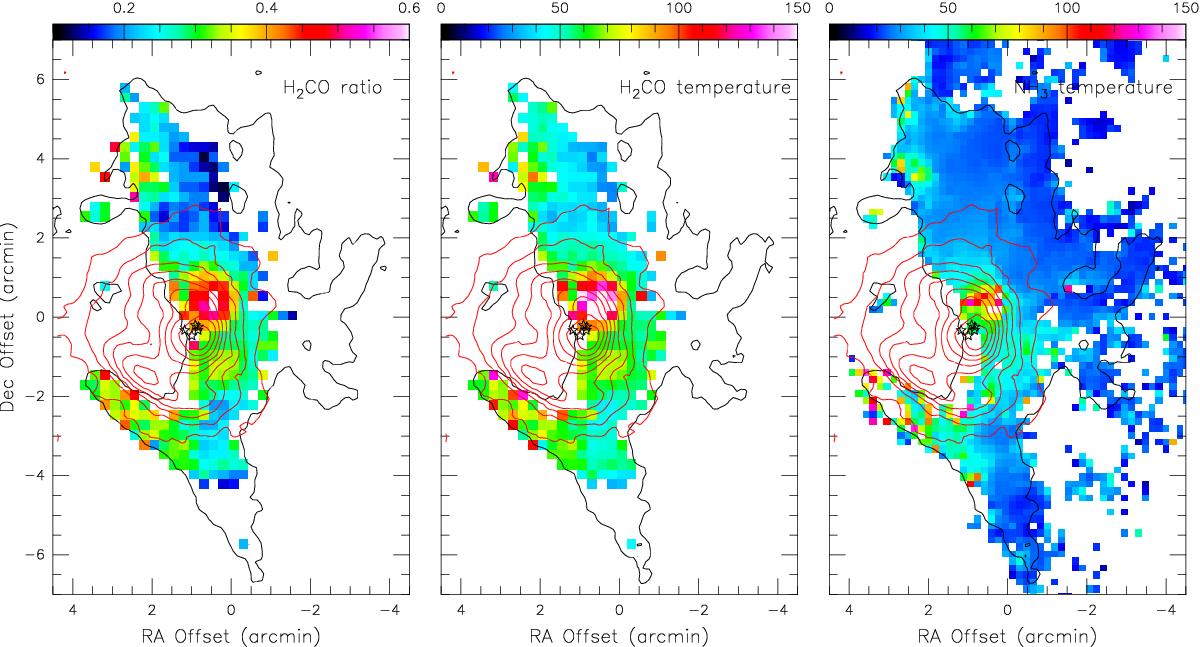
Fig. 5

Left: averaged (see Sect. 3.2) velocity-integrated intensity ratio map of para-H2CO 0.5 × [(322–221 + 321–220)/303–202] in the OMC-1. Middle: kinetic temperatures derived from the para-H2CO (3–2) line ratios. Right: kinetic temperatures derived from NH3 (2, 2)/(1, 1) ratios observed with the GBT (beam size ~30′′; Friesen et al. 2017). Black contours show the contour of integrated intensity of para-H2CO 303–202 at 1.9 K km s-1 (see Fig. 2). Red contours show the velocity-integrated intensity (VLSR = –30 to +30 km s-1) of the H41α recombination line observed with IRAM (beam size ~30′′; Goicoechea et al. 2015). Stars show the locations of the Trapezium stars (θ1 Ori A, B, C, D, and E). The unit of the color bars of the middle and right panels is in both cases Kelvin.
Current usage metrics show cumulative count of Article Views (full-text article views including HTML views, PDF and ePub downloads, according to the available data) and Abstracts Views on Vision4Press platform.
Data correspond to usage on the plateform after 2015. The current usage metrics is available 48-96 hours after online publication and is updated daily on week days.
Initial download of the metrics may take a while.


