| Issue |
A&A
Volume 609, January 2018
|
|
|---|---|---|
| Article Number | A14 | |
| Number of page(s) | 12 | |
| Section | The Sun | |
| DOI | https://doi.org/10.1051/0004-6361/201731504 | |
| Published online | 22 December 2017 | |
The chromosphere above a δ-sunspot in the presence of fan-shaped jets⋆
Institute for Solar Physics, Department of Astronomy, Stockholm University, AlbaNova University Centre, 106 91 Stockholm, Sweden
e-mail: This email address is being protected from spambots. You need JavaScript enabled to view it.
Received: 4 July 2017
Accepted: 12 September 2017
Abstract
Context. Delta-sunspots are known to be favourable locations for fast and energetic events like flares and coronal mass ejections. The photosphere of this sunspot type has been thoroughly investigated in the past three decades. The atmospheric conditions in the chromosphere are not as well known, however.
Aims. This study is focused on the chromosphere of a δ-sunspot that harbours a series of fan-shaped jets in its penumbra. The aim of this study is to establish the magnetic field topology and the temperature distribution in the presence of jets in the photosphere and the chromosphere.
Methods. We use data from the Swedish 1m Solar Telescope (SST) and the Solar Dynamics Observatory. We invert the spectropolarimetric Fe i 6302 Å and Ca ii 8542 Å data from the SST using the non-LTE inversion code NICOLE to estimate the magnetic field configuration, temperature, and velocity structure in the chromosphere.
Results. A loop-like magnetic structure is observed to emerge in the penumbra of the sunspot. The jets are launched from this structure. Magnetic reconnection between this emerging field and the pre-existing vertical field is suggested by hot plasma patches on the interface between the two fields. The height at which the reconnection takes place is located between log τ500 = −2 and log τ500 = −3. The magnetic field vector and the atmospheric temperature maps show a stationary configuration during the whole observation.
Key words: Sun: chromosphere / Sun: photosphere / sunspots / techniques: polarimetric
Movies associated to Figs. 3–5 are available at http://www.aanda.org
© ESO, 2017
1. Introduction
The chromosphere above sunspots exhibits many dynamic phenomena, such as umbral flashes, running penumbral waves, and various types of jets.
Chromospheric fan-shaped jets launched from sunspots have been reported by several authors (Roy 1973; Asai et al. 2001; Shimizu et al. 2009; Hou et al. 2016; Robustini et al. 2016; Li et al. 2016; Yang et al. 2016). From these previous observations, we know that the length of these jets is of tens of Mm. They have an average velocity of 100–200 km s-1 and can last for more than one hour. They exhibit a sideways motion that has also been observed (Shibata et al. 1992; Savcheva et al. 2007) and simulated (Moreno-Insertis et al. 2008; Moreno-Insertis & Galsgaard 2013) in anemone jets. The jets appear dark in Hα and may exhibit a bright front in the extreme-UV (EUV) lines. In Shimizu et al. (2009) and Robustini et al. (2016) the jet footpoints appear bright in Ca ii H and Hα, respectively. It has been suggested that the driver of this type of jet is magnetic reconnection and that, consequently, the bright footpoints are the result of local plasma heating.
Jiang et al. (2011) have reproduced the structure of a fan-shaped jet in a 3D simulation of magnetic reconnection. The fan structure that they simulate is caused by the sheared guide field lines that thread through the current sheet, and the jets are accelerated first by the magnetic pressure gradient and then by gas pressure gradients.
These jets are recurrently launched above sunspot structures. The majority (Roy 1973; Asai et al. 2001; Shimizu et al. 2009; Robustini et al. 2016; Yang et al. 2016) have been reported on light-bridges. There are nonetheless some exceptions. In one of the observations of Roy (1973) (MW 18594) the jets are rooted in the penumbra of a negative sunspot group harbouring a positive polarity patch that weakens when jets start appearing. In the observations of Hou et al. (2016) the jets are launched from an apparent positive polarity field region between two distinct regular α-negative sunspots.
In this paper we report on fan-shaped jets observed in the penumbra of a δ-sunspot. This kind of sunspot configuration consists of umbrae of both polarities sharing the same penumbra (Künzel 1960). δ-sunspots can harbour strong current densities (Solanki 2003) and are often associated with flaring activity (Zirin & Liggett 1987; Sammis et al. 2000). It has been suggested that the complex topology of δ-sunspots originates from the emergence of twisted flux tubes (Tanaka 1991; Kurokawa et al. 2002). Takasao et al. (2015) simulated the formation of a δ-sunspot configuration from the emergence of an unstable kinked flux tube which spontaneously develops into a quadrupole. The four polarities do not appear all together. The first to appear is the main pair. The arcade connecting the first pair expands and plasma accumulates on its top. Eventually this leads to the submergence of the magnetic field and the appearance of a second pair of polarities between the main pair. The emerging flux tube employed by Takasao et al. (2015) had a single buoyant segment.
In addition, δ-sunspots have been simulated using two buoyant segments in a twisted flux emerging at the same time (Fang & Fan 2015). The submergence of the magnetic field predicted by these two models finds its observational proof in the downflow observed at the polarity inversion line (PIL) by Martinez Pillet et al. (1994).
Balthasar et al. (2014) and Jaeggli (2016) employed near-infrared spectropolarimetry to retrieve the magnetic and dynamical properties of δ-sunspots in the photosphere. Balthasar et al. (2014) report on the presence of an upflow aligned with the PIL of the spot and some photospheric brightenings. Jaeggli (2016) found an intensification of the transverse magnetic field at the PIL. A similar intensification can also be found in Cristaldi et al. (2014). While the magnetic topology of δ-sunspots has been largely studied in the photosphere, we know very little about its configuration in the chromosphere. In this paper we will present the results of a study of the chromosphere above a δ-sunspot in the presence of fan-shaped jets, using polarimetric data inversion.
2. Observations and data reduction
The target of the observations is a δ-sunspot located in the active region NOAA 11791, observed on 2013 July 15 from 07:18 to 08:24 UT. The coordinates in the middle of the time series are 15.26° S, 16.69° E, with an observing angle of 27° (μ = 0.89).
Our observations were carried out at the Swedish 1m Solar Telescope (SST, Scharmer et al. 2003) using the CRisp Imaging SpectroPolarimeter (CRISP; Scharmer et al. 2008) along three different line profiles:
-
Hα 6563 Å, at 13positions between 6561.45 and6564.55 Å;
-
Fe i 6301–6302 Å, at 18 positions between 6300.45 and 6302.10 Å;
-
Ca ii 8542 Å, at 21 positions between 8540.25 and 8543.75 Å.
The cadence between two complete profile scans along the same profile is 27 s. The pixel size and the spectral resolution at 630 nm are 0.̋059 and R = λ/δλ ≈ 114 000, respectively.
We recorded full Stokes vector data for Fe i 6301–6302 Å and Ca ii 8542 Å. These lines, with respective effective Landé factor of 2.5 and 1.1 are good diagnostic tools for the magnetic field in the photosphere (Fe i) and chromosphere (Ca ii). The CRISP data reduction followed the pipeline described in de la Cruz Rodríguez et al. (2015), which includes image restoration with Multi-Object Multi-Frame Blind Deconvolution (MOMFBD; van Noort et al. 2005). In order to avoid degradation of the signal-to-noise ratio from interpolation noise, the three datasets were spatially aligned using as reference cube the Ca ii 8542 Å data which has a weaker polarimetric signal than Fe i 6301–6302 Å.
We also made use of co-observations of the Helioseismic and Magnetic Imager (HMI; Scherrer et al. 2012) and the Atmospheric Imaging Assembly (AIA; Lemen et al. 2012) on board the Solar Dynamics Observatory (SDO; Pesnell et al. 2012).
The AIA data (with 12 s cadence) and HMI data (with 48 s cadence) have been aligned and resampled in space and time to match the cadence and pixel size of the SST data using the routines developed by R. J. Rutten1. The alignment was done by first rotating the SDO subfield of interest to the same orientation as the SST data. Then a cross-correlation between the SST Hα wide-band and the HMI continuum data is performed. The accuracy of the co-alignment is of the order of an SDO pixel size ( ).
).
Figure 1 shows the time evolution of the line of sight (LOS) magnetic field provided by HMI. Initially, the whole sunspot group has negative polarity (panels a–b). Positive flux emergence appears on 2013 July 14 (arrow in panel c) and forms a small sunspot of opposite polarity in the penumbra of the main sunspot. A second smaller area of positive flux emergence appears at the same time as the observations (arrow in panel e). This positive flux cancels the close negative polarity, leaving no trace the day after (panel f).
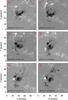 |
Fig. 1 Time evolution of the LOS magnetic field (SDO/HMI) of a sunspot group located in the active region NOAA 11791. Positive flux emergence is highlighted by the blue arrows in panels c and e. The green and the red arrows point towards the north and the disk centre, respectively. |
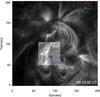 |
Fig. 2 AIA 171 image of the active region (AR) NOAA 11791. The square inset indicates the FOV of the SST observations (see Fig. 3), and shows the Hα line core at 08:10:50 UT. The blue arrow highlights the location of the fan-shaped jets. The green arrow points towards the north and the red arrow towards the disk centre. |
Figure 2 shows the active region (AR) of interest in the AIA 171 channel. A coronal loop connects the positive polarity of the AR with the negative one, where the CRISP field of view (FOV) is located. The CRISP FOV is indicated by a white box that contains a superposition of AIA 171 and Hα line core images. The blue arrow highlights the position of the fan-shaped jets featured in our observations and it shows that the entire jet structure is aligned with the direction of the coronal loop.
3. Results
Figure 3 displays a sample of the dataset at 08:10:50 UT. Panel (a) shows the photosphere observed in the line core of Fe i 6302 Å. The penumbra of the main sunspot appears slightly twisted anti-clockwise, as do the penumbrae of the smaller spots. Fe i 6302 Å does not exhibit any remarkable activity. On the contrary, dark recurrent fan-shaped jets and bright footpoints appear in the penumbra between the main sunspot and the other spots in the Hα line core (c) and wings (b). The jets appear less visible in the core of Ca ii 8542 Å. Only the fronts are dark and have good contrast while the rest of the jets have line cores in emission. The plasma is mainly ejected in the S-W direction except for an apparently shorter series of jets located at X = 16″, Y = 24″ (panels c and d). In the associated animation it is possible to observe a transversal motion of the jets along the bright lane of the footpoints. During the entire observation, the plasma ejections are accompanied by a flare-like brightening located on the left side of the positive sunspot, as visible in the chromospheric images in panels c and d.
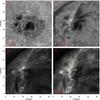 |
Fig. 3 Sample of the dataset at 08:10:50 UT. a) Line core of Fe i 6302 Å; b) Hα blue wing at Δλ = −0.6 Å; c) Hα line core; and d) Ca ii 8542 Å line core. The orange box is the subfield chosen for the inversion of this time step. The smaller green boxes are the subfields for which the entire time series has been inverted. The numbered diamond symbols indicate the location of the selected Stokes profiles shown in Fig. 6. The green arrow points towards the north and the red arrow towards the disk centre. The temporal evolution can be found in a movie available online. In the middle of the time series, the field of view is shifted. |
Figure 4 shows SST and AIA images of one of the brightest events of the entire time series. The bright event is located at the footpoint of the jets, as is clearly visible in Hα (a). Unlike the constant brightening on the left of the sunspot group, the footpoint intensity is highly variable with time.
The brightening has the same spatial extent in the 1600 Å channel (d), while in 1700 Å (c) only one smaller round brightening appears at the top of the bright lane. The 1700 Å opacity is dominated by the Si i continuum and a multitude of UV lines, and the intensity forms in the photosphere and low chromosphere (Fossum & Carlsson 2005). It is not sensitive to transition region temperatures. The AIA 1600 Å band is sensitive to both photospheric and transition region temperatures owing to the C iv lines located around 1550 Å. This suggests that the plasma at the base of the jets can have a transition-region-like temperature, much higher than normally found in the chromosphere. Although Ca ii 8542 Å in panel (b) has a similar appearance to Hα, it does not show such a strong brightness. This can be explained by the higher opacity of Hα compared to Ca ii 8542 Å at temperatures well above 20 kK (e.g. Carlsson & Leenaarts 2012; Rutten 2016, 2017). The same extreme event is visible in the EUV channels of AIA 171 Å (e) and 335 Å (f). In 171 Å the jet fronts are brighter than the jet bulk, as already seen in previous observations (Robustini et al. 2016). The jets and the front are darker in 335 Å for which the characteristic temperature is 2.5 × 10⁶ K (Lemen et al. 2012), which is one order of magnitude higher than in 171 Å. This poses an upper boundary to the temperature of the jet fronts.
The panels of Fig. 5 show the same wavelengths of Fig. 4 at 08:10:50 UT (same time as Fig. 3). For this time step, the Hα footpoint brightening is no longer visible in the EUV channels (e-f). The 1600 Å channel has a similar appearance to that of 1700 Å except for a small brightening at X = 21″, Y = 39″, which corresponds to the core of the Hα brightening. This feature can be seen more clearly in Fig. 9c.
Unlike the extreme event of Fig. 4, the time step shown in Fig. 5 is representative of the entire time series. The jet footpoints typically show similar scenes in AIA 1600 and 1700 Å. The comparison between Figs. 4 and 5 shows that there is a preferred path along which heating and the consequent brightenings develop, and that there are locations that are constantly active along this path.
The different appearance of the fine structure, visible in panels a and b in both figures, is due to the variable seeing conditions in the Earth’s atmosphere that change the quality of the data despite the image restoration.
3.1. Data inversion
To reconstruct the structure of the atmosphere we use the non-LTE inversion code NICOLE (Socas-Navarro et al. 2015). We include the effect of Ca ii isotopic splitting in our calculations, which introduces a red-wing asymmetry in the 8542 line profile (Leenaarts et al. 2014). The transfer equation is solved using a cubic DELO-Bezier solver (de la Cruz Rodríguez & Piskunov 2013) and a regular depth-scale grid of 5 points per decade, which ensures a sufficiently accurate solution when computing the four Stokes parameters (Janett et al. 2017). For further details we refer to the code description paper.
The field of view that we have chosen is indicated by the orange boxes in Figs. 3a and d. The inversion of such a large field of view (FOV) is computationally demanding. Therefore, we selected only one time step at 08:10:50 UT (see Fig. 3) that exhibits good seeing in all the wavelength positions for both Fe i 6301–6302 Å and Ca ii 8542 Å. In addition, we inverted the Ca ii 8542 Å data for the entire time series for two smaller FOVs indicated by the green boxes Fig. 3d.
The starting guess model for all the inversions is a FALC atmosphere (Fontenla et al. 1993) with enhanced gas pressure at the upper boundary that accounts for the typical values of active regions. For the inversion of Fe i 6301–6302 Å we initialized the three components of the magnetic field (Bx,By,Bz) with a constant value of 500 G. We used four equidistant nodes in temperature; two in velocity; two in Bx,By,Bz; and one in microturbulence. For the inversion of the smaller and the larger FOVs of Ca ii 8542 Å, we used the same FALC atmosphere and a first estimate of the magnetic field obtained by the weak field approximation. The temperature was fitted with five non-equidistant nodes, with log τ500 at –7.0, –4.2, –2.9, –1.5, and –0.2, that were empirically selected to obtain the best fit of the Stokes parameters. We used two equidistant nodes for the velocity and the microturbulence. A good fit of the parameters can be obtained with just two equidistant nodes in Bx,By,Bz; however, we decided to apply three equidistant nodes to obtain magnetic field maps that look smoother.
The inversion of polarimetric data in Ca ii 8542 Å can be very challenging compared with photospheric inversions in the Fe i 6301–6302 Å lines. The main reason is the lower signal-to-noise ratio of chromospheric observations because of the weaker magnetic field. The reliability of the results is mainly guaranteed by the goodness of fit between the observed and the synthetic Stokes parameters retrieved from inversion. However, the physical meaning of the quantities characterizing the inferred model atmosphere should also be considered in order to establish whether the results can be accepted or not.
Figure 6 shows four examples of Stokes parameter profiles (black curve) and the fit (red curve) of the Ca ii 8542 Å dataset. These profiles represent the time average of four consecutive frames (27 × 4 s). This averaging increases the signal-to-noise ratio, but it can hide fast evolution of the atmosphere. The locations of these examples are indicated in Fig. 3d. We selected them because they show typical profiles of the regions in which they are located.
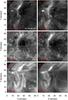 |
Fig. 4 Bright event at the jet footpoint at 07:24:32 UT. Panel a shows the blue wing of Hα at Δλ = −0.4 Å, panel b displays the line core of Ca ii 8542 Å. Panels c and d show the logarithm of the intensity in the AIA 1700 and 1600 Å channels, respectively. Panels e and f show the AIA EUV channels 171 and 335 Å. Panels c–f are spatially and temporally co-aligned to the CRISP dataset. The green arrow points towards the north and the red arrow towards the disk centre. The temporal evolution can be found in a movie available online. |
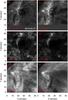 |
Fig. 5 Same as Fig. 4, but at 08:10:50 UT and c) and d) have a linear brightness scale instead of a logarithmic scale. The temporal evolution can be found in a movie available online. |
Point 1 is located in the dark part of the jet. The intensity is blue-shifted and the circular polarization V has several lobes, consistent with a region of upward and downward plasma motions coexisting in the same resolution element and inhomogeneities in the velocity. Point 2 also represents a dark region of the jet, but its profile is red-shifted. The circular polarization V has a clear asymmetry that NICOLE cannot fit properly. Point 1 and 2 have a small intensity bump in the red and in the blue wing, respectively, at the same wavelength of the maximum of the circular polarization. Point 3 was selected to compare its strong signal with the other three. It is located in the twisted penumbra of the negative small sunspot. The intensity profile is reversed in the core giving rise to an opposite sign of the stokes V signal (Sanchez Almeida 1997).
The linear polarization (Q and U) signal is above the typical noise level 10-3 of an imaging spectropolarimeter (Lagg et al. 2017). Stokes V exhibits asymmetry as in the case of the accelerated plasma of points 1 and 2, which appear clearer thanks to a stronger magnetic field. Point 4 shows the Stokes profiles of the bright part of the jets, close to the jet footpoints. The profile of this region differs significantly from points 1 and 2: the signal in U is higher with respect to the dark part of the jets, and Stokes V is quite symmetric and has a third central lobe. The former can be a sign of inhomogeneities in the magnetic field (Louis 2015) and is consistent with magneto-optical effects. These effects become more important as the magnetic field gets stronger and more inclined (Landolfi & Landi Degl’Innocenti 1982), which is the case for point 4 (see the magnetograms in Fig. 7).
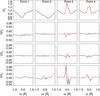 |
Fig. 6 Examples of typical Stokes profiles in the Ca ii 8542 Å line. The locations of the profiles are indicated in Figs. 3d and 7. The black and red curves represent the observed profiles and their fits, respectively. A description of the characteristics of each point is given in the text. |
3.1.1. Magnetic field
The magnetic field values that the inversion returns are affected by Zeeman azimuth ambiguity in the transversal component. There are several ways to remove this ambiguity (Metcalf et al. 2006). We chose the minimum energy method (MEM) proposed by Metcalf (1994), using the implementation of Leka et al. (2014). This method has been shown to be a promising solution for the photosphere of complicated active regions (Metcalf et al. 2006). We retrieved the azimuth map of the Fe i 6301–6302 Å at log τ500 = −1 , which is the depth point at which the line is most sensitive. The noise in the chromospheric magnetic field of Ca ii 8542 Å prevents the use of the MEM routine. Thus, we applied the principle of the acute angle method (Sakurai et al. 1985), comparing the direction of the photospheric field with the chromospheric field at log τ500 = −3. We used the same approach to retrieve the azimuthal direction at all the other depth points, in both Fe i 6301–6302 Å and Ca ii 8542 Å.
Figure 7 displays the magnetic field maps corrected for azimuth ambiguity and rotated to the local reference system where the z-axis corresponds to the local solar vertical. The first and the second rows of Fig. 7 show the photospheric and the chromospheric map, respectively. The azimuth de-ambiguation failed in the lower right corner of the FOV that corresponds to the inner part of the main sunspot umbra. The imprint of the azimuth is therefore clearly visible in both the horizontal field maps (Figs. 7b and e). This failure, however, occurs in a portion of the FOV that does not interested us, and it does not affect the rest of the azimuth map. The magnetic field maps that have been retrieved are consistent with the scenario in which the magnetic field in the sunspot expands and weakens with height. The chromospheric maps look smoother and have lower field strengths; it should be noted that the three components of the magnetic field have been saturated to 2 kG (–2 kG to +2 kG for the vertical field). These results assure that the field maps of Fig. 7 are reliable at large scales.
The retrieved topology is in agreement with the LOS magnetogram of Fig. 1e: it shows a negative polarity main sunspot and a pair of positive and negative smaller spots. The horizontal field (panels b and e) between the umbrae is rather strong and is, in most of the pixels, aligned with the penumbral filaments of the three sunspots. The photospheric vertical magnetic field maps (f) shows two strong-field patches of opposite polarity that are highlighted in Fig. 7 by two rectangles. According to the LOS field evolution of Fig. 1, these patches are newly emerged magnetic field concentrations. If we move higher into the chromosphere (c), these two opposite polarities weaken, especially the upper one located outside of the penumbra.
The inclination of the field is shown in panels g-i. The inclination at log τ500 = −1 (g) is computed from the inversion of Fe i 6301–6302 Å while panels h and i are derived from Ca ii 8542 Å. Panels g and h show a certain continuity that is not obvious for maps retrieved from two different lines. The inclination maps shows that the field between the two vertical field patches is almost horizontal, suggesting the presence of a loop structure that flattens as it moves higher and has its footpoints in the photosphere (log τ500 = −1). The horizontal field of this emerging loop is surrounded by a vertical and rather strong (0.3 vs. 1.2 kG) negative field. In such a buoyant structure as this loop, one would expect a torque in the magnetic field lines. However, if the field lines of the loop were twisted, we would observe opposite polarities in the loop structure, which instead are missing from the maps of Figs. 7c and e. The connectivity of the loop structure differs from the surrounding field, suggesting a different origin. The interface between the two fields where the inclination gradient becomes steeper, roughly coincides with the location of temperature enhancement. Figure 7i shows the contour of the regions where the temperature at log τ500 = −3 is higher than 8 kK: the contour patches are closer to the loop base and are stretched along the loop. Their position and shape are stable during the entire time series.
The structure of the jets is almost completely absent from the magnetic field maps as their imprint on the Stokes parameters is weak. There are some cases, however, where we can recognize the imprint of the jets in the vertical component of the magnetic field and in the magnetic field inclination map (blue arrows in Fig. 7). The location of the jets is characterized by an almost horizontal and weak field. Such an imprint is visible only for those jets in which the Ca ii 8542 Å intensity core is in absorption. The typical Stokes profiles along the jet footprint are represented by point 2 in Fig. 6, where the inversion code systematically fails to fit the circular polarization. It is therefore possible that the values of the field retrieved along that part of the jet are actually unrealistic and that the only reason why we have the imprint is that the misfit produces a very weak field superimposed on a strong field region.
Figure 8 is a zoom of the region including the loop-structure footpoints. It shows the inclination map at log τ500 = −3; superimposed on it are the direction of the horizontal field in the chromosphere (white arrows) and photosphere (green arrows). Along the loop, the direction of the horizontal field seems to be quite constant with height since the green and the white arrows are, most of the time, overlapping. However, in the region delimited by the dashed rectangle, the chromospheric horizontal field bends towards the small sunspot and the field direction is no longer constant in height. This indicates that there is a shear along the vertical direction in the region between the heating patches. Close to the umbra (left side of the dashed rectangle) the direction of the chromospheric horizontal field is visibly incoherent because of the noisy inversion results produced by stray light on the umbral edges. This example shows how the results of a locally bad inversion can be easily spotted when considered in a larger and more reliable context.
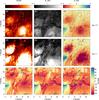 |
Fig. 7 Top row: total (a), transversal (b), and longitudinal (c) magnetic field in the chromosphere at log τ500 = −3. Middle row: total (d), transversal (e), and longitudinal (f) magnetic field in the photosphere at log τ500 = −1. Bottom row: inclination of the magnetic field at log τ500 = −1 (g), log τ500 = −2 (h), and log τ500 = −3 (i). 0 deg means horizontal magnetic field vector. The inclination in panel g is derived from the inversion of Fe i 6302 Å, while panels h and i are obtained from Ca ii 8542 Å inversions. The black contour in panel i indicates temperatures higher than 8 kK at log τ500 = −3. The blue arrows in panel i highlight the imprint of part of the jets. The two rectangles appearing in all the panels show the locations of the footpoints of the emerging loop structure. The numbers in panel a indicate the location of the Stokes profiles shown in Fig. 6. |
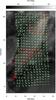 |
Fig. 8 Zoom of the inclination map in Fig. 7i. The red contour shows the same temperature contour as in Fig. 7i. The white arrows show the direction of the horizontal magnetic field in the chromosphere and the green arrows in the photosphere. The dashed rectangle highlights the region where there is a strong change of the horizontal field direction with height. The red dashed line is the vertical cut shown in the upper panels of Fig. 10. |
3.1.2. Temperature and pressure
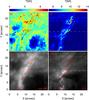 |
Fig. 9 Atmospheric temperature and AIA 1600 Å and Hα brightness in the emerging loop. a) Photospheric temperature map at log τ500 = −1 from the Fe i 6301–6302 Å inversion. b) Chromospheric temperature map at log τ500 = −3 from the Ca ii 8542 Å inversion. c) AIA 1600 Å intensity on a logarithmic brightness scale. d) Hα line-core intensity. The irregular contours enclose locations with T> 8 kK in the log τ500 = −3 map. The dotted and dashed horizontal lines are the cuts shown in Fig. 10. The green dotted line is the path shown in Fig. 13. |
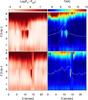 |
Fig. 10 Left: vertical cut of the ratio between the electron and gas pressure at Y = 12″ (a) and at Y = 20″ (c). Right: vertical cut of the temperature at Y = 12″ (b) and at Y = 20″ (d). The white solid curve is the Hα line-core intensity, the white dotted line the Ca ii 8542 Å core intensity, the red solid line the intensity curve for AIA 1600 Å, and the red dotted line the AIA 1700 Å intensity. The locations of the cuts are indicated in Fig. 9. |
Figure 9 shows the temperature maps retrieved by the inversion. The photospheric map (a) at log τ500 = −1 and the chromospheric map (b) at log τ500 = −3 are obtained from Fe i 6301–6302 Å and Ca ii 8542 Å, respectively. The contours in panels a, c, and d indicate the region of the chromospheric map where the temperature exceeds 8 kK at log τ500 = −3. The photospheric temperature map shows neither signs of strong heating nor of correlation with the temperature in the chromosphere. This is quite expected since no intensity enhancement is observed in Fig. 3a. In the chromosphere, the penumbra harbours hot patches at the location of the jet footpoints, as already shown in Fig. 7i. According to the Ca ii 8542 Å inversion results, these regions have temperatures up to 14 kK. A similar temperature pattern can be recognized in the co-aligned AIA 1600 intensity map (c). Two round brightenings at Y = 12″ and Y = 20″ coincide with the highest temperature patches in the chromospheric map. However, the bulk of the brightening of both AIA 1600 (c) and Hα (d) at Y = 12″ is not exactly cospatial with the hot patches retrieved from the inversion, but is instead located between the patches.
The right column of Fig. 10 shows the temperature cuts along Y = 12″ and Y = 20″ (long- and short-dashed lines, respectively, in Fig. 9). The increased temperature is very concentrated in height around log τ500 = −3 and has a horizontal extent less than 1″. The vertical cut at Y = 20″ shows similar behaviour in terms of height and size. In Fig. 10, we have plotted the intensity of the Hα line core (white solid line), Ca ii 8542 Å line core (white dotted line), AIA 1600 (red solid line), and AIA 1700 (red dashed line) along the two cuts. The four intensity curves are all normalized by their own maximum values and multiplied by a common scale factor to match the figure size.
At Y = 12″ (b), the location of the heating corresponds to an increase in the Hα intensity. The highest Hα intensity, however, is located between the two heated regions where the temperature estimated from Ca ii 8542 Å is almost 5 kK less. The AIA 1600 intensity curve is peaked at the same location. AIA 1700 shows a bump there, but it is less pronounced. This suggests that the Ca ii 8542 Å line could be blind to the possibly very high temperature between the two heating regions because Ca ii has been ionized away. Another hint for a hidden heating is that, as shown in Fig. 8, the direction of the magnetic field has a significant vertical gradient in the region between the two patches (between X = 8″ and X = 12″). One would therefore expect to see the sign of a possible field shear, but this is missing.
The region corresponding to the Y = 12″ cut appears in Ca ii 8542 Å as diffusely bright, and we do not observe a jump in its intensity curve as strong as in Hα on the left side. The abrupt drop of the Hα and Ca ii 8542 Å intensity curve on the right side is due to the presence of the opaque jets. This drop is shifted by ~1″ with respect to the hot region. A projection effect due to the difference in height between Ca ii 8542 Å and Hα can be excluded, however, because Ca ii 8542 Å does not look aligned with the heating.
The line core intensities of Hα in panel d have a spatially larger peak than the width of the heating region and its maximum value is 80% of the maximum along the Y = 12″ cut. Similar behaviour is shown also by Ca ii 8542 Å. Most of the area subtended by this peak has a low temperature (6–7 kK). The heating extent is better matched by the AIA 1600 curve and also by AIA 1700, which has a less intense jump than AIA 1600, as in panel b.
The left column of Fig. 10 shows the logarithm of the ratio between the electron and the gas pressure for the two vertical cuts considered so far. Here we see that at the same location where heating takes place the electron pressure increases to values comparable with the gas pressure, showing that the plasma is strongly ionized there. The biggest contribution to the electron pressure is given by hydrogen.
To evaluate the ionization of Ca ii we have computed the populations for each level of a five-level atom of Ca ii plus the Ca iii continuum using NICOLE. The fraction of all calcium in the form of Ca iii, as well as the temperature, are given as a function of height in Fig. 11 at three different pixels along the Y = 12″ cut. The first and the last panels coincide with the heating locations (X = 9″ and X = 12″). The locations with strong heating are located around log τ500 = −3. As expected, Ca ii is largely ionized away at these locations.
At the point between the two heating locations (X = 10.5″), the inversion predicts a low temperature, and a lower ionization of Ca ii is less ionized. As suggested by the strong 1600 Å emission compared to the 1700 Å emission, we interpret this low-temperature area as an artefact of the Ca ii-based inversion which is insensitive to temperatures well above 15 kK because the Ca ii is ionized away. In reality the temperature will be substantially higher than 15 kK in order to produce the 1600 Å emission.
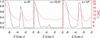 |
Fig. 11 Temperature (red) and the fraction of calcium as Ca iii (black) at three locations along the Y = 12″ cut of Fig. 10. Left: first heating region at X = 9″. Middle: low temperature region between the two heating regions at X = 10.5″. Right: second heating region at X = 12″. |
3.1.3. Velocity
Figure 12 shows the LOS velocity maps calibrated using as reference the velocity in the umbra (see Beckers 1977). As expected from the intensity in Fig. 3a, the photosphere (Fig. 12a) does not show any velocity pattern connected to the presence of the jet. The rectangles highlight the position of the loop-structure footpoints. In one of the footpoint of the loop structure (bottom), where the inclination is close to –80°, there is a downward LOS velocity of 4 km s-1 that can be connected to the plasma drain along the loop structure.
The upward and downward motion of the jets is retrieved in the chromospheric velocity map (Fig. 12b). The jets have LOS velocities of the order of 10–20 km s-1. An inspection of the time-length diagram, performed with the CRisp SPectral EXplorer (CRISPEX, Vissers & Rouppe van der Voort 2012) along different jet paths close to the one indicated in Fig. 7, shows that the jets have a plane-of-the-sky (POS) velocity between 100–200 km s-1. Due to the low time cadence (27 s), an estimate of the LOS velocity with the same approach is unfeasible. Comparing the LOS velocity obtained by inversion with the POS velocity, we find that the POS component dominates. This suggests that the jets on the investigated paths may actually follow an almost horizontal trajectory.
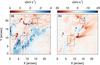 |
Fig. 12 Velocity map of a) the photopshere at log τ500 = −1 and b) the chromosphere at log τ500 = −3. The numbered diamonds indicate the locations of the selected Stokes profiles in Fig. 6. The two rectangles show the locations of the footpoints of the emerging loop structure. |
From the online animation of Fig. 3, it is clear that the jets not only have a vertical motion, but also a sideways motion. It is possible to observe a bright blob moving along the footpoint line (E-W direction). To estimate the transversal motion on the POS, we have selected 30 frames of AIA 1600. Figures 13a–f display six of these frames. The high-temperature moving blob can be more easily identified in the non-spatially-aligned AIA 1600 dataset, even though it has a lower spatial resolution than CRISP. The continuously tenuously bright structure in panels a-f is the jet footpoint line. Superimposed on it we observe an enhancement of intensity expanding on both sides of a ribbon-like structure, until it fades (e) and only two end points are left visible (f). This ribbon-like structure appears in the AIA 1600 channel, but not in Hα. A faint trace of the jets is visible in AIA 1600, especially in the animation of Fig. 4, and it moves coherently with the brightening, apparently at the same speed. The rightmost panel of Fig. 13 shows the space-time diagram traced along the green path of panel a. This path follows the motion of the blob and it has also been plotted in the CRISP-aligned image of Fig. 9c to easily frame its location. From the time-space diagram of the six different time steps, we can read that the blob – and with it the jets – moves along the footpoint line at almost 45 km s-1. This value will be useful in the comparison with other types of transversal motion and their production mechanisms.
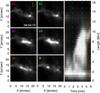 |
Fig. 13 Intensity maps and a space-time diagram of the jet footpoints in the AIA 1600 channel. Panels a–f show the maps at equidistant time intervals between 08:04:13 UT and 08:09:49 UT. The right column shows the space-time diagram along the path traced by the green dotted line in panel a. The times of the maps are indicated in by dashed colored lines. The green and the red arrows point towards the north and the disk centre, respectively. |
3.2. Time evolution
The smaller FOVs, selected for the complete time series inversion (Fig. 3d), contain the location where the magnetic reconnection is supposed to take place. Unfortunately, our observations only last for 66 min and they do not capture either the beginning or the end of the jets, which last for almost 4 h. Therefore, the picture that is retrieved by the time evolution is rather stable. The magnetic field does not show any clear periodicity and it has an almost constant value and direction. This stability can be seen in Figs. 14 and 15, which show the maps of some key quantities retrieved by the inversion of different time steps. We have decided to show the vertical magnetic field and the direction of the horizontal field at the beginning (first row), in the middle (middle row), and at the end of the time series (last row). The only clear change in the Bz map is due to the motion of the jets which appears in Fig. 15 as different branches of weak field between X = 3 and X = 6. The temperature in both the FOVs shows a constant pattern. As in the case of Bz, a variation of temperature can be found in the lower FOV (Fig. 15) close to the hotter regions due to the motion of the cold jets. In general, the location of the heating is constant throughout the entire time series between log τ500 = −2 and log τ500 = −3. In the XY plane the heating is confined in the same region outlined by the contour in Fig. 7.
The stable configuration that arises from inversion is in agreement with observations of a quasi-stationary phenomenon, but it is also surprising when compared with the fast motion of the brightenings at the jet footpoints (see Fig. 13). This may suggest a different origin or mechanism for the brightenings steadily located at the heating locations and those moving along the jet footpoints.
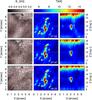 |
Fig. 14 Time evolution of the upper small field of view (see Fig. 3d). Left column: vertical magnetic field map and the red arrows are the direction of the horizontal field. Middle column: temperature map at log τ500 = −3. Right column: vertical cut of the temperature, the same cut as in Fig. 10. Every row corresponds to a different time step, the first row is the beginning of the observations, the second row the middle of the time series, and the last row the end of the observations. |
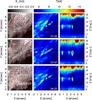 |
Fig. 15 Same as Fig. 14, but now showing the time evolution of the lower small field of view (see Fig. 3d). |
4. Discussion and conclusions
We have studied the atmosphere above a δ-sunspot that harbours a series of recurrent fan-shaped jets in its penumbra. We applied non-LTE inversion techniques to the spectropolarimetric data to retrieve chromospheric quantities and their photospheric counterparts.
The photospheric magnetic field map shows a secondary pair of polarities located in the penumbra shared by the main negative umbra and the two smaller spots. The scenario that we obtain is in agreement with an emerging magnetic loop structure in the penumbra of the sunspot. The footpoints of this structure are clearly visible in the photosphere (Fig. 7f) while the chromosphere shows the most horizontal part. The presence of a secondary bipolar structure has been simulated by Takasao et al. (2015), but the configuration that we have obtained is hard to reconcile with a single buoyant structure. Moreover, a downflow is expected between the second polarities, but the photospheric velocity panel of Fig. 12 proves it to be incorrect.
Magnetic reconnection between the emerging loop and the surrounding pre-existing penumbral field is likely to take place and produce the brightenings observed at the jet footpoints. This location corresponds to an increase in the temperature up to 14 kK at log τ500 = −3 and a strong increase in the electron pressure. Much of the plasma is ionized and also visible in AIA 1600 Å. We therefore conclude that the plasma temperature at certain locations in the chromosphere is higher than the value retrieved by the Ca ii inversion. The heating is confined between log τ500 = −2 and log τ500 = −3, which is rather deep in the chromosphere.
This result poses a new boundary on the height at which the magnetic reconnection takes place. Therefore, it would be interesting to reproduce these fan-shaped jets via MHD simulations, starting from the magnetic configuration that is shown in this paper. This would imply using a strong (>1 kG) and vertical field as a guide field, and the emergence of a horizontal weaker field. As in previous observations with similar topology (Robustini et al. 2016), the field that we obtain here does not show signs of twist. So, an obvious choice would be to recreate at the photosphere an untwisted or slightly twisted magnetic field, as simulated by Toriumi et al. (2015) for their light-bridge configuration.
To date, no model or simulation has been able to recreate the exact magnetic topology and the dynamics of these fan-shaped jets. In particular, the jets exhibit a sideways motion that is absent in the simulation of Jiang et al. (2011). The values that we have obtained here are of the order of magnitude of those found for anemone jets: 10−20 km s-1 from Shibata et al. (1992), 0−35 km s-1 from Savcheva et al. (2007), and ~10 km s-1 from Moreno-Insertis et al. (2008). This suggests that the mechanism behind this may be similar, and therefore that the sideways motion in the fan-shaped jets of this paper could be explained by the emergence of the loop structure and its reconnection. This mechanism has been shown by Moreno-Insertis et al. (2008) for the emergence of a dome structure.
While the magnetic field configuration at the jet footpoint appears clear, the jet bulk does not have a polarization signal. We have observed the imprint of the jet in some of those that are dark in Ca ii 8542 Å. The inclination that we have estimated from the magnetic field vector is almost horizontal. As we have already mentioned, the field value at this location is not reliable and consequently the direction of the jet is also not reliable. However, from the general context we can see that a horizontal inclination can be reconciled with the fact that the jet trajectories indeed lie in the direction of the coronal loop connecting the main polarities of the active region (see Fig. 2). Since the footpoints of the jets are located relatively low in the atmosphere compared to the top of the loop, it is reasonable to think that at chromospheric height the loop is rather stretched and almost horizontal.
Movies
Movie of Fig. 3 Access Supplementary Material
Movie of Fig. 4 Access Supplementary Material
Movie of Fig. 5 Access Supplementary Material
Acknowledgments
The Swedish 1m Solar Telescope is operated by the Institute for Solar Physics of Stockholm University in the Spanish Observatorio del Roque de los Muchachos of the Instituto de Astrofísica de Canarias. The computations were performed on resources provided by the Swedish National Infrastructure for Computing (SNIC) at the High Performance Computing Center North at Umeå University. J.d.l.C.R. is supported by grants from the Swedish Research Council (2015-03994), the Swedish National Space Board (128/15), and the Swedish Civil Contigencies Agency (MSB). This research was supported by the CHROMOBS and CHROMATIC grants of the Knut och Alice Wallenberg foundation.
References
- Asai, A., Ishii, T. T., & Kurokawa, H. 2001, ApJ, 555, L65 [NASA ADS] [CrossRef] [Google Scholar]
- Balthasar, H., Beck, C., Louis, R. E., Verma, M., & Denker, C. 2014, in Solar Polarization 7, eds. K. N. Nagendra, J. O. Stenflo, Q. Qu, & M. Samooprna, ASP Conf. Ser., 489, 39 [Google Scholar]
- Beckers, J. M. 1977, ApJ, 213, 900 [NASA ADS] [CrossRef] [Google Scholar]
- Carlsson, M., & Leenaarts, J. 2012, A&A, 539, A39 [NASA ADS] [CrossRef] [EDP Sciences] [Google Scholar]
- Cristaldi, A., Guglielmino, S. L., Zuccarello, F., et al. 2014, ApJ, 789, 162 [NASA ADS] [CrossRef] [Google Scholar]
- de la Cruz Rodríguez, J., & Piskunov, N. 2013, ApJ, 764, 33 [NASA ADS] [CrossRef] [Google Scholar]
- de la Cruz Rodríguez, J., Löfdahl, M. G., Sütterlin, P., Hillberg, T., & Rouppe van der Voort, L. 2015, A&A, 573, A40 [NASA ADS] [CrossRef] [EDP Sciences] [Google Scholar]
- Fang, F., & Fan, Y. 2015, ApJ, 806, 79 [NASA ADS] [CrossRef] [Google Scholar]
- Fontenla, J. M., Avrett, E. H., & Loeser, R. 1993, ApJ, 406, 319 [NASA ADS] [CrossRef] [Google Scholar]
- Fossum, A., & Carlsson, M. 2005, ApJ, 625, 556 [Google Scholar]
- Hou, Y. J., Li, T., Yang, S. H., & Zhang, J. 2016, A&A, 589, L7 [NASA ADS] [CrossRef] [EDP Sciences] [Google Scholar]
- Jaeggli, S. A. 2016, ApJ, 818, 81 [NASA ADS] [CrossRef] [Google Scholar]
- Janett, G., Carlin, E. S., Steiner, O., & Belluzzi, L. 2017, ApJ, 840, 107 [NASA ADS] [CrossRef] [Google Scholar]
- Jiang, R. L., Shibata, K., Isobe, H., & Fang, C. 2011, ApJ, 726, L16 [NASA ADS] [CrossRef] [Google Scholar]
- Künzel, H. 1960, Astron. Nachr., 285, 271 [NASA ADS] [CrossRef] [Google Scholar]
- Kurokawa, H., Wang, T., & Ishii, T. T. 2002, ApJ, 572, 598 [NASA ADS] [CrossRef] [Google Scholar]
- Lagg, A., Lites, B., Harvey, J., Gosain, S., & Centeno, R. 2017, Space Sci. Rev., 210, 37 [Google Scholar]
- Landolfi, M., & Landi Degl’Innocenti, E. 1982, Sol. Phys., 78, 355 [NASA ADS] [CrossRef] [Google Scholar]
- Leenaarts, J., de la Cruz Rodríguez, J., Kochukhov, O., & Carlsson, M. 2014, ApJ, 784, L17 [NASA ADS] [CrossRef] [Google Scholar]
- Leka, K. D., Barnes, G., & Crouch, A. 2014, Astrophysics Source Code Library [record ascl:1404.007] [Google Scholar]
- Lemen, J. R., Title, A. M., Akin, D. J., et al. 2012, Sol. Phys., 275, 17 [NASA ADS] [CrossRef] [Google Scholar]
- Li, Z., Fang, C., Guo, Y., et al. 2016, ApJ, 826, 217 [NASA ADS] [CrossRef] [Google Scholar]
- Louis, R. E. 2015, Adv. Space Res., 56, 2305 [NASA ADS] [CrossRef] [Google Scholar]
- Martinez Pillet, V., Lites, B. W., Skumanich, A., & Degenhardt, D. 1994, ApJ, 425, L113 [NASA ADS] [CrossRef] [Google Scholar]
- Metcalf, T. R. 1994, Sol. Phys., 155, 235 [Google Scholar]
- Metcalf, T. R., Leka, K. D., Barnes, G., et al. 2006, Sol. Phys., 237, 267 [Google Scholar]
- Moreno-Insertis, F., & Galsgaard, K. 2013, ApJ, 771, 20 [NASA ADS] [CrossRef] [Google Scholar]
- Moreno-Insertis, F., Galsgaard, K., & Ugarte-Urra, I. 2008, ApJ, 673, L211 [Google Scholar]
- Pesnell, W. D., Thompson, B. J., & Chamberlin, P. C. 2012, Sol. Phys., 275, 3 [NASA ADS] [CrossRef] [Google Scholar]
- Robustini, C., Leenaarts, J., de la Cruz Rodriguez, J., & Rouppe van der Voort, L. 2016, A&A, 590, A57 [NASA ADS] [CrossRef] [EDP Sciences] [Google Scholar]
- Roy, J.-R. 1973, Sol. Phys., 32, 139 [NASA ADS] [CrossRef] [Google Scholar]
- Rutten, R. J. 2016, A&A, 590, A124 [NASA ADS] [CrossRef] [EDP Sciences] [Google Scholar]
- Rutten, R. J. 2017, A&A, 598, A89 [NASA ADS] [CrossRef] [EDP Sciences] [Google Scholar]
- Sakurai, T., Makita, M., & Shibasaki, K. 1985, in Theoretical Problems in High Resolution Solar Physics Proc., ed. H. U. Schmidt, 313 [Google Scholar]
- Sammis, I., Tang, F., & Zirin, H. 2000, ApJ, 540, 583 [NASA ADS] [CrossRef] [Google Scholar]
- Sanchez Almeida, J. 1997, A&A, 324, 763 [NASA ADS] [Google Scholar]
- Savcheva, A., Cirtain, J., Deluca, E. E., et al. 2007, PASJ, 59, S771 [NASA ADS] [CrossRef] [Google Scholar]
- Scharmer, G. B., Bjelksjo, K., Korhonen, T. K., Lindberg, B., & Petterson, B. 2003, in Innovative Telescopes and Instrumentation for Solar Astrophysics, eds. S. L. Keil & S. V. Avakyan, Proc. SPIE, 4853, 341 [Google Scholar]
- Scharmer, G. B., Narayan, G., Hillberg, T., et al. 2008, ApJ, 689, L69 [NASA ADS] [CrossRef] [Google Scholar]
- Scherrer, P. H., Schou, J., Bush, R. I., et al. 2012, Sol. Phys., 275, 207 [Google Scholar]
- Shibata, K., Ishido, Y., Acton, L. W., et al. 1992, PASJ, 44, L173 [NASA ADS] [CrossRef] [Google Scholar]
- Shimizu, T., Katsukawa, Y., Kubo, M., et al. 2009, ApJ, 696, L66 [NASA ADS] [CrossRef] [Google Scholar]
- Socas-Navarro, H., de la Cruz Rodríguez, J., Asensio Ramos, A., Trujillo Bueno, J., & Ruiz Cobo, B. 2015, A&A, 577, A7 [NASA ADS] [CrossRef] [EDP Sciences] [Google Scholar]
- Solanki, S. K. 2003, A&ARv, 11, 153 [Google Scholar]
- Takasao, S., Fan, Y., Cheung, M. C. M., & Shibata, K. 2015, ApJ, 813, 112 [NASA ADS] [CrossRef] [Google Scholar]
- Tanaka, K. 1991, Sol. Phys., 136, 133 [NASA ADS] [CrossRef] [Google Scholar]
- Toriumi, S., Cheung, M. C. M., & Katsukawa, Y. 2015, ApJ, 811, 138 [NASA ADS] [CrossRef] [Google Scholar]
- van Noort, M., Rouppe van der Voort, L., & Löfdahl, M. G. 2005, Sol. Phys., 228, 191 [NASA ADS] [CrossRef] [Google Scholar]
- Vissers, G., & Rouppe van der Voort, L. 2012, ApJ, 750, 22 [NASA ADS] [CrossRef] [Google Scholar]
- Yang, S., Zhang, J., & Erdélyi, R. 2016, ApJ, 833, L18 [NASA ADS] [CrossRef] [Google Scholar]
- Zirin, H., & Liggett, M. A. 1987, Sol. Phys., 113, 267 [Google Scholar]
All Figures
|
Fig. 1 Time evolution of the LOS magnetic field (SDO/HMI) of a sunspot group located in the active region NOAA 11791. Positive flux emergence is highlighted by the blue arrows in panels c and e. The green and the red arrows point towards the north and the disk centre, respectively. |
| In the text | |
|
Fig. 2 AIA 171 image of the active region (AR) NOAA 11791. The square inset indicates the FOV of the SST observations (see Fig. 3), and shows the Hα line core at 08:10:50 UT. The blue arrow highlights the location of the fan-shaped jets. The green arrow points towards the north and the red arrow towards the disk centre. |
| In the text | |
|
Fig. 3 Sample of the dataset at 08:10:50 UT. a) Line core of Fe i 6302 Å; b) Hα blue wing at Δλ = −0.6 Å; c) Hα line core; and d) Ca ii 8542 Å line core. The orange box is the subfield chosen for the inversion of this time step. The smaller green boxes are the subfields for which the entire time series has been inverted. The numbered diamond symbols indicate the location of the selected Stokes profiles shown in Fig. 6. The green arrow points towards the north and the red arrow towards the disk centre. The temporal evolution can be found in a movie available online. In the middle of the time series, the field of view is shifted. |
| In the text | |
|
Fig. 4 Bright event at the jet footpoint at 07:24:32 UT. Panel a shows the blue wing of Hα at Δλ = −0.4 Å, panel b displays the line core of Ca ii 8542 Å. Panels c and d show the logarithm of the intensity in the AIA 1700 and 1600 Å channels, respectively. Panels e and f show the AIA EUV channels 171 and 335 Å. Panels c–f are spatially and temporally co-aligned to the CRISP dataset. The green arrow points towards the north and the red arrow towards the disk centre. The temporal evolution can be found in a movie available online. |
| In the text | |
|
Fig. 5 Same as Fig. 4, but at 08:10:50 UT and c) and d) have a linear brightness scale instead of a logarithmic scale. The temporal evolution can be found in a movie available online. |
| In the text | |
|
Fig. 6 Examples of typical Stokes profiles in the Ca ii 8542 Å line. The locations of the profiles are indicated in Figs. 3d and 7. The black and red curves represent the observed profiles and their fits, respectively. A description of the characteristics of each point is given in the text. |
| In the text | |
|
Fig. 7 Top row: total (a), transversal (b), and longitudinal (c) magnetic field in the chromosphere at log τ500 = −3. Middle row: total (d), transversal (e), and longitudinal (f) magnetic field in the photosphere at log τ500 = −1. Bottom row: inclination of the magnetic field at log τ500 = −1 (g), log τ500 = −2 (h), and log τ500 = −3 (i). 0 deg means horizontal magnetic field vector. The inclination in panel g is derived from the inversion of Fe i 6302 Å, while panels h and i are obtained from Ca ii 8542 Å inversions. The black contour in panel i indicates temperatures higher than 8 kK at log τ500 = −3. The blue arrows in panel i highlight the imprint of part of the jets. The two rectangles appearing in all the panels show the locations of the footpoints of the emerging loop structure. The numbers in panel a indicate the location of the Stokes profiles shown in Fig. 6. |
| In the text | |
|
Fig. 8 Zoom of the inclination map in Fig. 7i. The red contour shows the same temperature contour as in Fig. 7i. The white arrows show the direction of the horizontal magnetic field in the chromosphere and the green arrows in the photosphere. The dashed rectangle highlights the region where there is a strong change of the horizontal field direction with height. The red dashed line is the vertical cut shown in the upper panels of Fig. 10. |
| In the text | |
|
Fig. 9 Atmospheric temperature and AIA 1600 Å and Hα brightness in the emerging loop. a) Photospheric temperature map at log τ500 = −1 from the Fe i 6301–6302 Å inversion. b) Chromospheric temperature map at log τ500 = −3 from the Ca ii 8542 Å inversion. c) AIA 1600 Å intensity on a logarithmic brightness scale. d) Hα line-core intensity. The irregular contours enclose locations with T> 8 kK in the log τ500 = −3 map. The dotted and dashed horizontal lines are the cuts shown in Fig. 10. The green dotted line is the path shown in Fig. 13. |
| In the text | |
|
Fig. 10 Left: vertical cut of the ratio between the electron and gas pressure at Y = 12″ (a) and at Y = 20″ (c). Right: vertical cut of the temperature at Y = 12″ (b) and at Y = 20″ (d). The white solid curve is the Hα line-core intensity, the white dotted line the Ca ii 8542 Å core intensity, the red solid line the intensity curve for AIA 1600 Å, and the red dotted line the AIA 1700 Å intensity. The locations of the cuts are indicated in Fig. 9. |
| In the text | |
|
Fig. 11 Temperature (red) and the fraction of calcium as Ca iii (black) at three locations along the Y = 12″ cut of Fig. 10. Left: first heating region at X = 9″. Middle: low temperature region between the two heating regions at X = 10.5″. Right: second heating region at X = 12″. |
| In the text | |
|
Fig. 12 Velocity map of a) the photopshere at log τ500 = −1 and b) the chromosphere at log τ500 = −3. The numbered diamonds indicate the locations of the selected Stokes profiles in Fig. 6. The two rectangles show the locations of the footpoints of the emerging loop structure. |
| In the text | |
|
Fig. 13 Intensity maps and a space-time diagram of the jet footpoints in the AIA 1600 channel. Panels a–f show the maps at equidistant time intervals between 08:04:13 UT and 08:09:49 UT. The right column shows the space-time diagram along the path traced by the green dotted line in panel a. The times of the maps are indicated in by dashed colored lines. The green and the red arrows point towards the north and the disk centre, respectively. |
| In the text | |
|
Fig. 14 Time evolution of the upper small field of view (see Fig. 3d). Left column: vertical magnetic field map and the red arrows are the direction of the horizontal field. Middle column: temperature map at log τ500 = −3. Right column: vertical cut of the temperature, the same cut as in Fig. 10. Every row corresponds to a different time step, the first row is the beginning of the observations, the second row the middle of the time series, and the last row the end of the observations. |
| In the text | |
|
Fig. 15 Same as Fig. 14, but now showing the time evolution of the lower small field of view (see Fig. 3d). |
| In the text | |
Current usage metrics show cumulative count of Article Views (full-text article views including HTML views, PDF and ePub downloads, according to the available data) and Abstracts Views on Vision4Press platform.
Data correspond to usage on the plateform after 2015. The current usage metrics is available 48-96 hours after online publication and is updated daily on week days.
Initial download of the metrics may take a while.