Fig. 10
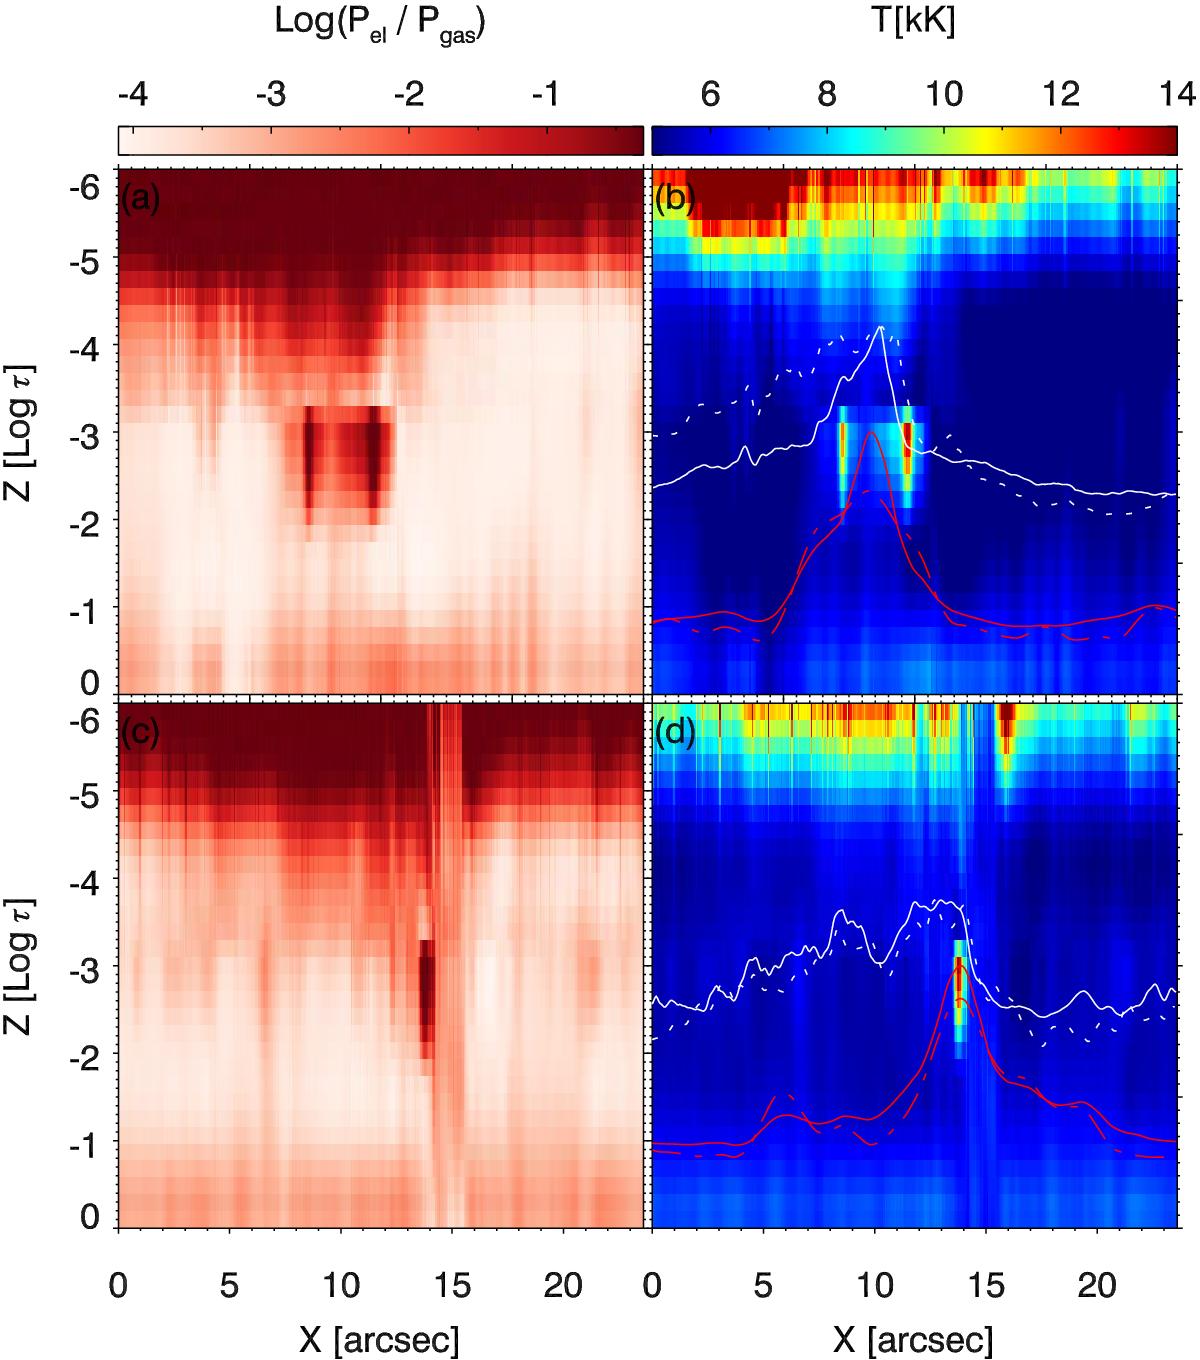
Left: vertical cut of the ratio between the electron and gas pressure at Y = 12″ (a) and at Y = 20″ (c). Right: vertical cut of the temperature at Y = 12″ (b) and at Y = 20″ (d). The white solid curve is the Hα line-core intensity, the white dotted line the Ca ii 8542 Å core intensity, the red solid line the intensity curve for AIA 1600 Å, and the red dotted line the AIA 1700 Å intensity. The locations of the cuts are indicated in Fig. 9.
Current usage metrics show cumulative count of Article Views (full-text article views including HTML views, PDF and ePub downloads, according to the available data) and Abstracts Views on Vision4Press platform.
Data correspond to usage on the plateform after 2015. The current usage metrics is available 48-96 hours after online publication and is updated daily on week days.
Initial download of the metrics may take a while.