Free Access
Fig. 11
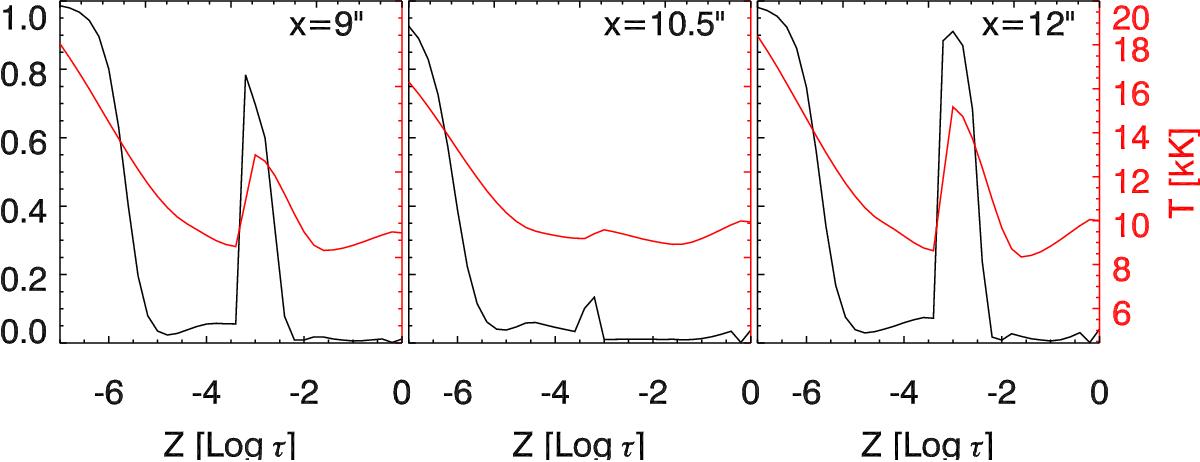
Temperature (red) and the fraction of calcium as Ca iii (black) at three locations along the Y = 12″ cut of Fig. 10. Left: first heating region at X = 9″. Middle: low temperature region between the two heating regions at X = 10.5″. Right: second heating region at X = 12″.
Current usage metrics show cumulative count of Article Views (full-text article views including HTML views, PDF and ePub downloads, according to the available data) and Abstracts Views on Vision4Press platform.
Data correspond to usage on the plateform after 2015. The current usage metrics is available 48-96 hours after online publication and is updated daily on week days.
Initial download of the metrics may take a while.