Fig. 13
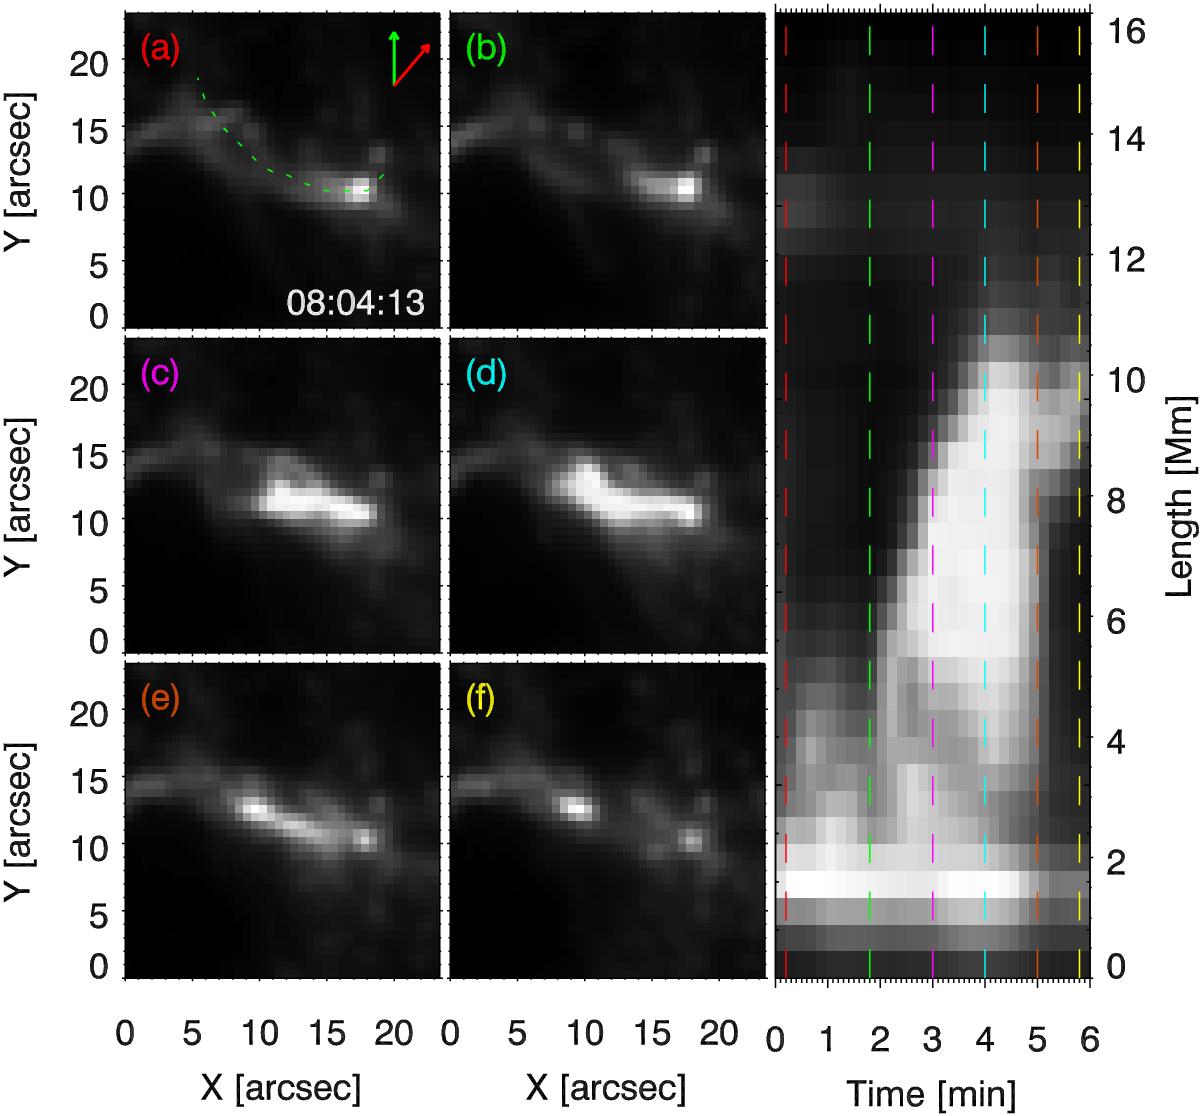
Intensity maps and a space-time diagram of the jet footpoints in the AIA 1600 channel. Panels a–f show the maps at equidistant time intervals between 08:04:13 UT and 08:09:49 UT. The right column shows the space-time diagram along the path traced by the green dotted line in panel a. The times of the maps are indicated in by dashed colored lines. The green and the red arrows point towards the north and the disk centre, respectively.
Current usage metrics show cumulative count of Article Views (full-text article views including HTML views, PDF and ePub downloads, according to the available data) and Abstracts Views on Vision4Press platform.
Data correspond to usage on the plateform after 2015. The current usage metrics is available 48-96 hours after online publication and is updated daily on week days.
Initial download of the metrics may take a while.