Free Access
Fig. 12
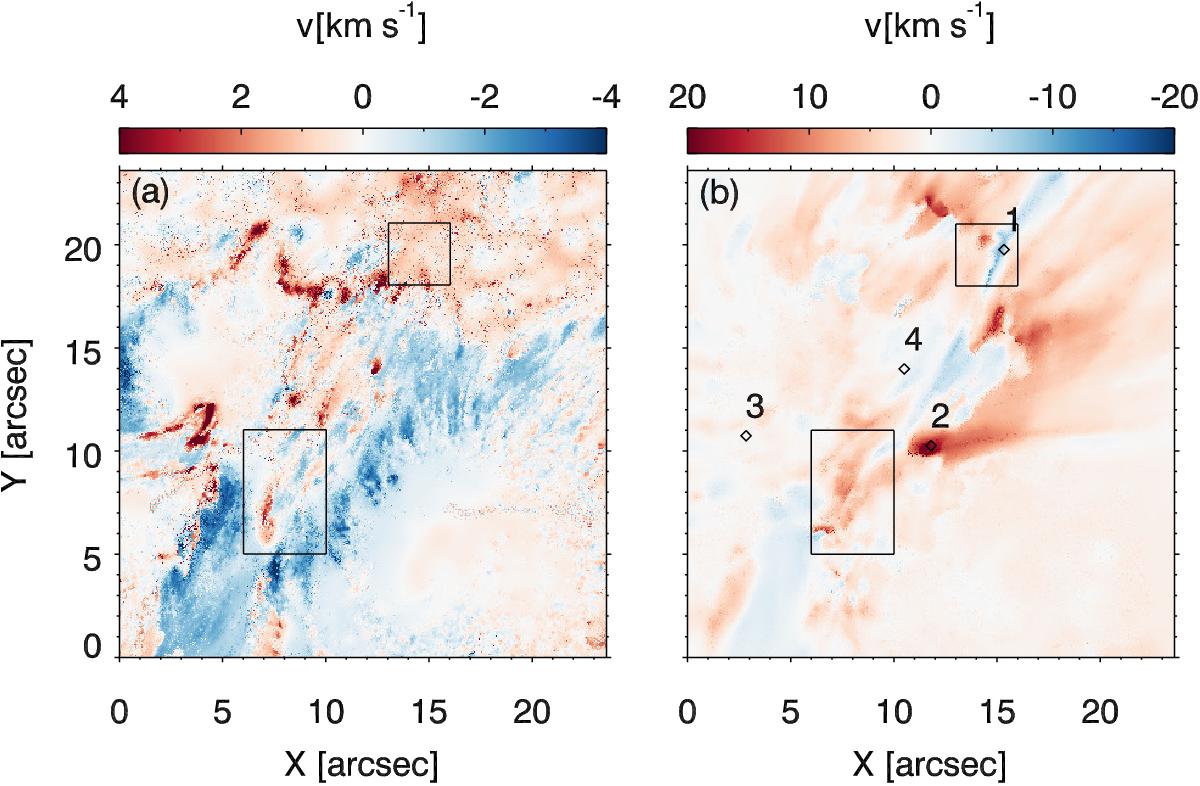
Velocity map of a) the photopshere at log τ500 = −1 and b) the chromosphere at log τ500 = −3. The numbered diamonds indicate the locations of the selected Stokes profiles in Fig. 6. The two rectangles show the locations of the footpoints of the emerging loop structure.
Current usage metrics show cumulative count of Article Views (full-text article views including HTML views, PDF and ePub downloads, according to the available data) and Abstracts Views on Vision4Press platform.
Data correspond to usage on the plateform after 2015. The current usage metrics is available 48-96 hours after online publication and is updated daily on week days.
Initial download of the metrics may take a while.