Fig. 8
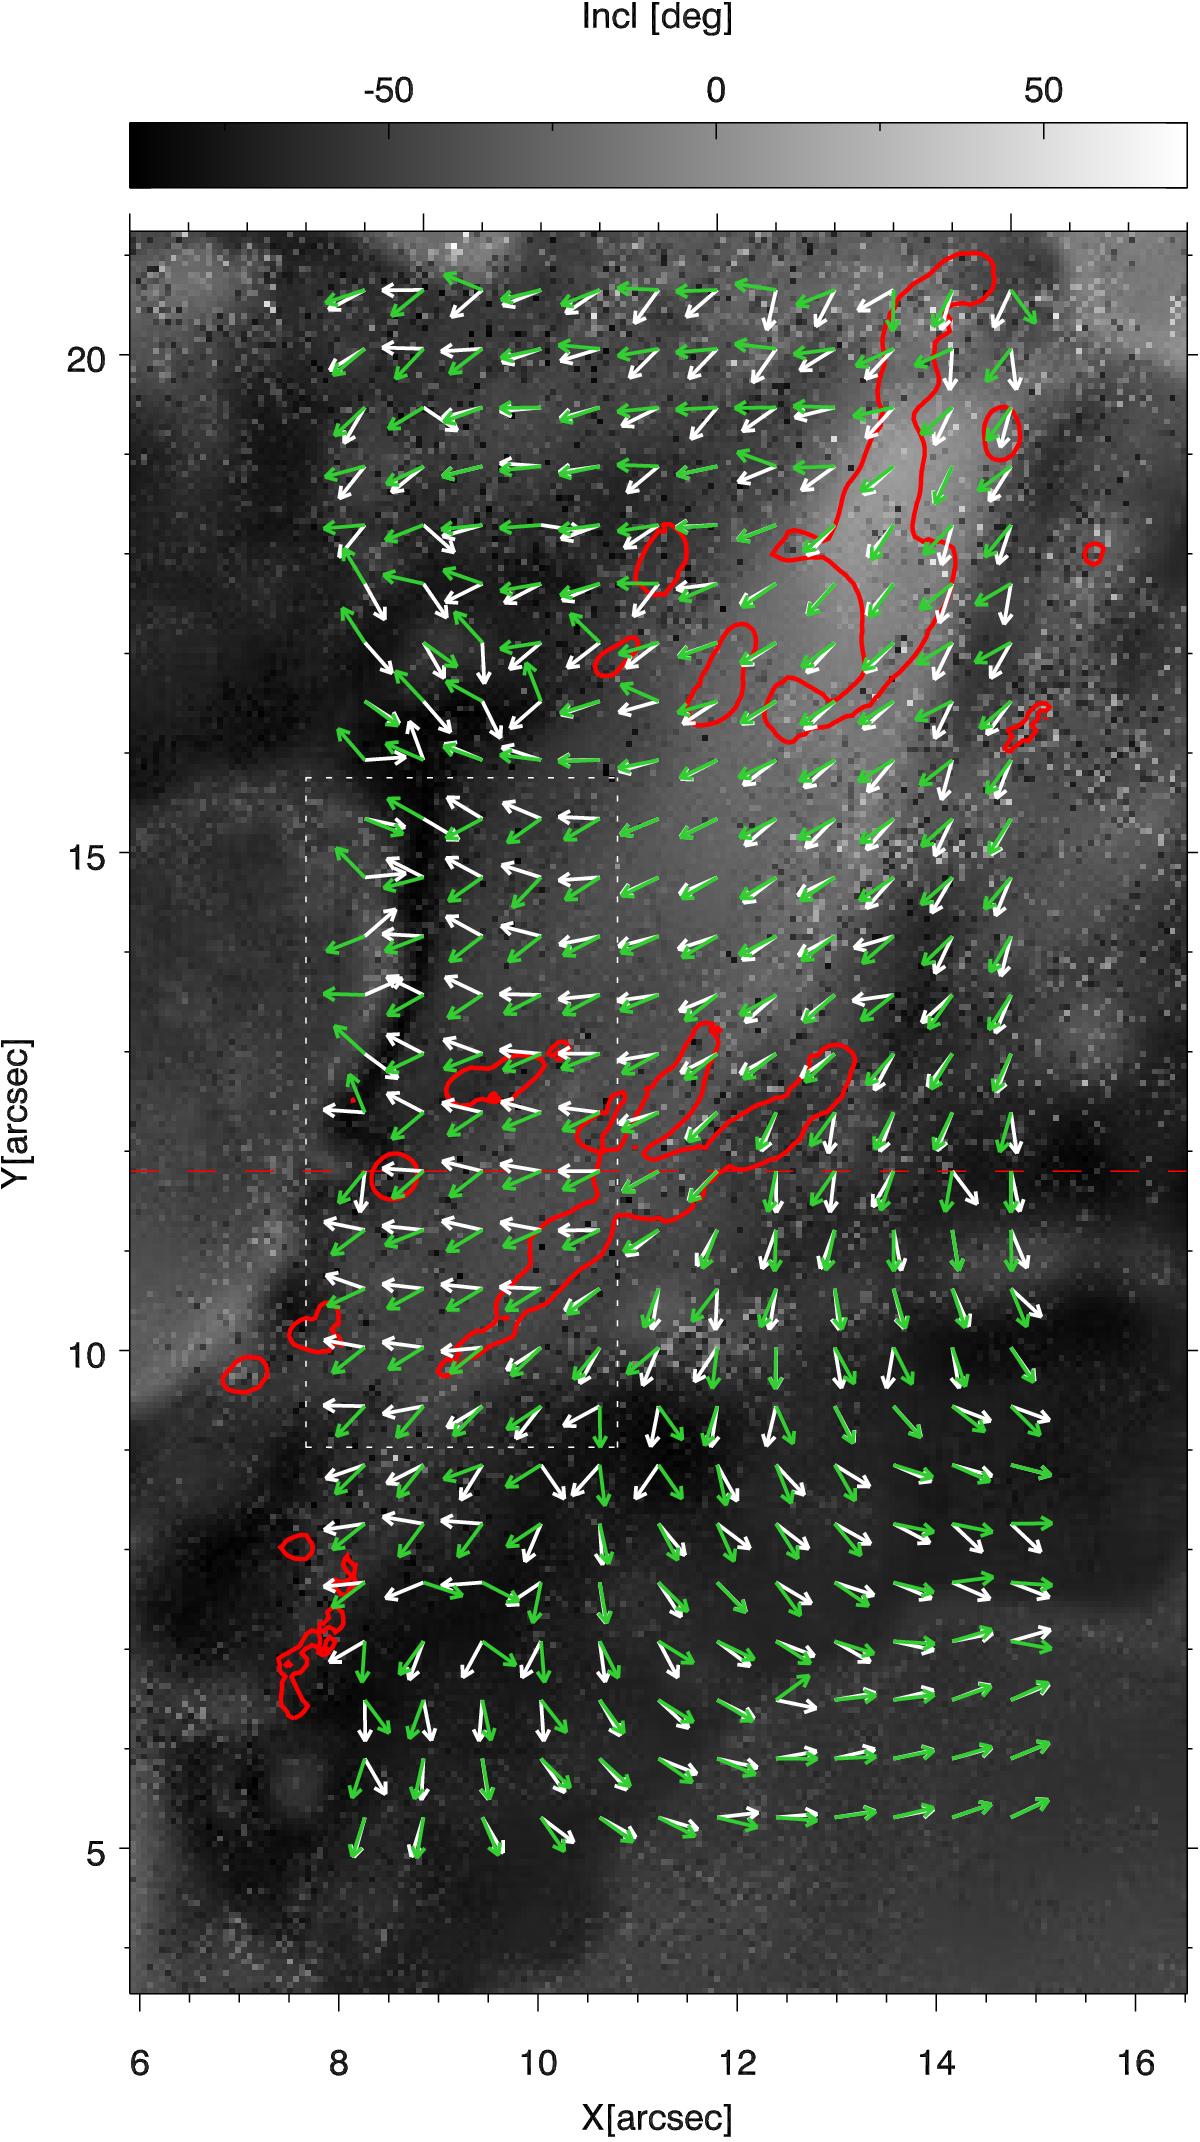
Zoom of the inclination map in Fig. 7i. The red contour shows the same temperature contour as in Fig. 7i. The white arrows show the direction of the horizontal magnetic field in the chromosphere and the green arrows in the photosphere. The dashed rectangle highlights the region where there is a strong change of the horizontal field direction with height. The red dashed line is the vertical cut shown in the upper panels of Fig. 10.
Current usage metrics show cumulative count of Article Views (full-text article views including HTML views, PDF and ePub downloads, according to the available data) and Abstracts Views on Vision4Press platform.
Data correspond to usage on the plateform after 2015. The current usage metrics is available 48-96 hours after online publication and is updated daily on week days.
Initial download of the metrics may take a while.