Fig. 7
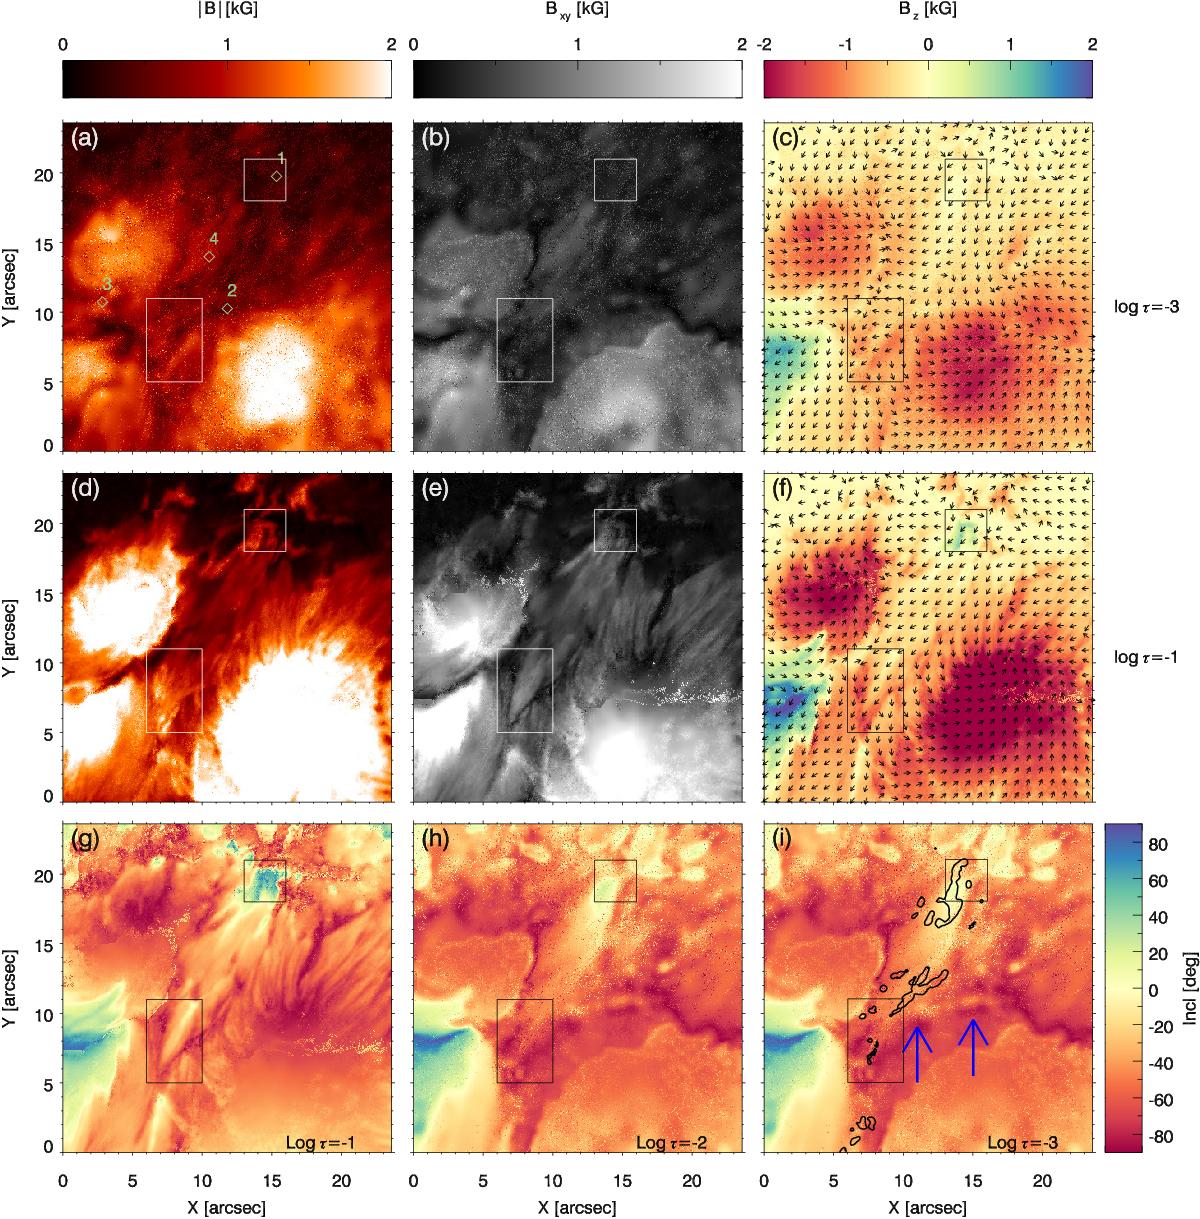
Top row: total (a), transversal (b), and longitudinal (c) magnetic field in the chromosphere at log τ500 = −3. Middle row: total (d), transversal (e), and longitudinal (f) magnetic field in the photosphere at log τ500 = −1. Bottom row: inclination of the magnetic field at log τ500 = −1 (g), log τ500 = −2 (h), and log τ500 = −3 (i). 0 deg means horizontal magnetic field vector. The inclination in panel g is derived from the inversion of Fe i 6302 Å, while panels h and i are obtained from Ca ii 8542 Å inversions. The black contour in panel i indicates temperatures higher than 8 kK at log τ500 = −3. The blue arrows in panel i highlight the imprint of part of the jets. The two rectangles appearing in all the panels show the locations of the footpoints of the emerging loop structure. The numbers in panel a indicate the location of the Stokes profiles shown in Fig. 6.
Current usage metrics show cumulative count of Article Views (full-text article views including HTML views, PDF and ePub downloads, according to the available data) and Abstracts Views on Vision4Press platform.
Data correspond to usage on the plateform after 2015. The current usage metrics is available 48-96 hours after online publication and is updated daily on week days.
Initial download of the metrics may take a while.