| Issue |
A&A
Volume 604, August 2017
|
|
|---|---|---|
| Article Number | A69 | |
| Number of page(s) | 23 | |
| Section | Interstellar and circumstellar matter | |
| DOI | https://doi.org/10.1051/0004-6361/201629404 | |
| Published online | 08 August 2017 | |
Herschel survey and modelling of externally-illuminated photoevaporating protoplanetary disks⋆,⋆⋆
1 Université de Toulouse, UPS-OMP, IRAP, 31000 Toulouse, France
e-mail: This email address is being protected from spambots. You need JavaScript enabled to view it.
2 CNRS, IRAP, 9 Av. Colonel Roche, BP 44346, 31028 Toulouse Cedex 4, France
3 Kapteyn Astronomical Institute, University of Groningen, Postbus 800, 9700 AV Groningen, The Netherlands
4 Institute of Astrophysics and Space Sciences (IA), Tapada da Ajuda – Edificio Leste – 2° Piso, 1349-018 Lisboa, Portugal
5 LERMA, Observatoire de Paris, PSL Research University, CNRS, UMR8112, 92190 Meudon, France
6 LERMA, Observatoire de Paris, École normale supérieure, PSL Research University, CNRS, Sorbonne Universités, UPMC Univ. Paris 06, 75231 Paris, France
7 Grupo de Astrofisica Molecular, Instituto de Ciencia de Materiales de Madrid (CSIC), 28049 Madrid, Spain
Received: 26 July 2016
Accepted: 23 January 2017
Abstract
Context. Protoplanetary disks undergo substantial mass-loss by photoevaporation, a mechanism that is crucial to their dynamical evolution. However, the processes regulating the gas energetics have not so far been well constrained by observations.
Aims. We aim to study the processes involved in disk photoevaporation when it is driven by far-UV photons (i.e. 6 < E < 13.6 eV).
Methods. We present a unique Herschel survey and new ALMA observations of four externally-illuminated photoevaporating disks (a.k.a. proplyds). To analyse these data, we developed a 1D model of the photodissociation region (PDR) of a proplyd, based on the Meudon PDR code. Using this model, we computed the far infrared line emission.
Results. With this model, we successfully reproduce most of the observations and derive key physical parameters, that is, the densities at the disk surface of about 106 cm-3 and local gas temperatures of about 1000 K. Our modelling suggests that all studied disks are found in a transitional regime resulting from the interplay between several heating and cooling processes that we identify. These differ from those dominating in classical PDRs, meaning the grain photo-electric effect and cooling by [OI] and [CII] FIR lines. This specific energetic regime is associated to an equilibrium dynamical point of the photoevaporation flow: the mass-loss rate is self-regulated to keep the envelope column density at a value that maintains the temperature at the disk surface around 1000 K. From the physical parameters derived from our best-fit models, we estimate mass-loss rates – of the order of 10-7M⊙/yr – that are in agreement with earlier spectroscopic observation of ionised gas tracers. This holds only if we assume photoevaporation in the supercritical regime where the evaporation flow is launched from the disk surface at sound speed.
Conclusions. We have identified the energetic regime regulating FUV-photoevaporation in proplyds. This regime could be implemented into models of the dynamical evolution of protoplanetary disks.
Key words: protoplanetary disks / methods: numerical / infrared: planetary systems / photon-dominated region / methods: observational
Herschel is an ESA space observatory with science instruments provided by European-led Principal Investigator consortia and with important participation from NASA.
Tables of observational data are only available at the CDS via anonymous ftp to cdsarc.u-strasbg.fr (130.79.128.5) or via http://cdsarc.u-strasbg.fr/viz-bin/qcat?J/A+A/604/A69
© ESO, 2017
1. Introduction
Protoplanetary disks are found around young stars as a natural consequence of angular momentum conservation in a rotating collapsing core. Over the course of a few million years (Zuckerman et al. 1995; Haisch et al. 2001), they are the reservoirs of dust and gas for the formation and the growth of planets. After this relatively short time, only a small fraction of the disk initial mass remains in the form of planets. The majority of the mass is supposed to have been accreted onto the central star or physically removed from the disk. One proposed mechanism for this is photoevaporation (see recent reviews in e.g. Alexander et al. 2014; Gorti et al. 2015). Indeed, disks are subject to highly energetic photons that can sufficiently heat the gas at the disk surface to make it overcomes the gravitational field leading to escape flows and mass-loss.
General properties of the studied proplyds.
Photoevaporation of disks caused by extreme-UV photons (or EUV, 13.6 eV <hν< 0.1 keV) arising from the central star was first studied by Hollenbach et al. (1994), Yorke & Welz (1996), Richling & Yorke (1997), Clarke et al. (2001) who showed that it can create a gap in the inner part of the disk and erodes it. Gorti & Hollenbach (2009) have investigated the case of far-UV (or FUV, 6 eV <hν< 13.6 keV) photons and found that they can cause significant erosion since they can remove the gas from the outer disk where most of the mass is located. Photoevaporation of disks caused by EUV and FUV photons from nearby massive stars has also been analytically and numerically modelled (Johnstone et al. 1998; Richling & Yorke 1998, 2000; Störzer & Hollenbach 1999), in order to understand the morphology and evolution of externally illuminated disks, also known as proplyds (O’dell et al. 1993). These latters generally appear as disks surrounded by a teardrop-shaped ionised envelope with a bright head facing the main UV source and an elongated tail pointing away from the source.
After the work of Johnstone et al. Johnstone et al. (1998) and Störzer & Hollenbach (1998, 1999), and supported by observations (e.g. Bally et al. 1998; Chen et al. 1998), it was suggested that FUV photons penetrate the disk, dissociate molecules and heat the gas to temperatures of about 102 to 103 K, thus launching a thermal wind at the disk surface. EUV photons cannot penetrate this flow but ionise the gas on its surface and raise its temperature to 104 K. The ionisation front, delimiting the flow that feeds the envelope of the proplyd, is generally located at several disk radii.
Regions where a strong FUV radiation field drives the physics and chemistry are called photodissociation regions (PDRs). All of the previously cited models of photoevaporation that include FUV photons are based on PDR models. Tielens & Hollenbach (1985) have developed the first general model describing PDRs for a dense molecular cloud illuminated by a strong FUV radiation field with an intensity G0 between 103 and 106 times the Habing field (Habing 1968), which corresponds to the average FUV flux in the interstellar medium and is valued at 1.6 × 10⁻⁶ W m-2 when integrated between 91.2 and 240 nm. To compute the structure and emission of the cloud, the model includes the main heating mechanisms such as the photoelectric effect, carbon ionisation, H2 dissociation and the main cooling mechanisms by few fine-structure lines of atoms and low-lying rotational lines from molecules for example. Thanks to PDR modelling, Störzer & Hollenbach (1999) have been able to reproduce the observed intensity of H2 (ν = 1−0) S(1) and make predictions for the major gas cooling lines in the far-infrared ([OI], [CII], etc.). However so far, these FIR lines have never been observed towards proplyds. Walsh et al. (2013) modelled the molecular line emission from a protoplanetary disk illuminated by an external radiation field G0 = 4 × 10⁵. Facchini et al. (2016) recently published a study in which they use a 3D PDR model to compute the temperature at the surface of an externally illuminated disk. Their study is mainly concerned with disks situated in regions of moderate UV fields (up to G0 = 3000). Those authors also do not compare these models with observations, as they are mostly interested in modelling dynamics.
We conducted the first and unique far-IR (FIR) survey of proplyds with the Herschel Space Observatory. The Herschel data were combined with multi-wavelength observations (optical to sub-mm) available in the literature and analysed in the frame of a PDR model specially developed for this case. In this paper we address the following questions: firstly, can the FIR emission of proplyds be modelled as a PDR? Secondly, what are the physical properties of this PDR (density, temperature)? Finally, what are the key mechanisms driving the thermal balance (heating and cooling processes) and hence the photoevaporation?
 |
Fig. 1 14″ × 14″ Hα images of the observed proplyds from HST/WFPC2/F656N or WFC/F658N. Overlaid are the dimensions of one spaxel of PACS (red square of 9.4″ × 9.4″) and the minimal FWHM of HIFI (green circle with a diameter of 11.3″) for the ones observed with Herschel. The ALMA beam of 0.99″ × 0.97″ is represented for 203-506. |
We start by introducing the observations (Sect. 2) and the model (Sect. 3). We then confront them to extract the physical properties of the studied objects (Sect. 4) and use the model to investigate the main mechanisms driving the disk surface properties (Sect. 5) and the consequences on photoevaporation and mass-loss rates (Sect. 6). Section 7 contains our concluding remarks.
Observing strategy for Herschel spectroscopy.
2. Observations
2.1. Herschel survey
Although it is well established that FUV photons play a key role in the gas heating in PDRs, there is no quantitative study of classical PDR tracers in proplyds so far, mostly due to their small sizes and strong background emission. Since these tracers are mostly found at far-IR wavelengths, and hence have to be observed from space, the ESA Herschel Space Observatory (Pilbratt et al. 2010) was the first to provide sufficient sensitivity and resolution to observe them.
2.1.1. Targets
To maximise the signal-to-noise ratio for the first survey of this kind, we have carefully selected three proplyds (see Table 1 but note that 203-506 will be presented later) according to their relatively large size (several arcseconds in diameter) and their strong incoming FUV radiation field (G0> 104). These targets are briefly described in the following paragraphs.
One of the giant proplyd candidates of Smith et al. (2003) in the Carina nebula (Fig. 1a), namely 104632.9-600354 in their paper and hereafter called 105-600 following Mesa-Delgado et al. (2016). It is located amongst the southern pillars at a projected distance of 25.4 arcmins south-east from η Carinae and at 1 arcmin from the Bochum 11 cluster to the west. It was first studied by Vicente (2009) and has been observed with HST/ACS in Hα emission (Smith et al. 2010a), revealing a large envelope pointing towards η Carinae and a collimated bipolar jet that confirms the pre-stellar nature of this object. The large size of this object as well as its high molecular content (M ≈ 0.35 M⊙, after Sahai et al. 2012) could suggest that the young stellar object is still embedded in the remnant molecular core while the morphology is similar to a proplyd. From this point forward, we will consider that the molecular core inside the object is a disk since the true nature is not important for our study.
HST10 (also known as 182-413, Fig. 1b) is the most studied proplyd and was one of the first bright objects in which an embedded disk was seen in silhouette (e.g. O’dell et al. 1993; O’dell & Wong 1996) and in emission through the [OI] 6300 Å and H2 (1-0) S(1) lines (Bally et al. 1998, 2000; Chen et al. 1998). It is located at a projected distance of 56′′ from the star Θ1 Ori C to the SE, and at 32.6′′ from Θ2 Ori A to the NW. It is a teardrop-shaped proplyd containing a prominent nearly edge-on disk.
244-440 (Fig. 1c) is the largest proplyd observed in the Orion nebula cluster. It exhibits a faint nearly edge-on silhouette disk (Vicente & Alves 2005) and a one-sided microjet drived by the central star (Bally et al. 2000). It is located at a projected distance of 142′′ from the star Θ1 Ori C and at 29′′ from Θ2 Ori A.
2.1.2. Observing strategy and data reduction
The main concern about observations of proplyds is that they are small objects so their emission is likely to be diluted in the Herschel beam (Fig. 1), and their emission can also be confused with emission from the nebula where they lie. Since the PDR density of proplyds is expected to be high at some locations, especially at the disk surface (about 106 cm-3), some PDR tracers such as the [OI] 63 μm and the high-J CO lines (J = 15−14, 17–16 and 19–18) are expected to be bright compared to background nebular emission (which has a lower density) and we thus proposed to observe them with PACS (Poglitsch et al. 2010). With HIFI (de Graauw et al. 2010), the [CII] 158 μm line and fainter lower J CO lines (J = 7−6 and 10–9) were observed assuming that the proplyd emission can be spectrally separated from background/foreground nebular emission with a velocity resolution of 190 m s-1 or less. Thanks to these two instruments, we were able to observe for the first time in proplyds selected excited CO lines spanning a wide range of densities (critical densities from 105 to 107 cm-3, see e.g. Yang et al. 2010), and the [OI] 63 μm and [CII] 158 μm fine-structure lines (critical densities from about 103 to 105 cm-3) which are generally the two major cooling lines in PDRs (Tielens & Hollenbach 1985).
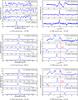 |
Fig. 2 Level-2 calibrated spectra for the three targets: 105-600, HST10 and 244-440 respectively from top to bottom. Spectrally unresolved lines observed with PACS are presented on the left and resolved lines observed with HIFI lied on the right. The red vertical bars on HIFI spectra indicate the vLSR of the objects. |
From one object or one line to another, different observing modes have been used to avoid contamination by the background emission (see Table 2). For HIFI, the mode Dual Beam Switch uses an OFF position (i.e. away from the source) on the sky if a nearby emission-free zone is expected, as for 105-600 mainly. If there is no such zone, the Load Chop mode allows to use internal loads as references and the mode Frequency Switch make its reference by switching between two frequencies in the local oscillator. In a similar way with PACS, we use the Standard Chopping-nodding mode for 105-600 assuming a vicinity free of emission while the Unchopped grating scan mode was used for the Orion proplyds that enables to go farther away from the nebula to find a clean OFF position
Features of the observed lines (Herschel plus published/archival data available).
The data reduction and parts of post-processing were done using the Herschel Interactive Processing Environment (HIPE version 13, see Ott 2010) in order to obtain level-2 calibrated spectra (Fig. 2). Line profiles were then fitted using Gaussian functions to extract the line integrated intensities and other characteristics such as the full width at half maximum (FWHM) and the velocity with respect to the local standard-of-rest, vLSR (see Table 3). Uncertainties have been calculated by quadratically summing the instrumental (see user manuals of the instruments for more details) and fitting uncertainties.
2.1.3. Observing results
Figure 2 shows the spectra extracted from the Herschel data. A summary of all detected lines and upper limits is given in Table 3. For the Carina candidate proplyd, 105-600, PACS spectra are not contaminated by the surrounding nebula so that the target emission is directly observed (Fig. 2a). The [OI] 63 μm line is clearly visible while the sensitivity of the instrument allows the detection, at the limit, of the CO (15-14) and CO (17-16) lines (with peaks at about 3–4σ) but is insufficient to detect the CO (19-18) line. Estimation of the integrated intensities, or their upper limits, can be obtained with reasonable uncertainties (about 24%, see Table 3) since the theoretical FWHM of the lines, related to instrumental characteristics, are known. Emission lines observed by HIFI are well spectrally resolved and with high signal-to-noise ratios (Fig. 2b). However, the observing mode chosen for the [CII] 158 μm line has caused a contamination from the background emission of the HII region. The strategy to remove this contamination and extract the [CII] 158 μm line flux is detailed in Appendix A.
In the case of the two Orion proplyds observed with Herschel (HST10 and 244-440), the low-resolution spectroscopy obtained by PACS (Figs. 2c and e) is highly contaminated by the nebula so that the observed emissions mainly come from the background and not from the targets. Only upper limits of the target emission can thus be extracted for the CO (15-14), CO (17-16), CO (19-18) and [OI] 63 μm lines. The high-resolution spectroscopy provided by HIFI enables to spectrally resolve the emission of the Orion proplyds and the emission from the nebula. This is clearly visible with the [CII] 158 μm fine-structure line, on Figs. 2d and f, where the targets emission lines are detected at a vLSR about 21–22 km s-1 and located on the wing of the nebula emission line that peaks close to a vLSR of 10 km s-1. Unfortunately, the velocities of the Orion proplyds shift the [CII] lines at the same frequency of the strongest [13CII] line from the nebula (Goicoechea et al. 2015). Here again, only upper limits can thus be extracted. For HST10, the maximum brightness of the [CII] 158 μm line, after correcting the beam dilution, is 4.72 × 10⁻⁶ W m-2 sr-1 which is the same order of magnitude as the one predicted by Störzer & Hollenbach (1999) who probably overestimated it. At low velocities, several emission lines are observed: three components close to a vLSR of 0 km s-1 and one located about −15 km s-1. Those lines likely correspond to the emission of the 12C+ from the Veil in front of the nebula seen in HI emission and absorption at those velocities (van der Werf et al. 2013). The line at a vLSR about 70–75 km s-1 is another 13C+ line from the nebula (Ossenkopf et al. 2013). Even with the high spectral resolution of HIFI, no emission from HST10 and 244-440 is visible for the CO (7-6) and CO (10-9) transitions. The peak in the corresponding spectra is the emission from the nebula and the negative signatures are ghosts related to the observing mode (frequency switch, see Table 2). Constraining upper limits of the emission from the targets can still be derived (see Table 3) assuming that the width of the lines should be smaller than the one detected from the 12C+ emission and that the peak of the lines is below the detection threshold, that is, three times the noise level.
Level-2 calibrated spectra from the PACS line spectroscopy also allow to extract the continuum emission which is underlying the line (see Fig. 2). The continuum extraction was done for the Carina candidate proplyd (105-600) only because the far-infrared signal from the two Orion proplyds is drowned in the emission of the nebula. In a five-by-five spaxels image of PACS, the emission from the target is estimated by extracting the flux in the central spaxel, correcting it for losses to the neighbouring spaxels because of the point spread function, and subtracting the mean observed flux in the 16 external spaxels. The values obtained are presented in Table 4.
Continuum emission of the Carina candidate proplyd 105-600.
2.1.4. Complementary data
For the Carina candidate proplyd 105-600, the dataset is complemented with optical to submillimeter data from other instruments. From the online archives, we retrieved the available data from the Spitzer/IRAC and MIPS (PI: N. Smith, program-ID: 3420, 30848, Smith et al. 2010b) instruments, plus the photometry obtained by Herschel/PACS and SPIRE (PI: S. Molinari, program-ID: OT2_smolinar_7). From this data, we have extracted the continuum emission by direct measurement of the spectral radiance or by aperture photometry (Table 4). We also retrieved the data of the Atacama pathfinder experiment (APEX) 12-m telescope from Sahai et al. (2012) who used the LABOCA and SABOCA bolometers (beam size of respectively 7.8′′ and 19′′) to measure continuum emission and CHAMP+ and FLASH+ spectrometers (beam sizes from 7.7′′ to 18.6′′) to observe molecular lines. Finally, we used the optical HST/ACS Hα image (PI: N. Smith, program-ID: 10475, Smith et al. 2010a). Performing photometry at the ionisation front, we obtained a brightness (including Hα and [NII] 6583 Å lines) of 4 × 10⁻⁷ W m-2 sr-1 which has been used to estimate the electron density at the ionisation front of ne ≤ 680 cm-3.
For the proplyd 244-440, we also included the OH 84 μm line detected in a PACS survey of the Orion Bar and described in Parikka et al. (2016). HST10 has been observed in the H2 1-0 S(1) line by Chen et al. (1998), and we use their value for the intensity of this line. The [OI] 6300 Å line was observed with HST and we use the value given in Table 4 of Bally et al. (1998).
2.2. ALMA detection of the 203-506 proplyd
Recently, coauthors of this paper have serendipitously detected intense HCO+ (4-3) emission towards the 203-506 proplyd with ALMA. This detection was quite surprising since only a few, and generally very massive, proplyd silhouette disks have been detected with ALMA in HCO+ and reported in the literature (Williams et al. 2014). Since HCO+ is a PDR tracer, and given that other PDR tracers have been detected towards 203-506 (see below), we have decided to include it in our study. It also complements our sample quite well since it is a silhouette proplyd (Bally et al. 2000), meaning that it is seen against the bright background in visible. The disk is edge-on and situated just south of the Orion Bar. Its surface is bright in [OI] 6300 Å and a faint [OI] jet is also visible (Bally et al. 2000). It does not exhibit any visible envelope as the others probably because it is lying in the neutral PDR resulting from the photodissociation of the Orion bar. The fact that the ionisation front of the M42 HII region has not yet reached 203-506 suggests that this disk has emerged out of the molecular cloud only very recently and hence that it has been exposed to UV irradiation for a relatively short time compared to classical proplyds. The 203-506 proplyd was detected as part of the ALMA cycle 1 project dedicated to the observation of the Orion bar (PI: J. Goicoechea). The observations were conducted in Band 7 with an angular resolution of 1′′ insufficient to spatially resolve the disk. The detailed analysis and data reduction are presented in Goicoechea et al. (2016). 203-506 was clearly detected in the HCO+ (4-3) line. For other tracers with lower critical densities such as low-J CO lines in Band 7 of ALMA, the emission is dominated by the Orion molecular cloud and hence the disk cannot be detected. The derived integrated intensity for the HCO+ (4-3) line is presented in Table 3. Emission from the H2 1-0 S(1) line was also observed with the BEAR instrument (Noel et al. 2005) at the Canada France Hawaii Telescope. This data is presented in Noel (2003) and we use their intensity. The [OI] 6300 Å line was also observed by HST. The line integrated intensity was extracted from the HST image and corrected from extinction (AV = 1.26) using the extinction map of the Orion nebula derived from the MUSE data by Weilbacher et al. (2015). The intensity is reported in Table 3.
3. 1D-model of the PDR in an externally-illuminated protoplanetary disk
Since their discovery, proplyds have been extensively studied with the help of PDR models in order to determine their physical properties (e.g. Johnstone et al. 1998; Störzer & Hollenbach 1999; Richling & Yorke 2000; Adams et al. 2004; Clarke 2007; Walsh et al. 2013). This approach is well-suited when trying to explain the FIR lines tracing the warm gas present at the surface layer of the disk and in the envelope. In this section we describe our modelling methodology.
3.1. Proplyds as PDRs
Observations (Sect. 2) and preliminary modelling we performed showed that two different components, with different densities, are necessary to describe a proplyd and correspond very likely to the two distinct regions of the PDR, respectively the disk surface layer and the envelope. Given that, the geometry and parameters that we finally used are summarised in Fig. 3 and Table 5. We consider that a proplyd consists of an envelope (fed by the photoevaporation of the disk) with the apparent shape of an ellipse with semiaxes aenv, benv, and defined by a mean density nenv, a mean dust temperature TD,env and  the fraction of elemental carbon in the gas phase locked in Polycyclic Aromatic Hydrocarbons (PAHs). At the centre of the envelope lies the disk with an apparent surface Sdisk, a mean dust temperature TD,disk<TD,env and a mean density ndisk in the surface layer. We note that we are not modelling the properties of the bulk of the disk since we limit ourselves to the PDR which corresponds to the external layers of the proplyd (envelope and disk surface). Finally, the object is irradiated by FUV photons along the major-axis. The corresponding FUV radiation field G0 is expressed in units of the Habing field. These parameters are used to predict both the dust spectral energy distribution (Sect. 3.2), and the gas emission (Sect. 3.3).
Parameters of the models for the four proplyds studied.
 |
Fig. 3 Top: schematics of the apparent 2D geometry with parameters used in our adapted model of an externally-illuminated protoplanetary disk composed of a disk (blue) surrounded by an envelope (red). Bottom: 1D corresponding slab used to model the PDR of the proplyd. |
3.2. Dust spectral energy distribution
Interstellar dust is mainly composed of small grains (10 nm to 0.1 μm, see e.g. Compiègne et al. 2011) of silicates and carbonaceous compounds. Disks form from this medium and evolve with time in a way that their grains get larger and their dust-to-gas mass ratio increases (see e.g. the review of Williams & Cieza 2011). The dust properties in the photoevaporation flow (envelope) are expected to differ from that of the disk because of a physical selection in size (e.g. Owen et al. 2011). However, we will initially assume that their dust populations are quite primitive and close to those of the ISM. We will then discuss the effects of grain evolution (Sect. 3.3 and Appendix B).
The far-infrared spectrum of proplyds is dominated by the emission of the largest grains from that range, which are at thermal equilibrium with the radiation field. The thermal component of their spectral energy distribution can be modelled knowing the opacity τν and the mean dust temperature (TD,env, TD,disk1). Indeed, for a given dust temperature TD, the emitted spectral radiance follows the relation  (1)where Bν is Planck’s law. The dust opacity
  at the frequency ν, is defined by
  (2)where
  is the dust opacity at the reference frequency
  and β is the spectral index. Following Planck Collaboration XXV (2011), we used a spectral index of 1.8 and a reference wavelength of 250 μm (1200 GHz) for which they found that, in the molecular phase of the ISM, the total column density of hydrogen, NH, is related to the dust opacity by the empirical relation
  (3)The mean column density of hydrogen is related to the total mass of gas and dust by
  (4)where Ω is the observed surface in the instrumental beam knowing the distance to the source, μmH the mean particle mass per hydrogen atom with mH the mass of one hydrogen atom and μ = 1.4. Finally, for each component (disk and envelope), the emission can be written as a function of the total mass M and the dust temperature TD,
  (5)The mid-infrared dust emission is dominated by PAHs which are found in the envelope and disk surface of proplyds (Vicente et al. 2013). This component is included in the model using the PAH emission modelled with the DustEM code (Compiègne et al. 2011).We use the standard PAH population given by them (a log-normal size distribution of neutral molecules and one more for singly-charged molecules). The intensity of PAH emission then only depends on the incident FUV radiation field G0, the abundance of PAHs given as and the total mass of the envelope Menv.
3.3. Line emission using the Meudon PDR code
To predict emission lines from a PDR, one needs a model that correctly describes geometrical and micro-physical elements. Doing both with accuracy is not currently possible for computational time reasons. In this study, we have choosen to favor a proper description of the physics and chemistry rather than geometry, also taking into account that we do not have enough angular resolution to perform a careful geometrical analysis. From this perspective, the 1D Meudon code is well suited since it is constantly updated to include latest improvements on the microphysics (e.g. H2 formation and excitation, photoelectric effect, grain temperature fluctuations etc. (Le Petit et al. 2006; Le Bourlot et al. 2012; Bron et al. 2014, 2016). The Meudon PDR code is a 1D-model that considers a cloud made of a stationary plane-parallel slab of dust and gas illuminated by a given radiation field. The model iteratively solves the UV radiative transfer, thermal balance and chemistry at each point of the cloud. Once the computation of atoms and molecules abundances and physical conditions is done for each point in the cloud, the model can calculate the local emissivities of lines. In our case, the integration of this quantity gives us the brightness of the disk surface layer and the brightness of the envelope. Weighted those quantities by the size of the corresponding emitting region enables us to derive the line integrated intensity that can be compared with the spatially unresolved observations that we have.
Default values of some parameters used in the Meudon PDR code.
Here, we use the 1.4.42 public version of the code. We use the default values for the dust-to-gas mass ratio, dust properties, cosmic ray ionisation rate and turbulent velocity (Table 6), as well as elemental abundances appropriate for the ISM (see Le Petit et al. 2006). However, grain properties in proplyds are likely to differ from those found in the ISM. Indeed, the smallest grains or PAHs seem to be underabundant in proplyds compared to the ISM: this is observed for HST10 by Vicente et al. (2013) and for 105-600 in this study (see Sect. 4.1.1). This observational fact is in agreement with the low detection rate of PAHs in isolated disks around young low-mass stars (Geers et al. 2006; Oliveira et al. 2010). We set the minimum grain radius to 3 nm in the model, that is, excluding the smallest particles such as PAHs, for consistency with that observational fact and assuming that this is a general trend for proplyds. In the PDR model, the main impact of this modification is to remove the contribution of these small grains to the photo-electric heating and to the H2 formation rate. This parameter has not a significant impact on the modelled line fluxes because proplyds are dense PDRs where the grain photoelectric effect may not always dominate the heating (this will be discussed in Appendix B according to our results). Grain growth inside an evolving object tends to modify the grain distribution by increasing the maximum grain radius amax, lowering the absolute value of the power-law index and finally it reduces the FUV extinction curve. Since these parameters can not be constrained accurately based on current observations of proplyds, we have explored their effects by changing three parameters independently: the maximal radius amax up to 3 μm, consistently with observations of Orion proplyds (Shuping et al. 2003; Vicente 2009); the power-law index down to 3.0 (e.g. Testi et al. 2014); and the FUV extinction using various curves of Fitzpatrick & Massa (1988) including a case with a dust FUV extinction cross section per H nucleus σext ≃ 8 × 10-22 cm2 as used for a sample of proplyds in the Orion nebula by Störzer & Hollenbach (1999). The effects on the model results are discussed in Appendix B and the general conclusion is that the changes do not affect the model results significantly. Hence, we keep the default ISM properties throughout this paper.
The input parameters of the Meudon code are the density profile as a function of visual extinction AV, and the incoming FUV radiation field. These parameters are related to those of the proplyd model presented in Sect. 3.1 in the following way. The impinging radiation field is set by the value G0 arriving at the surface of the envelope. The density profile between the envelope surface, or ionisation front, at AV = 0 and the disk surface at  is constant with a value n = nenv. At the envelope – disk interface (i.e. at at ), the density jumps to n = ndisk and is kept constant up to
  . Since the parameter gives the position of the envelope – disk interface, it is also the visual extinction of the envelope and is set by
  (6)where κ is the parameter which relates the envelope column density Nenv to the extinction at the density jump, and can be calculated from Table 6, κ = NH/AV = 1.87 × 1021 cm-2 (assuming ISM properties). The envelope column density is defined by Nenv = nenv × aenv. Finally, the value of is set to 10. The exact value is not critical but we have carefully checked that it is high enough. Indeed, most of the UV radiation is rapidly absorbed and most of the emission arises from regions of low extinction so increasing this parameter does not impact the results.
3.4. Fitting strategy
In order to estimate the unknown parameters of the model (see Table 5), we are looking for the set of values that best fit the observations based on a chi-square minimisation. For the spectral energy distribution of the dust, the model numerically converges to the best solution in the space of parameters using a Nelder-Meadwith non-linear minimisation script. For the line emission, we ran the above model on a grid for nenv and ndisk in a range of realistic values. The apparent size of the disk Sdisk is adjusted in the case of 105-600 while is known for the other proplyds. The best model is the one which minimises the chi-square between observed and predicted line integrated intensities.
4. Results of proplyd models
In this section, we present the results of the comparison between the models and observations. We start with 105-600, for which the largest number of detections is available and follow with the Orion proplyds.
4.1. Proplyd 105-600
4.1.1. Dust spectral energy distribution
The spectral energy distribution of 105-600 is shown in Fig. 4. The results of the fit with the model to the observed SED are given in Table 7. Under the assumptions described in Sect. 3.2, the first component, the disk, is composed of a cold dust population (~20 K) and a total mass (dust and gas) of 0.67 M⊙. The envelope corresponds to a hotter dust population (~40 K) and contains a total mass of 0.048 M⊙. This mass estimate is compared to other methods in Sect. D.2 which yield similar values both for the disk and envelope. The estimated PAH abundance in the envelope is  , about 30 times less than that in the PDR of the NGC 7023 reflection nebula (Berné & Tielens 2012). The depletion of PAHs within a proplyd-like object has already been observed in HST10 (Vicente et al. 2013) with a relative abundance three times lower than in 105-600 – about 90 times less than in NGC 7023. These low abundances in proplyd-like object could result from PAH destruction by the strong UV radiation field or sedimentation of PAHs in the disk but this is currently still unclear.
 |
Fig. 4 Best fit to the observed spectral energy distribution of the dust in 105-600 with a model including two components for the thermal emission and one for the emission of PAHs. Dots are detections while triangle represents upper limits. |
Parameters derived from the fit of the spectral energy distribution for 105-600.
4.1.2. Line emission
To compare our models with observations, we have ran a grid of models with density ranges nenv = 1 × 10³−2 × 104 cm-3 and ndisk = 1 × 10⁵−1 × 107 cm-3, with constant grain properties as defined previously in Table 6 (amin = 3 nm, δ = 0.01, see Appendix B for the impact of those parameters). In Fig. 5, we present the comparison between all the models and the observations. From the χ2 analysis (Fig. 5b), a minimum is clearly found where the best-fit model is the one with nenv = 8.5 × 103 cm-3, ndisk = 7 × 105 cm-3 and a value Sdisk = 2 × 10⁷ AU2. in Fig. 6, we present the comparison between the observed line integrated intensities and the best-fit model. All lines are reproduced to a factor of a few or better, with the notable exception of HCN (4-3) which is under-predicted by more than an order of magnitude. HCN emission is a tracer of dense gas, whereas our model with a constant density is adopted only for the surface layers of the disk. To go further and improve the modelling of the low-J CO and HCN lines would require a detailed disk model not limited to the PDR as here.
The gas temperature at the edge of the envelope (ionisation front) increases with the envelope density but in a relative small range (~150 to 400 K, see Fig. 5c) compared to the variations associated to the grains properties (Figs. B.1 and B.2). The gas temperature at the surface of the disk mainly depends on the envelope density (see Sect. 5 for more details). The best-fit model corresponds to a value of about 1100 K. Models with slightly lower envelope densities, ans thus slightly higher disk surface temperatures, are still close to the observations while the decrease in disk surface temperature caused by an increase in the envelope density makes models diverge significantly from observations. This is strong evidence that the disk surface is hot, with a temperature of around 1000 K or more.
 |
Fig. 5 a) Modelled lines fluxes (105-600) for the considered density ranges (colored points) compared to observations (black diamonds). Uncertainties of observations are not plotted because they are smaller than the marker. b) χ2 comparing observed line integrated intensities of 105-600 and modelled values for the considered envelope and disk densities. c) Temperature at the ionisation front, overlaid are the χ2 contours. d) Temperature at the disk surface. In panels b, c, d, points are the positions where the models are calculated and the colors and contours result from interpolating the model results over these points. |
4.1.3. Physical structure of the PDR
As an output of the model it is possible to obtain the 1D physical structure of the PDR in the studied proplyds. We note that this structure is only limited to the PDR, i.e. the envelope and the surface layer of the disk, and so that the extracted physical properties are not valid deeper in the disk where much larger densities are expected and UV photons are strongly attenuated. The 1D profiles for the best model of 105-600 are shown in Fig. 7. It can be seen that the H/H2 transition, defined here as the region where 10 to 90% of H is in H2, encompasses the envelope – disk interface ( , see Eq. (6)) ranging from AV = 0.729 (inside the envelope, right before the interface) to AV = 0.748 (inside the disk). The C+/CO transition starts inside the molecular disk, at AV = 0.742 and stops at AV = 2.49.
 |
Fig. 6 Comparison between best-fit model line integrated intensities and observed line integrated intensities for 105-600. |
The gas temperature is 285 K at the ionisation front and increases up to 650 K at AV = 0.63 (Fig. 7, second pannel). It then decreases to about 320 K before jumping to 1100 K at the disk surface and then slowly decreases. We note that a smoother density profile, rather than a jump, does not significantly change the temperature profile except that it is slightly smoothed too. We thus choose to keep a jump for simplicity. The initial increase inside the envelope can be attributed to an increase of the photoelectric-effect efficiency related to the increasing concentration of neutral grains (Fig. 7, third panel). The trend is inverted just before reaching the disk (and the H/H2 transition) where the efficiency drops. The photoelectric-effect is by far the main heating mechanism inside the envelope. However, at the disk surface, several heating mechanisms contribute significantly (Fig. 7, third panel): chemical reactions (37%), photoelectric-effect (24%), formation of H2 on grains (17%,) collisional de-excitation of UV-pumped H2 (15%) and direct ionisation and dissociation by FUV photons (7%). Beyond AV = 1, the photoelectric-effect becomes again the main heating mechanism up to AV = 4.5, where the gas-grains collisions take the lead and keep the gas temperature close to the dust temperature. However, at this location, our simple constant density PDR model is not appropriate anymore and proper modelling will require specific disk models.
Inside the envelope, owing to the relatively high gas density, the main cooling mechanism is the fine-structure line emission of [OI] 63 μm, which is one order of magnitude stronger than the [CII] 158 μm line. At the surface of the disk, the cooling is shared between the cascade of H2, the gas-grains collisions, the emission of O and CO. Deeper in the disk, CO and O dominate the cooling.
4.2. Results for Orion proplyds
For the three Orion proplyds, few detections of gas lines are available. For these sources the far-infrared dust emission was not detected since it is drowned in the emission from the nebula. We therefore only attempt to reproduce the observed line emission with our model. Intense emission of the [OI] 6300 Å line is observed towards the disks of HST10 and 203-506 as reported by Bally et al. (1998). This line arises from the hot neutral layers of the PDR. Its excitation is the result of the rapid formation of OH through the reaction of O with H2, followed by photodissociation leaving a large fraction of O in an electronically excited state which radiatively decays through emission in the 6300 Å line. Since this process was not included in the public version of the Meudon PDR code (it will be in the next one), we therefore calculate the intensity of the [OI] 6300 Å line using the prescription of Störzer & Hollenbach (1998), using the column density of OH predicted by our model. In order to fit the observations, we follow the same strategy as for 105-600, i.e. we vary the envelope and disk density. Comparison between observations and the best-fit model are shown in Fig. 8, while parameters and outputs of the best-fit models are given in Tables 5 and 8.
For HST10, models cannot produce more than 10-6 W m-2 sr-1 of [CII] emission – including changing the envelope density, the small grains abundance or dust extinction properties – which is well below the upper limit extracted from observation. This is consistent with the idea that the observed emission should be dominated by the [13CII] emission from the HII region expected at the same frequency. Overall this suggests that the envelope properties are not well constrained here. The [OI] 6300 Å line intensity is initially strongly underestimated but is better reproduced if the mechanism of formation for the excited oxygen described by Störzer & Hollenbach (1998) is included in the model and if an nenv ≤ 4 × 105 cm-3 is used. Above this value, the envelope column density is large enough that OH starts to form inside the envelope, which is incompatible with observations showing that the emission occurs close to the disk surface (Bally et al. 1998). An envelope density of nenv ≤ 4 × 105 cm-3 corresponds to an envelope column density of about Nenv = 3 × 1021 cm-2 which is slightly below the estimated value of 5.5 × 1021 cm-2 from Störzer & Hollenbach (1998). The H2 and [OI] 6300 Å lines are best explained with a disk density of the order of 106 cm-3. The best-fit model gives nenv = 2.5 × 105 cm-3 and ndisk = 4 × 106 cm-3. The disk density is consistent with the estimate of Störzer & Hollenbach (1998) who found the same value. The temperature at the disk surface predicted by the best fit model is 1150 K.
For 244-440, [CII] arising mainly from the envelope is probably detected but, as HST10, drowned in the nebula emission. The OH line is well detected and should arise from the disk (under the assumptions that this line is being emitted by the proplyd, and no other object of the Orion Bar is in the line of sight). With two lines, one of which is an upper limit, the two densities will be poorly constrained, but we nevertheless found a clear best-fit for a model with nenv = 1 × 105 cm-3 and ndisk = 2 × 106 cm-3. The temperature at the disk surface predicted by the best fit model is 1270 K. These values are consistent with those found for the other Orion proplyds.
For 203-506, the disk density is well constrained by the observation of the H2 and HCO+ lines and the best-fit value is ndisk = 1 × 106 cm-3. The envelope density that corresponds to the ambiant PDR resulting from the photoevaporation of the Orion bar (Goicoechea et al. 2016) is estimated to be nenv = 4.5 × 104 cm-3. The temperature at the disk surface (which we consider being at the H/H2 transition) predicted by the best fit model is 1080 K. Here again, we need to include the mechanism of Störzer & Hollenbach (1998) in the model in order to get closer to the observed [OI] 6300 Å line intensity but is still highly underestimated. This discrepancy could be explained by the emission from shocked regions or that another mechanism to form OH is missing, e.g. by reactions with vibrationally excited H2.
 |
Fig. 7 PDR structure of the best-fit model for the Carina candidate proplyd 105-600. FUV radiation field is incoming from the left where the ionisation front is located at AV = 0. The disk surface, represented by a vertical dashed black line, is located at AV = 0.742. The small dark grey patch close to the disk surface illustrates the H/H2 transition (10 to 90% of H in H2) and the bright green patch illustrates the C+/CO transition (10 to 90% of C in CO). The dust temperature is given as a range corresponding to the temperature of the biggest to the lowest studied grains (radius of 3 to 300 nm). We note that the x-axis is in magnitude of visual extinction. In distance, the envelope represents about 11 000 AU while the green patch in the disk represents 300 AU. |
Physical parameters estimated with the model for the studied prolyds.
The physical structures extracted for the Orion proplyds are not shown here because they are constrained less well than 105-600. They are found to be similar to that given for 105-600 in Fig. 7, with a rapid increase of the gas temperature at the disk surface and the H/H2 transition layer located close to it.
4.3. Comparison to other models
It is interesting to compare the results obtained here with those of earlier studies of proplyds using PDR models. In doing this comparison it is important to keep in mind that these studies usually do not compare their predictions to actual observations of PDR tracers towards these objects.
Störzer & Hollenbach (1999) and Adams et al. (2004) use a PDR model based on the classical Tielens & Hollenbach (1985) model. Contrary to what is presented here, they consider a single constant density structure. Störzer & Hollenbach (1999) compare their models to the emission of vibrationally excited H2 and [OI] 6300 Å emission observed in Orion proplyds (including HST10) and find good agreement. They also predicted the far infrared line intensities of the [CII] line, for which they give values ranging between 2.4 and 3.1 × 10⁻⁶ W m-2 sr-1, which assuming an emitting size equal to the size of the envelope projected on the plane of the sky (2.6″ × 1″, see Table 1) corresponds to a flux of 1.15−1.50 × 10⁻¹⁶ W m-2, just below the high upper limit of 2.3 × 10⁻¹⁶ W m-2 that we obtained. While not excluded, their value is probably overestimated since the observation is supposed to be highly contaminated by the nebula emission. They have also predicted strong [OI] 63 μm emission close to our high upper limit of detection leading to the same possible conclusion. Detailed observations are needed to conclude clearly. The study of Adams et al. (2004) is essentially theoretical. While focusing on different FUV field ranges, the temperature profile is characterised in both studies by a region of constant and high temperature (>4000 K) at low column densities followed by a drop of temperature at the location of the H/H2 transition, which is situated, in their models, just above the disk. The temperature profile which we find here (Fig. 7) differs greatly from that of Störzer & Hollenbach (1999) and Adams et al. (2004) in that the temperature we find at low column densities is much lower (typically a few 100 K). This is mainly due to two fundamental differences which reduce the heating in the envelope in our models: firstly, the lower density does not allow collisional de-excitation of H2 to be important, and secondly, the low abundance of small grains that we have considered (in agreement with the observation that PAHs are underabundant in HST10 and in 105-600 (Vicente et al. 2013, and Sect. 4.1.1), reduces photoelectric heating drastically. Nevertheless, an important aspect in the frame of photoevaporation is that the temperatures at the disk surface derived by Störzer & Hollenbach (1999) and Adams et al. (2004) are typically of the order of a few 100 K (lower than ours). Our prediction for the H2 (1-0) S(1) line for HST10 is in good agreement with theirs and with our observations.
 |
Fig. 8 Comparison between observed line integrated intensities and best-fit models for the Orion proplyds. Observations are shown in black while estimated line integrated intensities using the outputs of the models (including the method of Störzer & Hollenbach (1998) for the [OI] 6300 Å line) are shown in blue. The heads of the black arrows give the upper limits for [CII] emission in the case of HST10 and 244-440. |
 |
Fig. 9 Modelled temperature at the disk surface as a function of the position of the H/H2 transition for various radiation fields and adopting the geometries of 105-600 as a large proplyd and HST10 as a small proplyd. The points are the positions where the models are calculated and corresponding solid lines are cubic interpolations. The dotted vertical line corresponds to Ptrans = 1. On the left side of this line, the H/H2 transition is inside the disk, while on the right side of this line the H/H2 transition is inside the envelope. |
 |
Fig. 10 Relative contribution of the main heating processes at the surface of the disk for different sizes of proplyd (size of 105-600 or HST10) and FUV field (2 × 10³, 2 × 10⁴ and 2 × 10⁵) as a function of the location of the H/H2 transition. |
 |
Fig. 11 Relative contribution of the main cooling processes at the surface of the disk for different sizes of proplyd (size of 105-600 or HST10) and FUV field (2 × 10³, 2 × 10⁴ and 2 × 10⁵) as a function of the location of the H/H2 transition. |
5. Effect of the H/H2 transition layer location on the gas thermal balance at the disk surface
In this section, we explore the effect of the location of the H/H2 transition layer on the gas thermal balance, and the gas temperature, at the disk surface, in other words, the density jump in our model. As described in Tielens (2005), the location of this layer (corresponding to the column density of hydrogen nucleus), is proportional to the FUV flux G0 and inversely proportional to the density. Since the column density between the ionisation front and this layer is mainly set by the envelope density in the case of proplyds, we run our model on a grid of values for nenv and G0 from 2 × 10³ to 2 × 10⁵. We also considered different envelope sizes: a large one corresponding to the size of the biggest studied proplyd, 105-600, and a small one corresponding to the size of HST10.
5.1. Temperature
First of all, we extracted the gas temperature at the disk surface for each model of the grid to see its evolution with the position of the H/H2 transition layer. This is illustrated in Fig. 9 which presents the gas temperature at the disk surface as a function of the position of the H/H2 transition which is captured by the ratio  , where
  is the visual extinction, or position, at which the transition layer starts, that is, where 10% of the hydrogen is in molecular form, and is the visual extinction setting the position of the density jump corresponding to the disk surface in our model. The H/H2 transition is thus totally located inside the disk when Ptrans< 1, and is located or starts in the envelope when Ptrans > 1. A similar behaviour is observed for all the studied cases: a hot (T = 1500−5000 K) regime prevails when the transition is located inside the disk (Ptrans < 1) while a warm regime (T < 500 K) is observed when the transition is located inside the envelope (Ptrans > 1). A transitional regime (T ~ 500−1500 K) lies between the hot and warm regimes at Ptrans ~ 1.
5.2. Heating and cooling mechanisms
To gain insight into the mechanisms driving this temperature behaviour, we also studied the evolution of the heating and cooling mechanisms as a function of the H/H2 transition layer position. Results are given in Figs. 10 and 11 respectively. The following observations can be made: when the envelope density (and visual extinction) is small and the transition is inside the disk (Ptrans < 1, T ~ 1500−5000 K), the collisional de-excitation of UV-pumped H2 is very efficient and dominates the heating, except for very intense FUV fields (G0 > 105) where the heating by the photo-electric effect can be even higher, while cooling is dominated by gas-grain collisions. This corresponds to the hot regime. When the transition is located inside the envelope (Ptrans> 1, T< 500 K), the photoelectric effect on grains dominates the heating, and cooling is dominated by emission in fine structure lines of oxygen. This corresponds to the warm regime which is the classical solution for thermal balance usually observed in PDRs. Finally, in the transitional regime, that is, when the transition is close to the surface but starts inside the envelope (Ptrans ~ 1, T = 500−1500 K), the contribution of a collection of heating processes (exothermal reactions, H2 formation and direct absorption of ionising/dissociation photons, exothermal chemical reactions) control the heating and cooling also occurs through multiple processes (e.g. collisional excitation of H2, OH and CO emission lines).
5.3. Evidence for a specific energetic regime
At this point it is interesting to note that for each object, the H/H2 transition in the best-fit model is located close to the disk surface (Ptrans ≳ 1, cf. Table 8 and Fig. 9). This is in agreement with spatially resolved observations which for instance show that the emission of vibrationally excited H2 (for HST10) and [OI] 6300 Å (for HST10 and 203-506) arises from the disk surface or just above (Chen et al. 1998; Bally et al. 1998). This implies that proplyds appear to be in the transitional regime with temperatures at the disk surface close to 1000 K. Guided by Fig. 9, we build the following reasoning: when the isolated disk (before the formation of the envelope) is irradiated by the external FUV photons, the H/H2 transition forms inside the disk, and the temperature rises to some several 1000 K, driving an intense photoevaporation flow. This increases the column density of the envelope Nenv, dragging the H/H2 transition out of the disk (Ptrans = Nenv/NH−H2> 1) which lowers the temperature at the disk surface. Consequently, the evaporating mass flux will decrease and so will the envelope column density due to spherical divergence. At one point the H/H2 transition will go back inside the disk (Ptrans< 1), temperature will rise, mass-loss increase as well as envelope column density, etc.
Overall, this suggests that proplyds are in an equilibrium where the temperature of the disk surface is set so that mass loss is sufficient to keep the envelope column density to a value that maintains the H/H2 transition close to the disk surface. In this specific case, the disk surface temperature is set by a combination of numerous heating and cooling processes and reaches values of the order of 1000 K (for radiation fields between G0 = 2000 and G0 = 2 × 10⁵).
6. Photoevaporation and mass-loss rates
At this point it is interesting to discuss photoevaporation and mass loss of proplyds in the context of our results. Namely, knowing the size of the disks and a possible range of masses for the central stars from independent studies, we can use the surface temperature and densities from our models (Tables 5 and 8) to estimate photoevaporation rates.
6.1. Definitions
The critical radius where the kinetic energy of gas particles is equal to the gravitational potential is defined as (Hollenbach et al. 1994)  (7)where the sound speed cS is
  (8)The term μmH is the mean particle weight, γ is the adiabatic index taken as 7/5 here – the value for a perfect diatomic gas – and kB the Boltzmann constant. The mass-loss rate is defined for two cases, which depend on the value of the disk radius rdisk:
-
Supercritical case when rdisk>rg. The mass-lossrate occurs mostly from the disk surface (vertical mass-loss) andis given by (Johnstone et al. 1998),
 (9)
(9) -
Subcritical case when rdisk<rg. The mass-loss rate occurs from the disk edge (radial mass loss) and is given by (Adams et al. 2004),
![Mathematical equation: \begin{equation} {\dot M} = C_0~N_{C}~\mu~m_{\rm H}~c_\mathrm{S}~r_{\rm g} \Bigl({r_{\rm g} \over r_{\rm d}} \Bigr) \exp\bigl[ -r_{\rm g}/2r_{\rm d} \bigr], \label{eq:analytic} \end{equation}](/articles/aa/full_html/2017/08/aa29404-16/aa29404-16-eq224.png) (10)where C0 is a dimensionless constant of order unity and NC is defined as the atomic region of the PDR in their models which must be of the order of Nenv in ours.
(10)where C0 is a dimensionless constant of order unity and NC is defined as the atomic region of the PDR in their models which must be of the order of Nenv in ours.
6.2. Carina candidate proplyd 105-600
For 105-600, the disk (or candidate disk) size is unknown. The value of Sdisk derived from the model can be converted in an equivalent radius considering that the disk is in the plane of the sky. This yields a value of about 1.1′′ or 2500 AU. The temperature at the surface of the disk is estimated to be about 1100 K. For such a large radius, rdisk>rg for masses of central star up to 30 M⊙, and the supercritical regime prevails everywhere. We derive for this case a mass-loss rate Ṁ = 7.5 × 10⁻⁵M⊙/yr. The mass-loss at the ionisation front can be derived from the Hα emission, and we find a value of the order of 2 × 10⁻⁶M⊙/yr, about 40 times smaller. This discrepancy could be explained if the envelope is in a phase where it is gaining mass (see Sect. 5.1) while depleting the disk. We note that the Orion proplyds, which seem to be at equilibrium (mass loss at the ionisation is roughly equal to the disk mass loss computed here, see Sect. 6.3), generally exhibit a tear-drop shaped envelope as HST10 (Fig. 1b) as the consequence of this equilibrium. It is thus possible that the sharper shape of 105-600 (Fig. 1a) results from an envelope that is still growing in mass. Since the growth phase is expected to be quick, for example forming a 0.05 M⊙ envelope with such a rate would take few hundred years, 105-600 would thus be a very young object. Alternatively, it is possible that the disk radius we consider here is too large by about an order of magnitude. This would however pose a serious problem to our model when trying to reproduce the high-J CO lines. Since a protoplanetary disk with a radius of 2500 AU appears unrealistic, what we call disk in this case could most likely refer to a young forming disk from the original cloud material (similar to other large “pseudo-disks” observed, e.g. as in Quanz et al. 2010). Further observations at (sub)millimeter wavelengths to resolve the structure and kinematics of the disk will be required to settle this issue.
6.3. Orion Proplyds
For HST10 and 244-440, Henney & O’Dell (1999) derived the mass-loss rates at the ionisation front from spectroscopic observations of ionised gas tracers and found values of (7 ± 5) × 10-7 and (15 ± 7) × 10-7M⊙ yr-1 respectively. For 203-506, since the envelope ionisation front is not observed because the disk is embedded in neutral gas, the mass-loss cannot be derived from ionised gas tracers.
For the Orion proplyds whose disk outer radii are known (Vicente & Alves 2005), we can derive the mass-loss rates from our model using the analytical prescription presented above. The masses of their central stars are not precisely known but taking into account the stellar mass function of the cluster (e.g. Hillenbrand & Carpenter 2000), they are very likely about 0.1 M⊙ or less. A surface temperature of the order of 1000 K, as obtained from our study, would result in a gravitational radius of 20 AU, or less, and implies the supercritical case (rdisk>rg) for all disks. The subcritical case is still possible, but unlikely because we need to assume that central stars have a mass of about 1 M⊙, resulting in a gravitational radius of the order of 200 AU. We nevertheless consider both cases in our calculations. The mass-loss rates for each case are given in Table 8. In the subcritical regime, we find values of the order a few 10-8M⊙/yr, in agreement with the results of Adams et al. (2004), but which are too low compared to the observed values. On the other hand, the supercritical values of mass-loss are in better agreement with the mass loss derived at the ionisation front. Hence, to reconcile the photoevaporation rates derived from our best fit models with those derived from the observations by Henney & O’Dell (1999), one must assume that the flows are in a supercritical regime. This is compatible with the idea that central stars have masses well below one solar mass. If this is indeed the case, given that disk masses do not significantly exceed 0.01M⊙ in mass, this implies short lifetimes for these disks (of the order of several 104 yr) which suggests that we should not see so many of them, or that the ionising star Θ1 Ori C is particularly young, a conundum that is known as the proplyd lifetime problem (Henney & O’Dell 1999). Clarke (2007) studied in detail the dynamical evolution of proplyds assuming they are in the subcritical regime and found that their lifetime could in this case be relatively large, solving this issue. In the light of the results presented here it appears that the subcritical assumption may not be correct. Instead our results are in line with the idea that the Orion Nebula is young, meaning that. that Θ1 Ori C is less than a few 104 yr old, and that proplyds are indeed rare objects which we happen to see in Orion by chance. Another possibility is that the supercritical regime is not sustained at the same rate during the whole proplyd life and declines with time so that the lifetimes could be not so short.
7. Conclusions
In this paper, we have presented the first far-infrared observations of dense PDR tracers emitted by proplyds, obtained with the Herschel Space Observatory and ALMA. Based on the detailed Meudon PDR code, we have developed a 1D-model for the PDR of a proplyd to predict the line emission arising from it. This model successfully reproduces most lines, with the exception of HCN (4-3) in 105-600, and is somewhat lower than the observed intensities of [OI] 6300 Å (and possibly [CII] 158 μm) in HST10 and 244-440. This tracer is most sensitive to the densest gas (or the most diffuse for [CII] 158 μm) in proplyds which are not well described in our simplified model.
For all the sources, at the disk surface, we find densities of 0.7 to 4 × 106 cm-3 and temperatures of 1000–1300 K. We find that the position of the H/H2 transition layer is the critical parameter determining the disk surface temperature. Related to that, our results suggest that proplyds are in a self-regulated regime where the temperature of the disk surface is set so that mass loss keeps the envelope column density sufficient to bring the H/H2 transition out of the disk, yet close to its surface. We find that gas energetics in this specific case results from a complex combination of several heating and cooling mechanisms, hence it can not be captured by the classical solution where photoelectric effect on grains dominates the heating and [OI] and [CII] far infrared emission dominates the cooling.
We derive mass-loss rates that are large (of the order of a few 10-7M⊙/yr for the Orion proplyds and a few 10-5M⊙/yr for 105-600). Most of them are consistent with spectroscopic studies of the ionisation front in theses objects and suggest that proplyds undergo supercritical photoevaporation and indeed may have a short lifetime.
To understand proplyd evolution, in a next step, it will be necessary to couple hydrodynamic simulations of a supercritical evaporation flow with a correct treatment of PDR physics and chemistry. Concomitant with the development of models, spatially resolved observations of molecular lines close to the surface of the disks would help to constrain the photoevaporative flows and to understand the evolution of a proplyd. In particular, the high angular resolution provided by ALMA and the future JWST will enable us to resolve photoevaporative flows and study their properties and dynamics.
Contrary to the PDR approach which is limited to the surface layer of the disk, the mean dust temperature in the disk TD,disk is valid for the bulk of the disk.
Acknowledgments
This work was supported by the CNRS program “Physique et Chimie du Milieu Interstellaire” (PCMI). The research leading to these results has received funding from the European Research Council under the European Union’s Seventh Framework Programme (FP/2007-2013) ERC-2013-SyG, Grant Agreement No. 610256 NANOCOSMOS. Javier R. Goicoechea also thanks the Spanish MINECO for funding support under grant AYA2012-32032. This paper makes use of the following ALMA data: ADS/JAO.ALMA#2012.1.00352.S. ALMA is a partnership of ESO (representing its member states), NSF (USA) and NINS (Japan), together with NRC (Canada), NSC and ASIAA (Taiwan), and KASI (Republic of Korea), in cooperation with the Republic of Chile. The Joint ALMA Observatory is operated by ESO, AUI/NRAO and NAOJ.
References
- Adams, F. C., Hollenbach, D., Laughlin, G., & Gorti, U. 2004, ApJ, 611, 360 [NASA ADS] [CrossRef] [Google Scholar]
- Alexander, R., Pascucci, I., Andrews, S., Armitage, P., & Cieza, L. 2014, Protostars and Planets VI, 475 [Google Scholar]
- Bakes, E. L. O., & Tielens, A. G. G. M. 1994, AJ, 427, 822 [Google Scholar]
- Bally, J., Sutherland, R. S., Devine, D., & Johnstone, D. 1998, AJ, 116, 293 [NASA ADS] [CrossRef] [Google Scholar]
- Bally, J., O’Dell, C. R., & McCaughrean, M. J. 2000, AJ, 119, 2919 [NASA ADS] [CrossRef] [Google Scholar]
- Berné, O., & Tielens, A. G. G. M. 2012, Proc. Nat. Acad. Sci., 109, 401 [Google Scholar]
- Boss, A. P., & Durisen, R. H. 2005, ASP Conf. Ser., 341, 821 [NASA ADS] [Google Scholar]
- Bron, E., Le Bourlot, J., & Le Petit, F. 2014, A&A, 569, A100 [NASA ADS] [CrossRef] [EDP Sciences] [Google Scholar]
- Bron, E., Le Petit, F., & Le Bourlot, J. 2016, A&A, 588, A27 [NASA ADS] [CrossRef] [EDP Sciences] [Google Scholar]
- Chen, H., Bally, J., O’Dell, C. R., et al. 1998, ApJ, 492, L173 [NASA ADS] [CrossRef] [Google Scholar]
- Clarke, C. J. 2007, MNRAS, 376, 1350 [NASA ADS] [CrossRef] [Google Scholar]
- Clarke, C. J., Gendrin, A., & Sotomayor, M. 2001, MNRAS, 328, 485 [NASA ADS] [CrossRef] [Google Scholar]
- Compiègne, M., Verstraete, L., Jones, A., et al. 2011, A&A, 525, A103 [NASA ADS] [CrossRef] [EDP Sciences] [Google Scholar]
- de Graauw, T., Helmich, F. P., Phillips, T. G., et al. 2010, A&A, 518, L6 [NASA ADS] [CrossRef] [EDP Sciences] [Google Scholar]
- Facchini, S., Clarke, C. J., & Bisbas, T. G. 2016, MNRAS, 457, 3593 [NASA ADS] [CrossRef] [Google Scholar]
- Fitzpatrick, E. L., & Massa, D. 1988, AJ, 328, 734 [NASA ADS] [CrossRef] [Google Scholar]
- Flower, D. R., & Pineau Des Forêts, G. 2010, MNRAS, 406, 1745 [NASA ADS] [Google Scholar]
- Geers, V. C., Augereau, J.-C., Pontoppidan, K. M., et al. 2006, A&A, 459, 545 [NASA ADS] [CrossRef] [EDP Sciences] [Google Scholar]
- Goicoechea, J. R., Teyssier, D., Etxaluze, M., et al. 2015, ApJ, 812, 75 [NASA ADS] [CrossRef] [Google Scholar]
- Goicoechea, J. R., Pety, J., Cuadrado, S., et al. 2016, Nature, 537, 207 [NASA ADS] [CrossRef] [Google Scholar]
- Gorti, U., & Hollenbach, D. 2009, AJ, 690, 1539 [NASA ADS] [CrossRef] [Google Scholar]
- Gorti, U., Liseau, R., Sandor, Z., & Clarke, C. 2016, Space Sci. Rev., 205, 125 [NASA ADS] [CrossRef] [Google Scholar]
- Habing, H. J. 1968, Bulletin of the Astronomical Institutes of the Netherlands, 19, 421 [Google Scholar]
- Haisch, K. E., Lada, E. A., & Lada, C. J. 2001, ApJ, 553, L153 [NASA ADS] [CrossRef] [Google Scholar]
- Henney, W. J., & O’Dell, C. R. 1999, AJ, 118, 2350 [NASA ADS] [CrossRef] [Google Scholar]
- Hillenbrand, L. A., & Carpenter, J. M. 2000, AJ, 540, 236 [NASA ADS] [CrossRef] [Google Scholar]
- Hollenbach, D., & McKee, C. F. 1989, AJ, 342, 306 [NASA ADS] [CrossRef] [Google Scholar]
- Hollenbach, D., Johnstone, D., Lizano, S., & Shu, F. 1994, ApJ, 428, 654 [NASA ADS] [CrossRef] [Google Scholar]
- Johnstone, D., Hollenbach, D., & Bally, J. 1998, AJ, 499, 758 [NASA ADS] [CrossRef] [Google Scholar]
- Konigl, A., & Pudritz, R. E. 2000, in Protostars and Planets IV (Tucson: Univ. Arizona Press), 759 [Google Scholar]
- Le Bourlot, J., Le Petit, F., Pinto, C., Roueff, E., & Roy, F. 2012, A&A, 541, A76 [NASA ADS] [CrossRef] [EDP Sciences] [Google Scholar]
- Le Petit, F., Nehmé, C., Le Bourlot, J., & Roueff, E. 2006, ApJS, 164, 506 [NASA ADS] [CrossRef] [EDP Sciences] [Google Scholar]
- Marconi, A., Testi, L., Natta, A., & Walmsley, C. M. 1998, A&A, 330, 696 [NASA ADS] [Google Scholar]
- Menten, K. M., Reid, M. J., Forbrich, J., & Brunthaler, A. 2007, A&A, 474, 515 [NASA ADS] [CrossRef] [EDP Sciences] [Google Scholar]
- Mesa-Delgado, A., Zapata, L., Henney, W. J., Puzia, T. H., & Tsamis, Y. G. 2016, ApJ, 825, L16 [NASA ADS] [CrossRef] [Google Scholar]
- Noel, B. 2003, Thèse de doctorat, Université Pierre et Marie Curie, Paris, France [Google Scholar]
- Noel, B., Joblin, C., Maillard, J. P., & Paumard, T. 2005, A&A, 436, 569 [NASA ADS] [CrossRef] [EDP Sciences] [Google Scholar]
- O’dell, C. R., & Wong, K. 1996, AJ, 111, 846 [NASA ADS] [CrossRef] [Google Scholar]
- O’dell, C. R., Wen, Z., & Hu, X. 1993, AJ, 410, 696 [NASA ADS] [CrossRef] [Google Scholar]
- Oliveira, I., Pontoppidan, K. M., Merín, B., et al. 2010, ApJ, 714, 778 [NASA ADS] [CrossRef] [Google Scholar]
- Ossenkopf, V., Röllig, M., Neufeld, D. A., et al. 2013, A&A, 550, A57 [NASA ADS] [CrossRef] [EDP Sciences] [Google Scholar]
- Ott, S. 2010, ASP Conf. Ser., 434, 139 [Google Scholar]
- Owen, J. E., Ercolano, B., & Clarke, C. J. 2011, MNRAS, 411, 1104 [NASA ADS] [CrossRef] [Google Scholar]
- Parikka, A., Habart, E., Bernard-Salas, J., et al. 2017, A&A, 599, A20 [NASA ADS] [CrossRef] [EDP Sciences] [Google Scholar]
- Pilbratt, G. L., Riedinger, J. R., Passvogel, T., et al. 2010, A&A, 518, L1 [CrossRef] [EDP Sciences] [Google Scholar]
- Planck Collaboration XXV. 2011, A&A, 536, A25 [NASA ADS] [CrossRef] [EDP Sciences] [Google Scholar]
- Podio, L., Kamp, I., Flower, D., et al. 2012, A&A, 545, A44 [NASA ADS] [CrossRef] [EDP Sciences] [Google Scholar]
- Poglitsch, A., Waelkens, C., Geis, N., et al. 2010, A&A, 518, L2 [NASA ADS] [CrossRef] [EDP Sciences] [Google Scholar]
- Press, W. H. 2007, Numerical Recipes: The Art of Scientific Computing, 3rd edn. (Cambridge University Press) [Google Scholar]
- Quanz, S. P., Beuther, H., Steinacker, J., et al. 2010, ApJ, 717, 693 [NASA ADS] [CrossRef] [Google Scholar]
- Ricci, L., Robberto, M., & Soderblom, D. R. 2008, AJ, 136, 2136 [NASA ADS] [CrossRef] [Google Scholar]
- Richling, S., & Yorke, H. W. 1997, A&A, 327, 317 [NASA ADS] [Google Scholar]
- Richling, S., & Yorke, H. W. 1998, A&A, 340, 508 [NASA ADS] [Google Scholar]
- Richling, S., & Yorke, H. W. 2000, AJ, 539, 258 [NASA ADS] [CrossRef] [Google Scholar]
- Sahai, R., Güsten, R., & Morris, M. R. 2012, AJ, 761, L21 [NASA ADS] [CrossRef] [Google Scholar]
- Shuping, R. Y., Bally, J., Morris, M., & Throop, H. 2003, ApJ, 587, L109 [NASA ADS] [CrossRef] [Google Scholar]
- Smith, N., Bally, J., & Morse, J. A. 2003, AJ, 587, L105 [NASA ADS] [CrossRef] [Google Scholar]
- Smith, N., Bally, J., & Walborn, N. R. 2010a, MNRAS, 405, 1153 [NASA ADS] [Google Scholar]
- Smith, N., Povich, M. S., Whitney, B. A., et al. 2010b, MNRAS, 406, 952 [Google Scholar]
- Störzer, H., & Hollenbach, D. 1998, AJ, 502, L71 [NASA ADS] [CrossRef] [Google Scholar]
- Störzer, H., & Hollenbach, D. 1999, AJ, 515, 669 [NASA ADS] [CrossRef] [Google Scholar]
- Testi, L., Birnstiel, T., Ricci, L., et al. 2014, in Protostars and Planets VI (Tucson: Univ. Arizona Press), 339 [Google Scholar]
- Tielens, A. G. G. M. 2005, The Physics and Chemistry of the Interstellar Medium (Cambridge University Press) [Google Scholar]
- Tielens, A. G. G. M., & Hollenbach, D. 1985, AJ, 291, 722 [NASA ADS] [CrossRef] [Google Scholar]
- van der Tak, F. F. S., Black, J. H., Schöier, F. L., Jansen, D. J., & van Dishoeck, E. F. 2007, A&A, 468, 627 [NASA ADS] [CrossRef] [EDP Sciences] [Google Scholar]
- van der Werf, P. P., Goss, W. M., & O’Dell, C. R. 2013, ApJ, 762, 101 [NASA ADS] [CrossRef] [Google Scholar]
- Vicente, S. M. H. 2009, Ph.D. Thesis, University of Lisbon, Portugal [Google Scholar]
- Vicente, S. M., & Alves, J. 2005, A&A, 441, 195 [NASA ADS] [CrossRef] [EDP Sciences] [Google Scholar]
- Vicente, S., Berné, O., Tielens, A. G. G. M., et al. 2013, ApJ, 765, L38 [NASA ADS] [CrossRef] [Google Scholar]
- Walmsley, C. M., Natta, A., Oliva, E., & Testi, L. 2000, A&A, 364, 301 [NASA ADS] [Google Scholar]
- Walsh, C., Millar, T. J., & Nomura, H. 2013, AJ, 766, L23 [Google Scholar]
- Weilbacher, P. M., Monreal-Ibero, A., Kollatschny, W., et al. 2015, A&A, 582, A114 [NASA ADS] [CrossRef] [EDP Sciences] [Google Scholar]
- Williams, J. P., & Best, W. M. J. 2014, AJ, 788, 59 [Google Scholar]
- Williams, J. P., & Cieza, L. A. 2011, ARA&A, 49, 67 [NASA ADS] [CrossRef] [Google Scholar]
- Williams, J. P., Mann, R. K., Di Francesco, J., et al. 2014, ApJ, 796, 120 [NASA ADS] [CrossRef] [Google Scholar]
- Yang, B., Stancil, P. C., Balakrishnan, N., & Forrey, R. C. 2010, AJ, 718, 1062 [Google Scholar]
- Yorke, H. W., & Welz, A. 1996, A&A, 315, 555 [NASA ADS] [Google Scholar]
- Zuckerman, B., Forveille, T., & Kastner, J. H. 1995, Nature, 373, 494 [NASA ADS] [CrossRef] [PubMed] [Google Scholar]
Appendix A: 105-600: case of the [C II] emission
As can be seen in Fig. 2b, the fine-structure line of [CII] from the target does not seem well defined. Indeed, since the observing mode chosen was dual beam switch (see Table 2), the final spectrum is the difference between a spectrum obtained on the target (ON position) and others off the target (OFF position). While expected to be flat, the OFF-position spectrum is apparently not free of emission for this line so that we sum a positive line with a negative one. Fortunately, we have some information about the target as well as for the nebula which is seen in the OFF position. It is known from Sahai et al. (2012) and from our other resolved lines (see Table 3) for this object that it has a vLSR about − 23 km s-1. This confirms that the positive peak seen on the resulting spectrum is the target emission. Concerning the OFF emission from the nebula, it is known that it comes from a HII region where the temperature is about 104 K. At this high temperature, the width of the line is dominated by the thermal doppler broadening. With the constraints on the position of the target line and the width of the nebular line, we can fit the spectrum (Fig. A.1).
 |
Fig. A.1 Fit of the [CII] fine-structure line. The blue curve is the level-2 calibrated spectrum which is best fitted by the red curve. The positive dashed black line is the best model without the OFF line corresponding to the observation that we could have done if there was no contamination from the nebula. The negative one is OFF contamination model. Both Gaussians are fitted together and the residuals of the fit are given by the green curve. |
Our model, along with these two Gaussian lines, fits quite well the part of the spectrum with vLSR < −10 km s-1 while there are still some features on the remaining part which do not overlap the target emission. The constraints are sufficient to retrieved the target profile with a good uncertainty (see Table 3).
Appendix B: Effect of grain parameters (test on 105-600)
While grains represent only a small fraction of the total mass, a correct treatment of their role is crucial since the photoelectric effect on dust grains (Bakes & Tielens 1994) is supposed to be one of the major sources of heating and because they are responsible for the UV extinction in the PDR. The grain population is generally not precisely constrained in an evolving protoplanetary disk. It should slightly differs from the one of the ISM, so we investigated the effect of changing the main grain parameters in the model: the grain size distribution given by the minimum radius (amin), the maximum radius (amax) and the power-law index, and the dust-to-gas mass ratio δ.
If, contrary to the models presented in the main text, we include the smallest particles, i.e. we set amin to 0.4 nm instead of 3 nm, we observe very minor changes in the modelled line intensities: low-J CO lines are slightly lower and the [OI] 63 μm is slightly higher (Fig. B.1). In the absence of strong dependency, those lines cannot significantly constrain with confidence this grain parameter. The temperature at the surface of the disk is almost constant but the thermal profile is significantly changed in the envelope with strong increase of the temperature when small grains are included because they improve heating by photoelectric effect. According to the electron density estimated at the ionisation front, ne ≤ 680 cm-3, and assuming a pressure equilibrium (constant P = nT) between the neutral and ionised gas, we can derive the temperature on the side of the envelope. Note that, rigorously, the pressure in the envelope is likely somewhat larger than in the ionised gas in order to maintain the pressure gradient of the photoevaporation flow. However, the temperature on the side of the envelope should be  (B.1)where THII = 104 K is the temperature in the ionised region. In the case of the best-fit model for 105-600 where nenv = 8.5 × 103 cm-3, the temperature is thus estimated to be Tenv,IF ≤ 800 K. Models are consistent with this result only if small grains are removed by setting the minimal radius to 3 nm or a bit less, i.e. without PAHs. This is consistent with the observed low abundance of PAHs (Sect. 4.1.1).
We investigate the effect of changing the dust-to-gas mass ratio by varying it up to an order of magnitude (Fig. B.2). In that case, line fluxes are very sensitive and the best model is the one with the standard value of 100 which is, moreover, compatible with the mass estimates (see Sect. D.2). Assuming a slightly higher dust-to-gas mass ratio is still possible but it will increase the temperature at the ionisation front and will not be consistent with the 800 K limit for the envelope side. We therefore adopt gas-to-dust mass ratio of 100 (δ = 0.01) and amin = 3 nm.
We also investigated the effect of the grain growth by increasing the maximum radius and decreasing the power-law index. Adding large grains does not significantly impact the photo-electric effect but the FUV extinction curve is changed. To better describe this effect we ran tests using a standard ISM size distribution (amax = 0.3μm and a power-law index of 3.50), but with lower extinctions with the curves measured towards HD 38087, HD 36982, and HD 37023. These span a wide range of dust FUV extinction cross section per H nucleus σext including a value as low as ≃ 8 × 10-22 cm-2 which is the value observed towards Θ1 Ori C and appropriate for Orion proplyds (Störzer & Hollenbach 1999). The main effect of lowering the FUV extinction is to shift the H/H2 transition deeper in the PDR. This does not change the main heating and cooling processes involved nor the general results of our study. However, this could result in a slightly higher mean density and subsequent total column density for the envelope (as a comparison, for 105-600, the best-fitted density is nenv = 8.5 × 103 cm-3 for the Galaxy curve and nenv = 9.0 × 103 cm-3 for the one of HD 37023). Since, we did not obtain better fits to our observations by changing the extinction curve, we kept a standard Milky Way extinction curve.
 |
Fig. B.1 Variations of the modelled line fluxes (a) and temperature profile (b) for various minimal grain size in the PDR model given in the legend. Here, densities are fixed to nenv = 1 × 104 cm-3, ndisk = 1 × 106 cm-3, the FUV field is G0 = 2 × 10⁴ and a gas-to-dust mass ratio of 100 is used. |
 |
Fig. B.2 Variations of the modelled line fluxes (a) and temperature profile (b) for various gas-to-dust mass ratio in the PDR model given in the legend. Here, densities are fixed to nenv = 1 × 104 cm-3, ndisk = 1 × 106 cm-3, the FUV field is G0 = 2 × 10⁴ and a minimal grain radius of 3 nm is used. |
Appendix C: 105-600: the possibility of emissions from shocks
The Carina candidate proplyd exhibits a bipolar collimated jet that is visible in HST/ACS Hα image (Smith et al. 2010a). Shocks along jets around protostars at comparable evolutionary stages are known to be sources of optical and FIR emission lines (see e.g. Podio et al. 2012). We should thus verify if some of the observed lines could originate in shocks rather than in the PDR.
Fast and dissociative J-type shock models (with velocity between 30 and 150 km s-1) of Hollenbach & McKee (1989) could explain a fraction of the observed atomic and molecular lines but predict, for a pre-shock density of 104 cm-3 or more, that the shocked surface should be bright in the Hα image which is not the case (see Fig. 1a). For lower densities, the emissions in the FIR become negligible compared to the observations. We conclude that J-shocks are unlikely to be responsible for the observed infrared lines. Moreover, except if the jet is almost perfectly in the plane of the sky, the relatively low FWHM of the [CII] line (6.4 km s-1) suggests that this line is not coming from a high-velocity shock.
For low-velocity shocks (≤ 30 km s-1) associated with a jet, we looked at the estimated line fluxes from C and J-shock models of Flower & Pineau Des Forêts (2010). C-shocks produce negligeable [OI] emission compared to the observed one while J-shocks are not able to produce the observed [OI] emission without being, at least, two orders of magnitude brighter in CO compared to the observed emission. Atomic lines are thus very unlikely produced by such shocks. Finally, we conclude that atomic lines arise from the PDR of 105-600.
The very low FWHM of CO lines observed with Herschel/ HIFI or APEX rule out the origin of this emission from relatively high-velocity shocks associated with the jet. The presence of the jet, however, suggest an accretion of matter onto a young star (see e.g. Konigl & Pudritz 2000). Different low-velocity shocks can be expected in forming disk such as an accretion shock at the surface of the molecular disk, shock waves launched deeper in the disk or residual shocks from the interaction of the jet surface with the disk (Boss & Durisen 2005). We used a C-shock code assuming a shock velocity of 4–6 km s-1, a magnetic field of 1–2 mG and a pre-shock density of 106 cm-3 to estimate the radiated energy to compare it with the UV energy absorbed. In the most favorable case, the radiated energy flux, or radiated power per unit of shocked surface, reaches 8.65 × 10⁻⁵ J m-2 s-1. The photo-electric effect injects a fraction  of the UV flux (G0,mol times the Habing’s field) into the gas. Hence, the power per unit of disk surface is
  where G0,mol is the UV radiation field incoming at the surface of the disk which is about 10% of the initial flux incoming on the envelope for the range of studied envelope densities. With these values and G0,mol = 2.2 × 10³, the energy flux is 3.52 × 10⁻⁵ J m-2 s-1. To have an important contribution from the shock, the comparison of the two sources of energy implies that the shocked surface has to be about 45% of the disk surface. Moreover, if it happens, some of the emitted lines can be of the order of the observations only if the shock is not FUV-illuminated. Otherwise the emission drops significantly. Hence we cannot fully exclude that shocks could have a contribution to the CO emission, however this requires that the shocked surface is large and that it is protected from UV radiation. Both constraints seem difficult to concile. Altogether, we conclude that shocks are unlikely to play a major role in the observed emission.
Appendix D: 105-600: mass and mass-loss rate
Appendix D.1: Molecular mass from 12CO and 13CO (3-2) lines
Column density of hydrogen in the molecular disk, and so its mass, can be estimated from the 12CO (3-2) and 13CO (3-2) transition lines. Under the assumption that the 13CO line to be optically thin, the column density of the upper energy level (here 3), noted Nu, is linked to the integrated intensity of the line,  (D.1)where ν is the frequency of the transition, Aul the Einstein emission-coefficient between the upper and the lower levels of the transition. h is the Planck’s constant, c the vacuum speed of light, kB the Boltzmann’s constant and ∫TB(13CO)dν the integrated intensity of the line. Additionally assuming that Local Thermodynamical Equilibrium (LTE) conditions are verified for 13CO, the column density of the upper level, Nu, is linked to the total one, N, by
  (D.2)where gu and Eu are respectively the statistical weight and energy of the upper level. Z is the partition function and Tex is the excitation temperature of the transition. This latter can be calculated thanks to the optically thick emission of 12CO since we have
 ![Mathematical equation: \appendix \setcounter{section}{4} \begin{equation} T_\mathrm{B}\left(^{12}\mathrm{CO}\right) = \frac{h\nu}{k_\mathrm{B}} \left[\frac{1}{\exp{\left(\frac{h\nu}{k_\mathrm{B} T_\mathrm{ex}}\right)}-1} - \frac{1}{\exp{\left(\frac{h\nu}{k_\mathrm{B} T_\mathrm{bb}}\right)}-1} \right], \end{equation}](/articles/aa/full_html/2017/08/aa29404-16/aa29404-16-eq287.png) (D.3)where Tbb = 2.7 K is the background temperature.
(D.3)where Tbb = 2.7 K is the background temperature.
From Sahai et al. (2012), we have TB(12CO) = 33.0 K so we get Tex = 40.8 K. With a line integrated intensity of ∫TB(13CO)dν = 0.96 K km s-1, we find N(13CO) = 3.53 × 1014 cm-2. Supposing an abundance ratio [H2] / [13CO] = 7 × 10⁵, we obtain the column density of H2, NH2 = 9.84 × 1022 cm-2. The molecular mass, Mmol, is finally calculated by  (D.4)where μ = 2.8 is the mean molecular weigh, mH is the mass of a hydrogen atom and S is the apparent surface visible is the beam of the instrument at the distance of the observed object. In our case, the molecular mass is Mmol ≈ 0.187 M⊙.
Appendix D.2: Consistency of mass estimates
We can roughly estimate of the disk mass assuming spherical geometry and making the strong hypothesis that the density is constant throughout the disk. In reality, the density deep in the disk could be much higher, so this estimate can be seen as a lower limit. From our PDR best-fit model, this mass is Mdisk ≳ 0.19M⊙. In the same way, we can evaluate the mass of the envelope assuming that the 3D shape is the one of an ellipsoid with axis of 9.5″ × 3.7″ × 3.7″ (from Table 1) which gives Menv ≈ 0.028M⊙ for the best-fit model.
We have used different methods to estimate the mass of each component in the Carina candidate proplyd. The mass of the atomic envelope is estimated to be about 0.05M⊙ from the SED (Sect. 4.1.1) and about 0.03M⊙ from the PDR models (Sect. 4.1.2). For the mass of the disk, the SED gives a value of about 0.7M⊙ (Sect. 4.1.1), consistent with the lower limit of 0.19M⊙ from the PDR model (Sect. 4.1.2). The fit on the thermal components of the dust emission using modified Planck’s functions is based on empirical parameters such as the spectral index β and the efficiency section σ. The latter is used to convert the dust opacity obtained from the fit in a total mass. Since the empirical value comes from observations in the galactic plane, it is valid only in environments relatively similar to the ISM, specially in terms of dust-to-gass mass ratio which typical value is 0.01. Our models with the Meudon PDR code also take into account this standard value of the dust-to-gas mass ratio and the comparison with the observations have shown that this value is most likely correct (see Appendix B).
Another estimation of the molecular mass, independent of the dust-to-gas mass ratio can be obtained using emission of molecular isotopologues. Sahai et al. (2012) have estimated, using their measurement of 12CO and 13CO (3-2) line fluxes, a mass of 0.35M⊙. With their observations, we use a slightly different method (see details in Appendix D.1) and obtained a value of 0.187M⊙ under the assumption that the 13CO line is optically thin while the 12CO is optically thick. Calculations with the online non-LTE molecular radiative transfer code RADEX (van der Tak et al. 2007) confirms that the 12CO line is optically thick but indicates that the 13CO starts to be thick considering the size and the density obtained from our models. Hence, this value of 0.187M⊙ is a lower limit.
Overall, estimates of masses are consistent but it is possible that values based on the dust emission are slightly overestimated. Using a dust-to-gas mass ratio a little higher (a few percent) than the typical value of 0.01, in agreement with what is often found for protoplanetary disks (Williams & Best 2014), could correct the small differences.
Appendix D.3: Mass-loss rate at ionisation front
Recombinations of electrons and protons in the HII region give rise to the Hα emission at the ionisation front with an intensity depending on the electron density ne (see Tielens 2005, Chap. 8). From the observed emission of 4 × 10⁻⁷ W m-2 sr-1 in the
HST/ACS/F658N filter (including Hα and [NII] 6583 Å lines), we have derived an upper limit for the electron density of ne ≤ 680 cm-3 when considering that all the flux is coming from the Hα line, which is probably close to the reality. Assuming a constant electronic density at the ionisation front all around the envelope, a shape of an ellipsoid of revolution with a surface S, and that the gas is escaping at the sound speed cS calculated here for a temperature of 104 K, the mass-loss rate is  (D.5)where μmH is the mean particle weight. With our values, this gives a mass-loss rate of the order of 2 × 10⁻⁶M⊙/yr for 105-600.
All Tables
Features of the observed lines (Herschel plus published/archival data available).
All Figures
|
Fig. 1 14″ × 14″ Hα images of the observed proplyds from HST/WFPC2/F656N or WFC/F658N. Overlaid are the dimensions of one spaxel of PACS (red square of 9.4″ × 9.4″) and the minimal FWHM of HIFI (green circle with a diameter of 11.3″) for the ones observed with Herschel. The ALMA beam of 0.99″ × 0.97″ is represented for 203-506. |
| In the text | |
|
Fig. 2 Level-2 calibrated spectra for the three targets: 105-600, HST10 and 244-440 respectively from top to bottom. Spectrally unresolved lines observed with PACS are presented on the left and resolved lines observed with HIFI lied on the right. The red vertical bars on HIFI spectra indicate the vLSR of the objects. |
| In the text | |
|
Fig. 3 Top: schematics of the apparent 2D geometry with parameters used in our adapted model of an externally-illuminated protoplanetary disk composed of a disk (blue) surrounded by an envelope (red). Bottom: 1D corresponding slab used to model the PDR of the proplyd. |
| In the text | |
|
Fig. 4 Best fit to the observed spectral energy distribution of the dust in 105-600 with a model including two components for the thermal emission and one for the emission of PAHs. Dots are detections while triangle represents upper limits. |
| In the text | |
|
Fig. 5 a) Modelled lines fluxes (105-600) for the considered density ranges (colored points) compared to observations (black diamonds). Uncertainties of observations are not plotted because they are smaller than the marker. b) χ2 comparing observed line integrated intensities of 105-600 and modelled values for the considered envelope and disk densities. c) Temperature at the ionisation front, overlaid are the χ2 contours. d) Temperature at the disk surface. In panels b, c, d, points are the positions where the models are calculated and the colors and contours result from interpolating the model results over these points. |
| In the text | |
|
Fig. 6 Comparison between best-fit model line integrated intensities and observed line integrated intensities for 105-600. |
| In the text | |
|
Fig. 7 PDR structure of the best-fit model for the Carina candidate proplyd 105-600. FUV radiation field is incoming from the left where the ionisation front is located at AV = 0. The disk surface, represented by a vertical dashed black line, is located at AV = 0.742. The small dark grey patch close to the disk surface illustrates the H/H2 transition (10 to 90% of H in H2) and the bright green patch illustrates the C+/CO transition (10 to 90% of C in CO). The dust temperature is given as a range corresponding to the temperature of the biggest to the lowest studied grains (radius of 3 to 300 nm). We note that the x-axis is in magnitude of visual extinction. In distance, the envelope represents about 11 000 AU while the green patch in the disk represents 300 AU. |
| In the text | |
|
Fig. 8 Comparison between observed line integrated intensities and best-fit models for the Orion proplyds. Observations are shown in black while estimated line integrated intensities using the outputs of the models (including the method of Störzer & Hollenbach (1998) for the [OI] 6300 Å line) are shown in blue. The heads of the black arrows give the upper limits for [CII] emission in the case of HST10 and 244-440. |
| In the text | |
|
Fig. 9 Modelled temperature at the disk surface as a function of the position of the H/H2 transition for various radiation fields and adopting the geometries of 105-600 as a large proplyd and HST10 as a small proplyd. The points are the positions where the models are calculated and corresponding solid lines are cubic interpolations. The dotted vertical line corresponds to Ptrans = 1. On the left side of this line, the H/H2 transition is inside the disk, while on the right side of this line the H/H2 transition is inside the envelope. |
| In the text | |
|
Fig. 10 Relative contribution of the main heating processes at the surface of the disk for different sizes of proplyd (size of 105-600 or HST10) and FUV field (2 × 10³, 2 × 10⁴ and 2 × 10⁵) as a function of the location of the H/H2 transition. |
| In the text | |
|
Fig. 11 Relative contribution of the main cooling processes at the surface of the disk for different sizes of proplyd (size of 105-600 or HST10) and FUV field (2 × 10³, 2 × 10⁴ and 2 × 10⁵) as a function of the location of the H/H2 transition. |
| In the text | |
|
Fig. A.1 Fit of the [CII] fine-structure line. The blue curve is the level-2 calibrated spectrum which is best fitted by the red curve. The positive dashed black line is the best model without the OFF line corresponding to the observation that we could have done if there was no contamination from the nebula. The negative one is OFF contamination model. Both Gaussians are fitted together and the residuals of the fit are given by the green curve. |
| In the text | |
|
Fig. B.1 Variations of the modelled line fluxes (a) and temperature profile (b) for various minimal grain size in the PDR model given in the legend. Here, densities are fixed to nenv = 1 × 104 cm-3, ndisk = 1 × 106 cm-3, the FUV field is G0 = 2 × 10⁴ and a gas-to-dust mass ratio of 100 is used. |
| In the text | |
|
Fig. B.2 Variations of the modelled line fluxes (a) and temperature profile (b) for various gas-to-dust mass ratio in the PDR model given in the legend. Here, densities are fixed to nenv = 1 × 104 cm-3, ndisk = 1 × 106 cm-3, the FUV field is G0 = 2 × 10⁴ and a minimal grain radius of 3 nm is used. |
| In the text | |
Current usage metrics show cumulative count of Article Views (full-text article views including HTML views, PDF and ePub downloads, according to the available data) and Abstracts Views on Vision4Press platform.
Data correspond to usage on the plateform after 2015. The current usage metrics is available 48-96 hours after online publication and is updated daily on week days.
Initial download of the metrics may take a while.